ABSTRACT
French bean (Phaseolus vulgaris L.) in Kenya is cultivated predominantly in the Central, Eastern and Rift Valley provinces. Despite its importance as an export commodity, there has been little breeding effort devoted to its improvement and no much focus on gaining an understanding of the genetic diversity of the germplasm used in cultivation. The present objective was to evaluate the genetic diversity of a set of 36 Kenyan French bean accessions, based on a combination of morpho-agronomic and simple sequence repeat markers (SSRs). For the former, 20 morpho-agronomic traits were measured in two growing seasons, while for the latter; the germplasm was genotyped at 26 SSR loci. The accessions varied significantly (P≤ 0.05) with respect to pod diameter, pod length, pod number per plant, pod weight per plant and seed weight, but not with respect to the number of days taken to reach flowering, leaf length, leaf width or plant height. There was a large influence of season over flowering time, pod diameter, pod length, plant height and seed weight, and a significant (P≤ 0.05) interaction between accession and season for pod diameter, pod length, pod weight per plant, number of pods per plant and seed weight. The variation in the morpho-agronomic traits split the 36 accessions into four clusters. Shannon-Weaver diversity indices for qualitative, pseudo-qualitative and four selected quantitative traits ranged from 0.23 to 0.88. Of the 26 SSR primer pairs, which successfully amplified all 36 DNAs, 18 were informative, producing a mean of 2.17 alleles per SSR locus and a PIC value between 0.17 and 0.41. The level of gene diversity ranged from 0.19-0.50 (mean 0.36). The low observed mean heterozygosity reflected the predominantly autogamous habit of French bean. The modest amount of genotypic variation uncovered can be attributed to the effect of intensive selection for pod quality. A phylogeny based on the informative SSR loci revealed three major clusters, each representing a different pod diameter class. Combining the morpho-agronomic and DNA-based markers in this assessment of germplasm provides a way of taking advantage of the best features of both marker types that can be useful for identification of French bean varieties and applications of molecular markers to breeding.
Key words: French beans, morpho-agronomic traits, simple sequence repeat marker (SSR), genotyping, large-sieve beans, fine-sieve beans.
French beans comprise a sub-group of common bean (Phaseolus vulgaris L.) germplasm grown for their immature pods, which when immature, have low fibre content and consumed as a green vegetable (Myers and Baggett, 1999). They are variously referred to as ‘snap beans’, ‘garden beans’ and ‘haricot beans’. French bean is a leading export crop for Kenya (Monda et al., 2003), which produces annually around 61.5 t, which represents a major financial share of the export vegetable sector (HCDA, 2010). Despite its importance as an export commodity, there has been little breeding effort devoted to its improvement and no much focus on gaining an understanding of the genetic diversity of the germplasm used in cultivation.
The value of characterizing genetic diversity is in the identification of genetically diverse pairs of crossing parents for crop improvement. Various sources of germplasm are available to the breeder, including elite cultivars, popular commercial cultivars, breeding lines, mutants, landraces and wild materials (Ram, 2014). Elite germplasm is generally preferred for cultivar development because it has benefited from intensive selection for optimal alleles, as well as being relatively straightforward to source (de Moraise and Pinhero, 2012). Much of the effort applied to assessing the genetic diversity present in common bean has focused on germplasm used for pulse production, rather than on the French bean. The genetic status and ancestry of French bean cultivars has been explored by Davis and Myers (2002), Cunha et al. (2004) and Blair et al. (2010). However, the information available is varied and as a result, a general study involving many accessions in a particular region is essential. While morpho-agronomic variation is the foundation for crop improvement, few traits are simply inherited and many are markedly influenced by the plants' growing environment; in contrast, variation at the DNA level is, by definition, not multigenic, and is free of environmental influence. While DNA-based markers are now in routine use as a tool for assessing genetic diversity, morpho-agronomic characters still play an important role (Gomez et al., 2004; Stoilova et al., 2005), and a combined approach has been recommended (Singh et al., 1991).
A number of different marker platforms have been exploited to assess genetic diversity in common bean (Skroch and Nienhuis, 1995; Cunha et al., 2004; Kwak and Gepts, 2009; Sarikamis et al., 2009; Biswas et al., 2010; Blair et al., 2010). The use of markers has demonstrated that common bean was domesticated twice, leading to the development of two separate genepools: the Mesoamerican (Northern Mexico to Colombia) and the Andean (Southern Peru to Northwestern Argentina) (Gepts et al., 1986; Beebe et al., 2000; 2001; Blair et al., 2006) types. Microsatellites or simple sequence repeats (SSRs) have proven to be highly effective as markers, as they are typically co-dominant, multi-allelic and informative, and are very numerous throughout the genome. Large numbers of SSR assays have been developed in common bean (Yu et al., 1999, 2000; Gaitán-Solís et al., 2002; Grisi et al., 2007; Blair et al., 2003; 2011), and so are available for genetic analyses in French bean. Here, the objective was to evaluate the genetic diversity of a Kenyan collection of French bean accessions, based on a combined morpho-agronomic trait and SSR marker data set.
Plant material
The germplasm panel comprised a set of 36 French bean accessions from Kenya: of these, 28 are commercially grown cultivars, five are advanced breeding lines and three are landraces. The seed was initially multiplied and purified. The accessions are identified by the prefix FBK (“French Beans Kenya”), followed by an accession number.
Experimental site
The germplasm was assessed in the field at Meru (0° 07' N, 37º 40' E, 1490 m above sea level), first in November 2010 (short season) and then in March 2011 (long season). Normal rainfall (annual mean 1250 mm) at the site is bimodal, with the major rainy season expected between March and July and the short one between October and December. The long term minimum and maximum temperatures at the site are, respectively, 12 and 25°C. The soil is deep, well-weathered, free-draining, has a friable clay texture and moderate to high inherent fertility, and has been classified as a humic nitisol (Jaetzold et al., 2006). In the first season, the precipitation was 569.7 mm and the minimum and maximum temperatures were, respectively, 11.4 and 24.0ºC; the equivalents for the second season were 489.3 mm, 13.4 and 24.0°C. The experimental plots were chosen to ensure that no legumes had been grown in either of the two preceding seasons.
Crop management
Land previously cropped to maize was prepared to give a fine tilth. The experiment was laid out as a triple lattice design, with each 3 m × 1.2 m plot forming an experimental unit.
Planting was done to a seeding rate of 25 kg ha-1. Diammonium phosphate fertilizer was applied at sowing to supply 36 kg ha-1 N and 40 kg ha-1 P, and a top dressing of calcium ammonium nitrate was given in two applications to supply 27 kg N ha-1 three weeks after sowing and a similar amount at the onset of flowering. The experiment was irrigated to field capacity when required. Weeds were controlled manually and the crop was protected from insect pests by spraying with dimethoate one week after germination.
Morpho-agronomic data
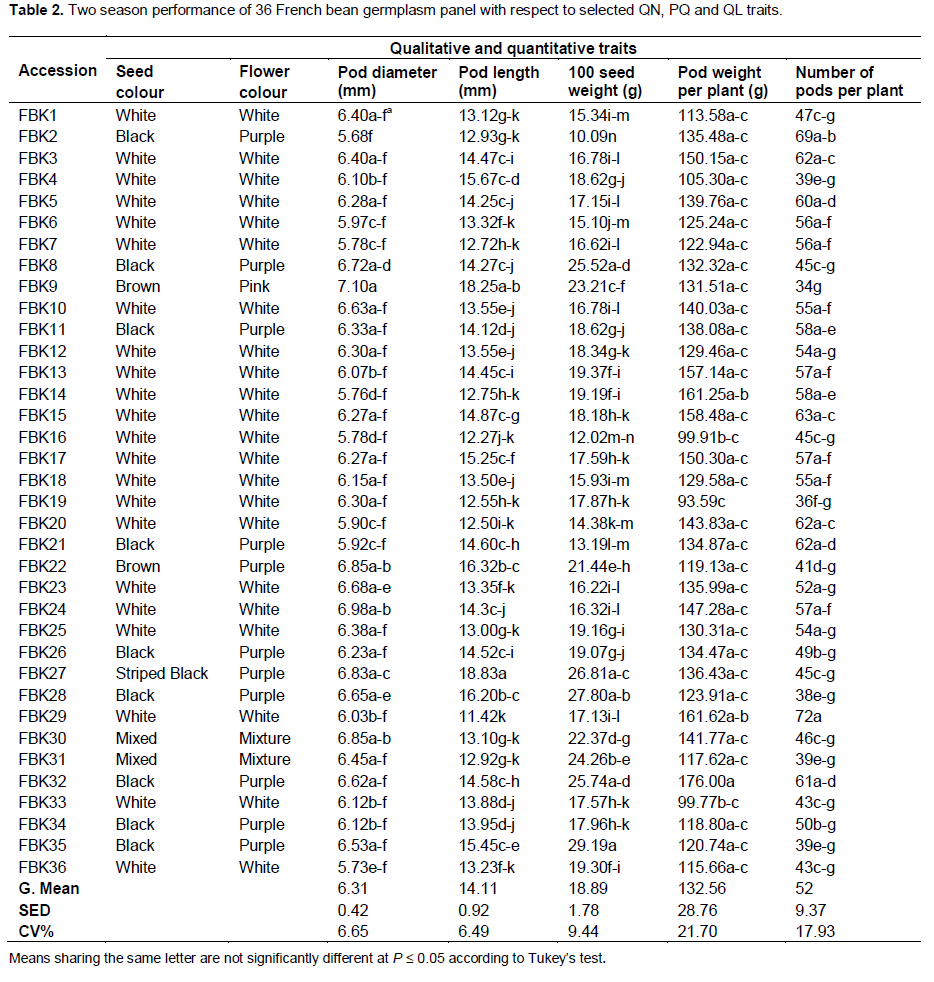
A set of 20 traits, based on the International Union for the Protection of New cultivars of Plants (UPOV) descriptors (2008), was evaluated. Some were qualitative (QL), some pseudo-qualitative (PQ) and the remainder quantitative (QN) in nature. A sample of ten plants were used to derive the mean performance with respect to plant height, leaf length and leaf width, while pod traits were gathered from a sample of 30 pods per plot, harvested at the fresh market stage. The other traits (inflorescence position, intensity of leaf and pod color and degree of pod curvature) were based on a whole plot observation. Numerical values were assigned to the traits to aid the data analysis. The 13 QN traits were: leaf width (measured at the broadest point at the base of the terminal leaflet of the third trifoliate leaf); leaf length (measured in the middle of the terminal leaflet of the third trifoliate leaf from the pulvinus to the leaf tip); the number of days to flowering (the time elapsed from sowing until 50% of the plants in a plot showed one open flower); plant height (measured at the flowering stage from the ground surface to the tip of the main stem at flowering); intensity of pod color; degree of pod curvature; inflorescence position; intensity of leaf color; pod diameter (measured by passing the pods through a set of holes of known diameter); pod length (measured from the apex to the penducle); pod weight per plant (determined from the weight of pods per plot and the number of plants per plot); number of pods per plant (determined from the number of pods per plot and the number of plants per plot); and seed weight (the weight of 100 mature seeds at 14% moisture content). The five PQ traits were: Wing flower color of freshly opened flowers; pod ground color; the shape of pod curvature, the shape of seeds that were cut longitudinally, the colour of seeds obtained from the middle of a dry pod and pod shape (evaluated by cutting across the middle of a pod through a developing seed). The two QL traits were growth habit and anthocyanin pigmentation of the hypocotyl.
Statistical analyses
A univariate analysis of variance (ANOVA) was performed for each QN traits using SAS software package, release 8.1 (SAS, 1999). Each season's data were subjected to the general linear model, according to the Cochran and Cox (1962): Yijkl = µ + πi +βj + τk+εijkl, where µ represented the grand mean, πi the effect due to the ith replicate, βj the effect due to jth incomplete block, τk the effect due to kth accession and εijkl the intra-block residual. The gain in precision achieved by the use of a triple lattice design compared to a randomized complete block design was calculated according to Cochran and Cox (1962). As it lay between just 0 and 8.4% for each trait, the data were finally analyzed assuming an RCBD design, following the model Yijkl = µ + λi+ π (j)i + τk + λτik + εijkl, where λi was the effect due to the ith season, πj(i) the effect due to jth replicate in the ith season, τk the effect due to the kth accession, λτjk the interaction between the kth accession and the ith season and εijkl the residual effect. The PQ, QL and four QN traits were subjected to a frequency distribution analysis.
Estimate of variability for each PQ and QL traits, along with the four QN traits assigned a numerical value, were computed in Microsoft Excel and the standard Shannon-Weaver diversity index (H’) was computed from −∑ Pi (logePi)/logen, where Pi was the frequency proportion of each trait and n the number of classes recognized for the trait. H’ has a value ranging from 0 (no diversity) to 1 (maximum diversity). The subsequence cluster analysis was performed by routines implemented within NTSYS v2.11 (Rohlf, 2000), using normalized data, based on the UPGMA algorithm (Sneath and Sokal, 1973) and Euclidean distance analysis.
Genotypic analysis
Plants used for DNA extraction were raised in a greenhouse maintained at 25 ± 5°C. Leaves sampled from three week old plants were crushed with a mortar and pestle, and the homogenate spotted onto an Whatman FTA card, which was left to dry at room temperature for 2 h. Discs were cut from the card and processed according to the protocol provided by the manufacturer
(www.gelifesciences.com/Whatman). Discs not used immediately for a PCR were stored at 4°C. A set of 26 SSR assays, detecting loci across all 11 chromosomes of common bean genome (Blair et al., 2003; Grisi et al., 2007), was selected. Each 20 µl PCR was set up in an AccuPower® PCR pre-mix tube (Bioneer Inc., Alameda, USA) and comprised one FTA disc, 0.2 µM of each of the forward and reverse primers, 10 mM Tris-HCl (pH 7.2), 30 mM KCl, 1.5 mM MgCl
2, 250 mM dNTP and 1 U
Taq polymerase. The amplification program consisted of an initial denaturation (94°C/2 min); followed by 30 cycles of a 94°C/30 s denaturation step, a T
a/60 s annealing step and a 72°C/40 s extension step; ending with a 72°C/3 min final extension. The annealing temperature (T
a) was optimized for each primer pair. After the addition of 4 µL loading buffer (10 mM Tris-HCl, 0.03% w/v bromophenol blue, 0.03% w/v xylene cyanol FF, 60% v/v glycerol, 60 mM EDTA), the amplicons were electrophoresed through a 6% non-denaturing polyacrylamide gel, run horizontally at 100 V for 3 h, and visualized by ethidium bromide staining .
Statistical analyses
SSR allele sizes were assigned based on the amplicon's migration through the gel in comparison to that of a 100 bp ladder. The average number of alleles and gene diversity, Shannon’s index (I), observed and expected heterozygosity and polymorphism information content (PIC) were calculated for each SSR locus using PowerMarker v3.25 software (Liu and Muse, 2005). Genetic distances were calculated using the Chord distance (Cavalli-Sforza and Edwards, 1967) and an unweighted pair group arithmetic mean (UPGMA) tree was constructed. The DNA marker- and morpho-agronomic data-based matrices were compared by transforming the two matrices to Euclidean coefficients and computing a matrix correlation coefficient (r) via matrix comparison (MXCOMP) analysis implemented in NTSYS v2.11. Tables of critical r values were used to assess the similarity of the two phylogenies (Lapointe and Legendre, 1992).
Morpho-agronomic trait variation
All 36 accessions had a determinate growth habit, 64% formed rectangular shaped seeds, and 60% were white-seeded and produced white flowers (Table 1). Nine accessions were black- and two were brown- seeded. All but one of the accessions formed green pods, although the intensity of pigmentation varied. Secondary seed coat colors were observed in accessions FBK27, FBK30 and FBK31. The black-seeded accessions produced purple flowers and their hypocotyl was pigmented, while the brown-seeded ones produced either purple or pink flowers. The diversity indices for the QL, PQ and the four selected QN traits ranged from 0.23 to 0.88. Seed color, shape of pod curvature, pod cross-section shape, degree of pod curvature and flower color were all moderately variable (0.56 to 0.69), while the other traits were highly variable (0.71 to 0.88).

The ANOVA confirmed significant (P ≤ 0.05) differences with respect to pod diameter, pod length, number of pods per plant, pod weight per plant and seed weight, but not with respect to flowering time, leaf length, leaf width or plant height. The season had a significant (P ≤ 0.05) effect on flowering time, pod diameter, pod length, plant height and seed weight. A significant (P ≤ 0.05) accession × season interaction was associated with the following traits: pod diameter and length, pod weight per plant, number of pods per plant and seed weight. The mean number of days to flowering, leaf width, leaf length and plant height were, respectively, 34.7 days, 6.4 cm, 10.3 cm and 36.5 cm. The smallest pod diameter was set by FBK2 (5.7 mm), a size which was significantly (P ≤ 0.05) less than that of the pods set by FBK8 (6.7 mm), FBK9 (7.1 mm), FBK22 (6.8 mm), FBK23 (6.7 mm), FBK27 (6.8 mm), FBK28 (6.6 mm) and FBK30 (6.8 mm) (Table 2). The longest pods were produced by FBK27 (18.8 cm) and FBK9 (18.2 cm), and the shortest by FBK29 (11.4 cm).
SSR genotyping
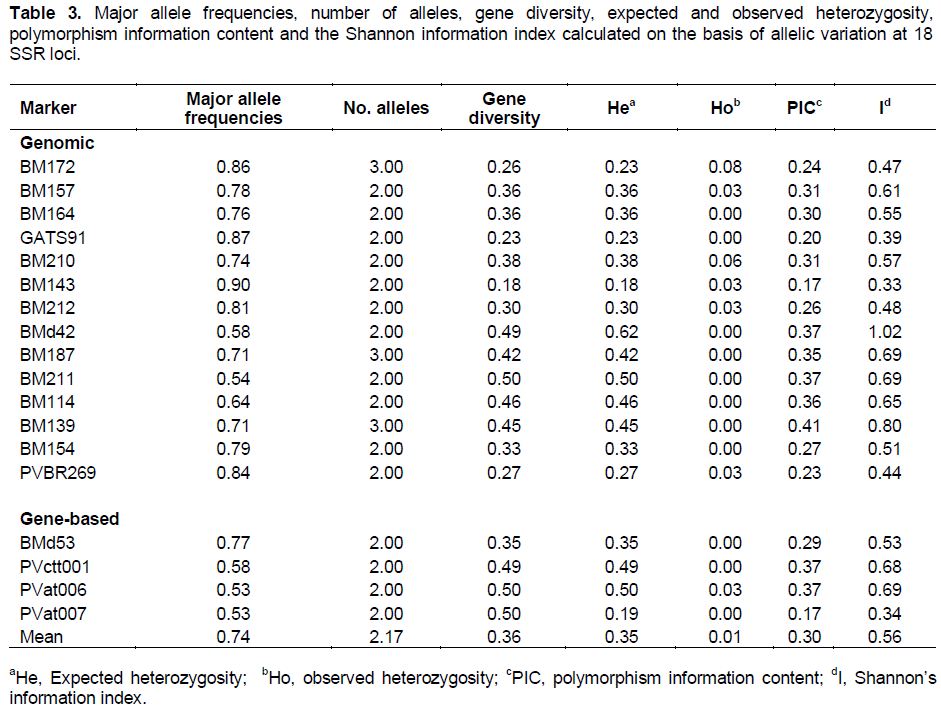
All the 26 SSR primers successfully amplified the template from each accession. In all, 18 of the 26 (14 based on genomic DNA (gDNA) sequence, and four on complementary DNA (cDNA) assays were informative, revealing a total of 39 alleles (a mean of 2.2 alleles per informative locus). The level of polymorphism, in terms of the number of alleles, the major allele frequency, gene diversity, expected and observed heterozygosity, polymorphism information content and Shannon Weaver’s information indices is presented in Table 3. Two alleles were recognized by 15 of the informative SSRs, while three were revealed by BM139, BM187 and BM172. The PIC value ranged from 0.17 to 0.41, and the majority of the informative SSRs (72%) were classified as being moderately polymorphic (PIC ≥ 25%). Of the eight non-informative SSRs, five were based on cDNA sequence and three on gDNA. The level of gene diversity ranged from 0.19 to 0.50 (mean 0.36), and the observed mean heterozygosity was low (mean 0.01). The mean Shannon index was 0.56, suggesting a moderate level of diversity among the accessions.
Phylogenetic analysis
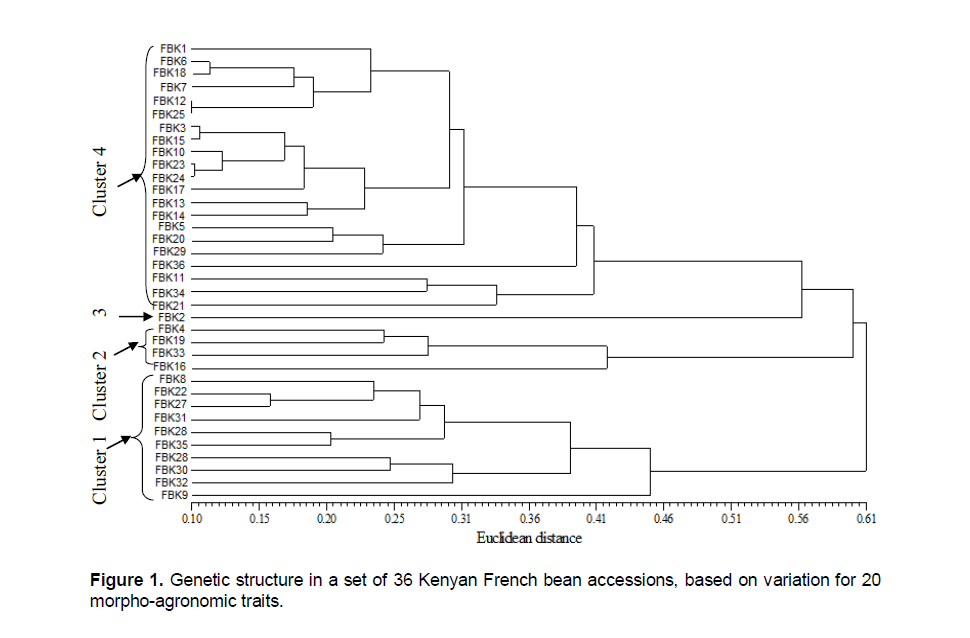
The phylogenetic analysis based on the morpho-agronomic traits arranged the accessions into four clusters (Figure 1), with the most determinative traits being the number of pods per plant, seed weight and seed/flower color. The first cluster was populated by FBK9, FBK32, FBK30, FBK26, FBK35, FBK28, FBK31, FBK27, FBK22 and FBK8, which all produced large, non-white seeds and a small number of pods per plant. The second group consisted of the white-seeded accessions FBK16, FBK33, FBK19 and FBK4, which also set a low number of pods per plant. The accession FBK2 did not cluster with any other accession and it was therefore designated 3 representing the third group. The fourth cluster was characterized by accessions able to produce many pods harboring small seeds. There was a distinct sub-clustering in this group, separating the black- and white-seeded accessions. The wax bean (yellow pods) FBK1 belonged to cluster 4. Cultivars derived from individual breeding programs tended to group together - for example FBK11 / FBK34, FBK12 / FBK25 and FBK20 / FBK13 / FBK23 / FBK24.
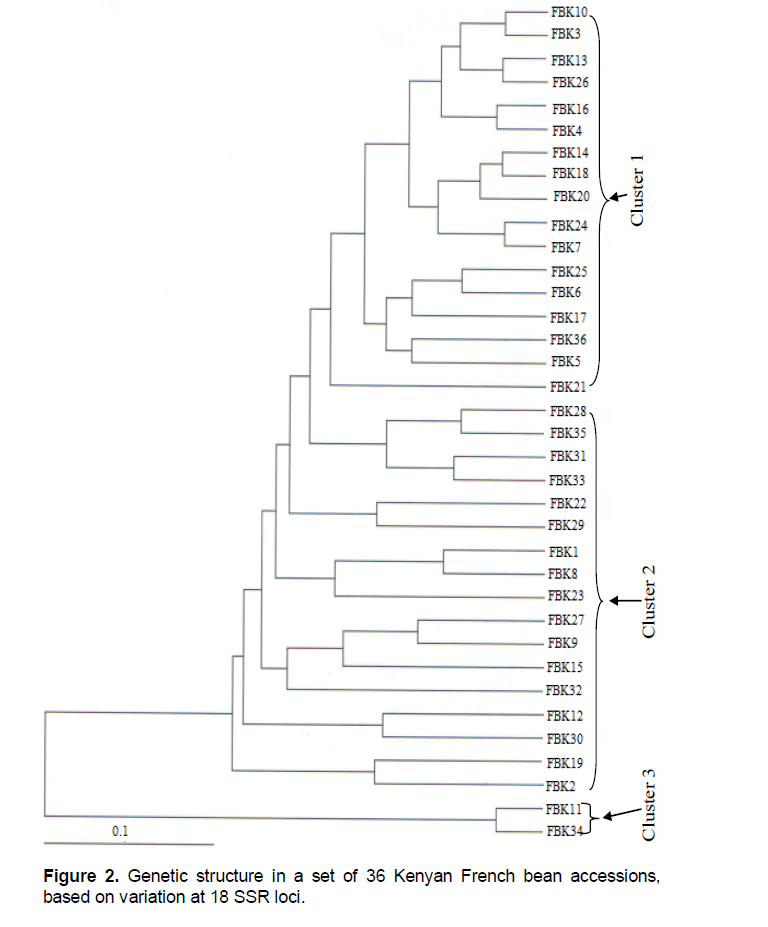
The phylogenetic analysis based on the SSRs split the accessions into three main clusters (Figure 2). The first cluster was dominated by low pod diameter (<6.5 mm) accessions (FBK3, FBK13, FBK26, FBK16, FBK4, FB14, FBK18, FBK20, FBK7, FBK25, FBK6, FBK17, FBK36, FBK5 and FBK 21). The second cluster was a mixture of large and small pod diameter accessions, although the former predominated. The large pod diameter accessions were FBK 28, FBK35, FBK31, FBK9, FBK22, FBK8, FBK23, FBK27, FBK9, FBK30, FBK32 and the wax bean FBK1. The accessions with small pod diameters were FBK 33, FBK15, FBK12, FBK19 and FBK2. The third cluster contained just FBK11 and FBK34.
There was little similarity between the dendrograms produced from the two marker types (correlation coefficient 0.02).
Diversity based on morpho-agronomic traits
A significant level of morpho-agronomic variation was represented in the set of Kenyan French beans, both with respect to the quantitative and the qualitative traits. Many of the key breeders' traits (the number of pods per plant, yield per unit area, pod width and length, and seed weight) were influenced by the growing environment, which differed more markedly for the amount of rainfall experienced than for any other climatic factors. All of the accessions had a determinate growth habit, which reflects breeder selection pressure, since determinate types tend to produce higher quality pods (Blair et al., 2010); while at the same time reducing the labor required for crop management and harvesting. Most of the accessions produced white seeds and white flowers, and lacked non-green pigmentation of the hypocotyl, as also observed in the germplasm analyzed by Pandey et al. (2011). A preference for white seededness reflects the needs of the processors, who do not favor coloured seed as anthocyanins are prone to leach during canning, leading to an unattractive product (Myers and Baggett, 1999). A further advantage of white seededness is that the seeds are less prominent in the immature pod (Blair et al., 2010).
Given that the pod represents the consumer product of the French bean, its quality is of paramount importance. The relevant pod traits are its internal and external color, its uniformity of color, its length, its cross-sectional shape, its straightness, its smoothness, its fiber content, the rate of seed development and it’s the point of detachment from the plant (Pandey et al., 2011). Pod traits have importance in some other legumes too, as for instance in Dolichos lablab, where the pods of crops intended for fresh consumption or for processing need to be green (Islam et al., 2010). The present germplasm set displayed only a low level of diversity with respect to pod color (0.23), although there was some variation with respect to both hue and intensity, with a few accessions producing dark green pods. These accessions (FBK13 and FBK10) are marketed domestically for fresh consumption.
French beans are conventionally classified as either large-sieve (large podded) types, wax types or fine-sieve (thin podded) types. Most of the fine-sieve types have diameters that are less than 6.5 mm and fetch higher prices as compared to the large-sieve types. It was observed in this study that most accessions with large pod diameters beans tend to have long pods and were categorized as large-sieve beans. The ideal pod length for processing is 10 to 16 cm, since pods longer than this are incompatible with processing equipment operated in Kenya (HCDA, 2005). Almost all the current set of white-seeded accessions, along with a few of the black-seeded ones, produced pods of the appropriate length for processing, and their pod diameter was small enough (<6.5 mm) to fall into the fine (small-sieve) class. They also exhibited an oval type cross-section and weak pod curvature, properties which maximize their durability and consumer attractiveness. Processors tend to favor a round type cross-section because of the relationship between pod diameter, quality and maturity when round pods are mechanically sorted. The overall conclusion is that the Kenyan breeders' concentration on pod related traits has focused on maximizing the number of pods per plant, pod weight, diameter and length, and seed size.
The phylogenetic analysis identified seed weight, the number of pods per plant, flower color and seed color as being the major traits distinguishing the 36 French bean accessions. A similar set of discriminating traits has been observed in other diversity analyses in common bean (Gepts et al., 1986; Hornakova et al., 2003; Stoilova et al., 2005; Salehi et al. 2008). Singh et al. (1991) have noted that Andean common bean accessions tend to develop a higher number of nodes before flowering than those belonging to the Mesoamerican genepool, along with larger leaflets and seeds. Seed size and color constraints are different in French beans than in dry beans, so the distinction between Andean and Mesoamerican types based on seed size has been blurred in French bean germplasm (Blair et al., 2010). In addition, it was apparent that the largest seeded accessions formed purple/pink flowers and black/brown seeds which were separated from the small seeded accessions most of which produced white flowers. The relationship between pod length and seed weight; seed size and seed colour, may be reflected by the effect of genetic linkage, since genetic determinants of pod length and seed weight are linked on both linkage groups D1 and D7; in addition one of the factors for seed size maps close the P locus (controlling seed color) on D7 (Koinange et al., 1996).
The SSR markers used here were a mix of gDNA- and cDNA-derived assays. Five of the eight cDNA-derived loci were non-informative, compared to just three of the 18 gDNA-derived ones. The relatively poor informativeness of cDNA-derived SSRs has been noticed previously both in common bean (Blair et al., 2003; Zhang et al., 2008), as well as in a number of other crops (Cho et al., 2000; Eujayl et al., 2002; Thiel et al., 2003; Ohyama et al., 2009). The PIC values and the number of alleles recognized here were both lower than those calculated by Sarikamis et al. (2009) and Blair et al. (2010). The low level of polymorphism observed here may reflect a low diversity in Kenyan germplasm at those particular loci. However, the use of capillary electrophoresis with a higher resolution as compared to PAGE is recommended for analyzing this kind of germplasm. The low level of heterozygosity observed is consistent with the predominantly autogamous habit of common bean (Beebe et al., 1997). As a result, a further use of the SSRs could be to detect residual heterozygosity in late generation selections and breeder's seed lots. The level of SSR-based genetic diversity of the Kenyan material was similar to that recorded by Metais et al. (2002) in an analysis of Andean type French bean germplasm, but lower than that recorded by Blair et al. (2010). This can be explained by the fact that the germplasm used by Blair et al. (2010) were mostly pole beans while this study evaluated determinate beans most of which are used for commercial purposes.
As similarly reported by Skroch and Nienhuis (1995), the present phylogenetic analysis was largely effective in discriminating between the small and large pod diameter accessions. The many small- sieve accessions had a high genetic similarity among themselves similarly to the work of Cunha et al. (2004), perhaps because of the intensity of selection by French bean breeders against large and pigmented seeds. Nevertheless, a few small pod diameter accessions clustered with the major group of large pod diameter ones and vice versa and this can be attributed to lineage relationships. Intense selection employed by French bean breeders for pod diameter, pod length, seed and pod color have probably narrowed the genetic base of an already rather narrow genepool, thereby reducing the genetic distance between the remaining cultivated types.
A comparison of morpho-agronomic and genotypic diversity in Kenyan French beans
Both the morpho-agronomic traits and the SSR genotype were effective in discriminating between the major groups represented by small and pod diameter types (which correspond to large- and small-seeded types). However, the two phylogenies were only poorly correlated with one another. The most likely explanation for the failure of SSR genotyping to mirror the groups defined by the morpho-agronomic traits is that most of the plants traits are under polygenic control. Thus the same phenotype can be arrived at by two (or more) genetically quite independent routes, so that two identical states of a given trait do not necessarily imply an identical genotype. A further problem is that many morpho-agronomic traits are modulated by the environment. DNA-based markers avoid both of these weaknesses (Collard et al., 2005), but on the other hand the amount of information provided by an individual SSR is small, unless it happens to be tightly linked to a gene responsible for a significant agronomic trait. Combining morpho-agronomic and DNA-based markers in the assessment of germplasm provides a way of taking advantage of the best features of both marker types.
The authors wish to acknowledge Kirkhouse Trust for funding the study and University of Eldoret where the research was conducted.
The authors have not declared any conflict of interest.
REFERENCES
Beebe S, Toro O, González AV, Chacón MI, Debouck D (1997). Wild-weed-crop complex of common bean (Phaseolus vulgaris L., Fabaceae) in the Andes of Peru and Colombia, and their implications for conservation and breeding. Genet. Res. Crop Evol. 44:73–91.
Crossref |
|
|
Beebe S, Skroch P, Tohme J, Duque M, Pedraza F, Nienhuis J (2000). Structure of Genetic Diversity among Common Bean Landraces of Middle-American Origin Based on Correspondence Analysis of RAPD. Crop Sci. 40:264-273.
Crossref |
|
|
Beebe SE, Rengifo J, Gaitan E, Duque M, Tohme J (2001). Diversity and origin of Andean landraces of common bean. Crop Sci. 41:854–86.
Crossref |
|
|
|
Biswas MS, Hassah J, Hussain MM (2010). Assessment genetic diversity in French bean (Phaseolus vulgaris) based on RAPD markers. Afr. J. Biotechnol. 9(32):5073–5077. |
|
|
Blair MW, Pedraza F, Bundia HF, Gaitan – Solis E, Beebe SE, Gepts P, Tohme J (2003). Development of a Genome –wide Anchored Microsatellite Map for Common Bean (Phaseolus vulgaris L.). Theor. Appl. Genet. 106:251-261.
Crossref |
|
|
Blair MW, Giraldo MC, Buendia HF, Tovar E, Duque MC, Beebe S (2006). Microsatellite Marker Diversity in Common Bean (Phaseolus vulgaris L.). Theor. Appl. Genet. 113:100-109.
Crossref |
|
|
Blair MW, Chaves A, Tofino A, Calderon JF, Palacio JD (2010). Extensive Diversity and Inter-gene Pool Introgression of in a World-wide Collection of Indeterminate Snap Bean Accessions. Theor. Appl. Genet. 120:1381–1391.
Crossref |
|
|
Blair MW, Hurtado N, Chavarro CM, Munoz-Torres MC, Giraldo CM, Pedraza F (2011). Gene-based SSR Markers for CommonBean (Phaseolus vulgaris L.) Derived from Root and Leaf Tissue ESTs: An Integration of the BMc Series. BMC Plant Biology 11: 50.
Crossref |
|
|
Cavalli-Sforza LL, Edwards AWF(1967). Phylogenetic analysis: Models and estimation procedures. Am. J. Hum. Genet. 19: 233–257.
Crossref |
|
|
Cho YG, Ishii T, Temnykh S, Chen X, Lipovich L, McCouch SR, Park J, Ayres N, Cartinhour S (2000). Diversity of microsatellites derived from genomic libraries and GenBank sequences in rice (Oryza sativa L.). Theor. Appl. Genet. 100:713–722.
Crossref |
|
|
|
Cochran WG, Cox GM (1962). Experimental Designs (2nd Ed.). John Wiley, New York. |
|
|
Collard BCY, Jahufer MZZ, Brouwer JB, Pang ECK (2005). An Introduction to Markers, Quantitative Trait Loci (QTL) Mapping and Marker-Assisted Selection for Crop Improvement: The Basic Concepts. Euphytica 142:169-196.
Crossref |
|
|
|
Cunha C, Hintz T, Griffiths P (2004). Genetic diversity of French bean cultivars determined using randomly amplified polymorphic DNA (RAPD) markers. Hortiscience 39(3):481–484. |
|
|
|
Davis J, Myers JR (2002). Phylogenetic analysis of French beans using RAPD markers. Ann. Rep. Bean Impr. Coop. 45:16-17. |
|
|
De Moraise AA, Pinheiro BJ (2012). Breeding for resistance to insect pests in Fritsche-Neto R, Borem A, editors. Plant breeding for biotic stress resistance. Spinger, Heidelberg.
Crossref |
|
|
Eujayl I, Sorrells ME, Baum M, Wolters P, Powell W (2002). Isolation of EST-derived Microsatellite Markers for Genotyping the A and B Genomes of Wheat. Theor. Appl. Genet. 104:399-407.
Crossref |
|
|
Gaitán-Solís E, Duque MC, Edwards KJ, Tohme J (2002). Microsatellite Repeats in Common Bean (Phaseolus vulgaris): Isolation, characterization, and cross-species amplification in Phaseolus ssp. Crop Sci. 42:2128-2136.
Crossref |
|
|
Gepts P, Osborn TC, Rasca K, Bliss FA (1986). Phaseolin variability in wild forms and landraces of the common bean (Phaseolus vulgaris): Evidence for multiple centers of domestication. Econ. Bot. 40:451–468.
Crossref |
|
|
Gomez JO, Blair MW, Frankow-Lindberg BE, Gullberg U (2004). Molecular and phenotypic diversity of common bean landraces from Nicaragua. Crop Sci. pp. 1412–1418.
Crossref |
|
|
|
Grisi MCM, Blair MW, Gepts P, Brondani C, Pereira PA, Brondani RP (2007). Genetic mapping of a new set of microsattelite markers in a reference common bean (Phaseolus vulgaris) population BAT 93 × Jalo EEP558. Genet. Mol. Res. 6(3):691-706. |
|
|
|
HCDA (2010). Horticultural Crops Development Authority. Marketing Newsletter (10th Ed). Retrieved on September, 30th, 2011 from www.hcda.or.ke/downloads/New%20Letters/june_2010.pdf |
|
|
|
HCDA (2005). French beans (Phaseolus vulgaris L.). Horticultural Crops Development Authority. Export Crop bulletin No. 01, Nairobi, Kenya. |
|
|
|
Hornakova O, Zadova M, Zakova M, Kraic J, Debre F (2003). Diversity of Common Bean Landraces Collected in the Western and Eastern Carpatien. Czech J. Genet. Plant Breed.-UZPI 39: 73-83. |
|
|
Islam MS, Rahman MM, Hossain T (2010). Physico-Morphological Variation in Hyacinth Bean (Lablab purpureus (L.) sweet). Bangladesh J. Agr. Res. 35(3): 431-438.
Crossref |
|
|
|
Jaetzold R, Schimdt H, Hornetz B, Shisanya C (2006). Farm management handbook of Kenya. Natural conditions and farm information Vol II/C. East Kenya. Ministry of Agriculture, Nairobi. |
|
|
Koinange EMK, Singh PS, Gepts P (1996). Genetic control of domestication syndrome in common bean. Crop Sci. 36:1037-1045.
Crossref |
|
|
Kwak M, Gepts P (2009). Structure of genetic diversity in the two major gene pools of common bean (Phaseolus vulgaris L. Fabaceae). Theor. Appl. Genet. 118:979-992.
Crossref |
|
|
Lapointe FJ, Legendre P (1992). Statistical significance of the matric correlation coefficient for comparing independent phylogenetic Trees. Syst. Biol. 41(3):378-384.
Crossref |
|
|
Liu KJ, Muse SV (2005). Power Marker: An integrated analysis environment for genetic marker analysis. Bioinformatics. 21: 2128–2129.
Crossref |
|
|
Metais I, Hamon B, Jalouzot R, Peltier D (2002). Structure and level of genetic diversity in various bean types evidenced with microsatellite markers from a genomic enriched library. Theor. Appl. Genet. 104:1346-1352.
Crossref |
|
|
|
Monda EO, Munene S, Ndegua A (2003). French bean production constraints in Kenya. Afri. Crop Sci. Conf. Proc. 6:683-687. |
|
|
Myers JR, Baggett JR (1999). Improvement of French beans. In: Singh SP, editor. Common bean improvement for the 21st century. Kluwer, Dordrecht.
Crossref |
|
|
Ohyama A, Asamizu E, Negoro S, Miyatake K, Yamaguchi H, Tabata S, Fukuoka H (2009). Characterization of Tomato SSR Markers Developed using BAC-end and cDNA Sequences from Genome Databases. Mol. Breed. 23:685-691.
Crossref |
|
|
|
Pandey RY, Gautam DM, Thapar BR, Sharma DM, Paudyal PK (2011). Variability of French bean in the Western Mid hills of Nepal. Kasetsart J. 45: 780-792. |
|
|
|
Ram M (2014). Plant Breeding Methods. PHI Learning Pvt Ltd, Delhi. |
|
|
|
Rohlf FJ (2000). NTSYSpc Numerical Taxonomy and Multivariate Analysis System. Exeter, New York. |
|
|
|
Salehi M, Tajik M, Ebadi AG (2008). The study of the relationship between different traits in common Bean (Phaseolus vulgaris L.) with Multivariate Statistical Methods. American-Eurasian J. Agric. Environ. Sci. 3:806-809. |
|
|
Sarikamis G, Yasar F, Bakir M, Kazan K, Ergul A (2009). Genetic characterization of green bean (Phaseolus vulgaris) accessions from Eastern Turkey. Genet. Mol. Res. 8(3):880-887.
Crossref |
|
|
|
SAS (1999). The SAS System for Windows. SAS Institute, Cary. |
|
|
Singh SP, Gutierrez JA, Molina A, Urrea, Gepts P (1991). Genetic Diversity in Cultivated Common bean: II. Marker-based analysis of morphological and agronomic traits. Crop Sci. 31:23–29.
Crossref |
|
|
|
Skroch P, Nienhuis J (1995). Qualitative and quantitative characterization of RAPD variation among French bean (Phaseolus vulgaris) accessions. Theor. Appl. Genet. 91: 1078-1085. |
|
|
|
Sneath PHA, Sokal RR (1973). Numerical Taxonomy. Freeman, San Francisco. |
|
|
|
Stoilova T, Pereira G, Sousa TMM, Carnide V (2005). Diversity in Common Bean Landraces (Phaseolus Vulgaris L.) from Bulgaria and Portugal. J. Cent. Eur. Agric. 6(4):443-448. |
|
|
|
Thiel T, Michalek W, Varshney RK, Graner A (2003). Exploiting EST databases for the development and characterization of gene-derived SSR-markers in barley (Hordeum vulgare L.). Theor. Appl. Genet. 106: 411-422. |
|
|
|
UPOV (2008). French Bean (Phaseolus vulgaris L.). Retrieved June, 13th, 2010 from www.Upov.Int. |
|
|
Yu K, Park SJ, Poysa V (1999). Abundance and variation of microsatellite DNA Sequences in Beans (Phaseolus vigna). Genome. 42:27–34.
Crossref |
|
|
Yu K, Park SJ, Poysa V, Gepts P (2000). Integration of Simple Sequence Repeat (SSR) Markers into a Molecular Linkage Map of Common Bean (Phaseolus vulgaris L.). J. Hered. 91:429–434.
Crossref |
|
|
Zhang X, Blair MW, Wang S (2008). Genetic diversity of Chinese common bean (Phaseolus vulgaris L.) landraces assessed with simple sequence repeat markers. Theor. Appl. Genet. 117: 629-640.
Crossref |