ABSTRACT
Weeds are the most widespread biotic production constraint of rice in Africa and one of the major factors limiting grain yield. An efficient breeding strategy could be particularly important for improving weed management in sub-Saharan Africa (SSA) because most smallholder rice farmers use few external inputs. To understand rice weed competitiveness, experiments on reciprocal interspecific crosses derived from FKR19 (Oryza sativa) and CG20 (Oryza glaberrima) were carried out to estimate gene effects and heritability of traits: plant height at five leaves, plant height 30 days after transplanting, plant height at maturity, number of tillers at 30 and 60 DAT, number of fertile tillers, width of leaves at 80 DAT and at maturity, and length of leaves at 80 DAT and at maturity for rice–weed competitiveness. Six generations – P1, P2, F1, F2, BC1F1 and BC2F1 – were raised and subjected to generation mean analysis. The lowest heterosis of F1 was obtained in both crosses (CG20/FKR19 and FKR19/CG20), except for plant height at 30 days after transplanting and leaf width at maturity in the CG20/FKR19 cross. The majority of traits displayed higher dominance gene effects (H5_L, H30 and L_80 for CG20/FKR19; W_mat and L_mat for FKR19/CG20) than additive gene effects; the latter were slight and non-significant for the majority of traits. Duplicate epistasis was observed for the number of tillers 30 days after transplanting and leaf length at maturity and plant height at maturity. Additive genetic variance values were higher in CG20/FKR19, revealing that the CG20 variety can be used as a donor parent. Plant height at maturity, length of leaves at 80 DAT and at maturity showed high narrow-sense heritability (hn2>0.70), influencing weed competitiveness.
Key words: Additive, dominance, heritability, rice, variance components, weed competitiveness.
Rice (Oryza sativa L.) is one of the most important crops in the world. It is the fifth most important cereal in Africa in terms of area harvested, and fourth in terms of production (FAO, 2008). In sub-Saharan Africa (SSA), 80% of rice is produced by smallholder farmers (WARDA, 2004, personal communication). Weeds are the most widespread biotic production constraint of rice in Africa and one of the major factors limiting grain yield (Halidou et al., 2006). Screening assessments have revealed a selection of rice varieties that provide a superior level of weed competitiveness in African production systems. These include IG10 (Johnson et al., 1998; Fofana and Rauber, 2000), CG14 (Dingkuhn et al., 1998; Jones et al., 1996) and CG20 (Jones et al., 1996; Sarla and Mallikarjuna, 2005; Moukoumbi et al., 2011). Understanding the dynamics of crop genetic resources facilitates access to the diversity of traits – including weed competitiveness – that can be exploited. An efficient breeding strategy could be particularly important for improving weed management in SSA because most smallholder rice farmers use few external inputs (Rodenburg and Johnson, 2009).
The choice of an effective rice breeding approach to select for a particular characteristic depends substantially on the knowledge of the genetic system controlling these characteristics (Azizi et al., 2006). The value of each parameter depends on a combination of its genotypic effects and environmental effects. Genotypic variance can be divided into genetic additive variance (VA), dominance (VD), interactive additive–dominance (VAD) and environmental (VE) components. Determining these components contributes to a better understanding of the action of genes involved in the expression of the trait (Wolf and Hallauer, 1997). Generation mean analysis (Mather and Jinks, 1971) or scaling tests have been widely used for genetic analysis (Fall, 1994; Kearsey and Pooni, 1996; Möhring and Piepho, 2010). This approach was used in the present research to estimate genetic parameters such as additive gene effects, dominance gene effects and narrow-sense heritability. This leads to an understanding of the inheritance of traits and the nature of the epistatic gene effects (Fall, 1994).
Breeding weed-competitive cultivars requires an easily used protocol for selection under weed regimes. Competitiveness is an interaction between members of the same population for limited quantities of the same essential resource. The weed competitiveness of a crop has two components: weed tolerance, the ability to maintain high yields despite weed competition; and weed-suppressive ability, the ability to reduce weed growth (Jannink et al., 2000). Rice–weed competitiveness is controlled by a mixture of qualitative and quantitative genes (Azizi et al., 2006), but there are few existing studies that assess its genetic effects. However, some previous studies of the genetic effects of wheat–weed competitiveness have shown that it is possible to combine high grain yield with high competitiveness in a single genotype (Gibson and Fischer, 2004). Applying this approach to rice has the potential to generate new knowledge about the nature and magnitude of gene effects and their contribution to the control of rice–weed competitive traits, and to assist in formulating an efficient breeding program. In addition, main rice characteristics were reported to be associated with weed competitiveness include plant height (Caton et al., 2003); higher tiller number (Fisher et al., 2001); droopy leaves (Dingkuhn et al., 1999); high biomass accumulation at the early stage (Ni et al., 2000); high leaf area index and high specific leaf area (Dingkuhn et al., 1999) during vegetative growth stage.
The present research investigated genetic effects and heritability in reciprocal interspecific crosses for weed-competitiveness. It measured ten main quantitative traits: plant height at five leaves (H5_L), plant height 30 days after transplanting (DAT) (H30), plant height at maturity (Hmat), number of tillers at 30 DAT (T30) and 60 DAT (T60), number of fertile tillers (Tfert), width of leaves at 80 DAT (W_80) and at maturity (W_mat), and length of leaves at 80 DAT (L_80) and at maturity (L_mat).
Experiments were conducted for a preliminary germplasm screening (Moukoumbi et al., 2011) and selected CG20 (Oryza glaberrima) as tolerant variety and FKR19 (O. sativa) as susceptible parent. F1 seeds and their parents were planted to generate second filial generations (F2), BC1F1 (CG20/2*FKR19 and FKR19/*2CG20) and BC2F1 (CG20/3*FKR19 and FKR19/*3CG20) backcross generations according to the reciprocal interspecific crosses. The populations BC1F1 and BC2F2 were developped using hand pollination. The experiment was conducted at the Africa Rice Center in Benin (6°25¢N, 2°19¢E and 15 m altitude) during the 2009/2010 wet season. Six generations derived from two crosses were transplanted in a randomized block design in three replications. Each generation was transplanted on 1.5 m long plot with spacing of 0.20 m between and within rows. For the F1, BC1F1 and BC2F1 generations, the number of plants per block varied according to plant material availability: 15 F1, 200 F2, 39 BC1F1 and 38 BC2F1 with CG20 as female and FKR19 as male; 14 F1, 137 F2, 29 BC1F1 and 32 BC2F1 for a reciprocal cross (FKR19/CG20); GC20 and FKR19 plants. Fertilizers were applied at the rate of 200 kg ha-1 of NPK15-15-15 (vegetative stage) and 50 kg ha-1 urea (reproductive stage). Ten quantitative agro-morphological data were collected at the appropriate growth stage, following the Standard Evaluation System for rice (INGER–IRRI, 1996) and descriptors for rice (Oryza spp.) from Biodiversity International–IRRI–AfricaRice (2007).
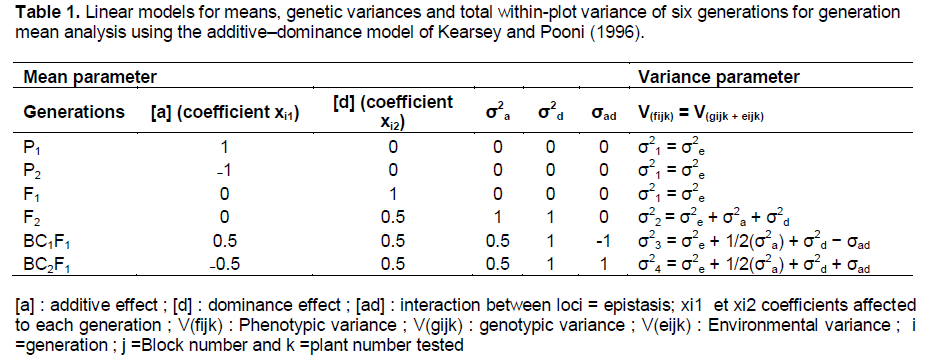
A formula explaining gene effects, first proposed by Mather and Jinks (1971), then by Kearsey and Pooni (1996) and finally by Möhring and Piepho (2010), was used: μ i = m + [a]xi1 + [d]xi2 + [aa]x²i1 + [dd]x²i2 + [ad]xi1xi2, where μ = mean of each generation, m = phenotypic mean of both parents, [a] = additive gene effect, [d] = gene effect of residual dominance, [aa], [dd] and [ad] = epistasic (interaction between loci), and xi1 and xi2 = assigned coefficients for each generation (Table 1). The type of epistasis was determined only when the dominance effect [d] was significant and when these effects had the same sign, the epistasis was complementary while the different sign indicated duplicate epistasis (Dvojkovi? et al., 2010).
Following Möhring and Piepho (2010), an ANOVA mixed model was applied to estimate mean values, standards errors and to test homogeneity of the genetic components of variance (VA, VE, VAD and VE) and genetic effects (additive, dominance and additive × dominance). A lack of fit test was added to check the adequacy of the model for estimating genetic effects. In addition, a Wald f-test, based on the mixed model and equivalent to the joint scaling test proposed by Mather and Jinks (1971), was used to confirm the model.
The variance components were determined following two formulae: VP = VG + VE, where VP = phenotypic variance, VG = genotypic variance, and VE = environmental variance; and: VG = VA + VD + VAD, where VA = additive variance, VD = dominant variance, and V AD = epistasis. VD and VAD values were set to zero when estimated variance turned out to be negative. Broad-sense heritability was estimated using h2b = VG/(VG +VE) and narrow sense heritability using h2n = VA/(VG+VE). All statistical analysis was carried out using SAS 9.1 (2003) software.
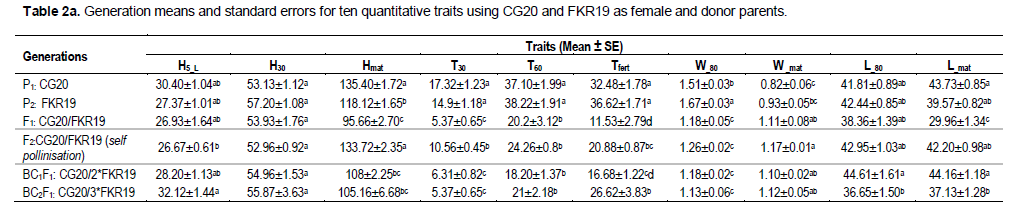
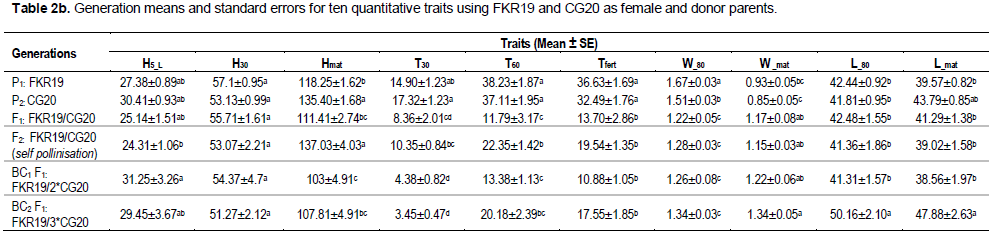
Mean values and their standard errors for the ten traits of the two crosses are presented in Table 2a and b. The parents used in the reciprocal interspecific cross showed significant difference (P ≤0.0001) with all traits except for H30. The mean values of the ten traits for the F1 generation derived from the CG20/FKR19 cross were lower than the mean values for either parent, except for the trait W_mat, where it was higher than the mean value of both parents. The mean values for the traits L_80 and L_mat were the highest when FKR19 was the female parent. Of the F1 generation derived from the FKR19/CG20 cross, the mean value was also generally lower than the mean value for either parent, except for H30 where it was greater than the donor parent, and for the trait W_mat, where it was greater than both parents. The mean values of the second filial generation F2 derived from the CG20/FKR19 cross were better than the parental lines for the traits Hmat, W_mat and L_80. In addition, with the second cross (FKR19/CG20), the values obtained with Hmat (donor parent) and W_mat were higher than their parents.
The differences between generations obtained were analyzed using generation mean analysis following the additive–dominance model, and all tests were found to be significant at 0.05. Dominance gene effects (Table 3) were found to be more important for Hmat, T30, T60, Tfert, W_80, W_mat and L_mat in the CG20/FKR19 cross, and for H5_L, H30, Hmat, T30, T60, Tfert, W_80 and L_80 in the FKR19/CG20 cross. Superdominance and epistatic gene effects were predominant in controlling inheritance with the CG20/FKR19 cross for five traits: Hmat, T30, T60, Tfert and W_80. In addition, the negative values of the dominance gene effect were found for H30, Hmat and L_mat in the reciprocal cross, and for W_80 in the FKR19/CG20 cross. In the CG20/FKR19 cross, additive gene effects were significant and important for H30, Hmat, T30 and L_mat. In the FKR19/CG20 cross, additive gene effects were also significant but moderate for H30, Hmat, W_80, L_80 and L_mat.
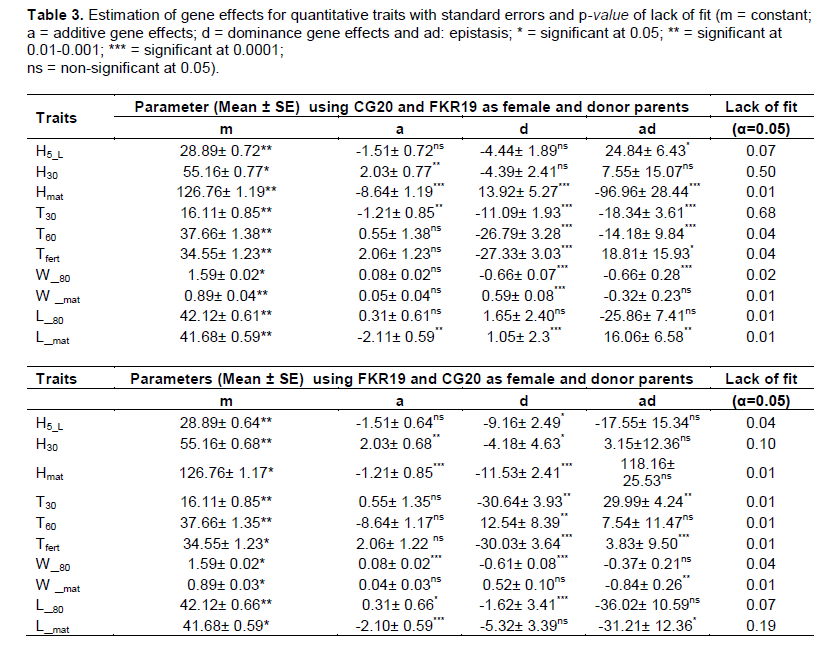
The analysis of the gene effects revealed that additive and dominance effects were involved in the inheritance of most traits. Dominance gene effects were non-significant and negative in the CG20/FKR19 cross for H5-L, H30 and L_80, and in the FKR19/GC20 cross for W_mat and L_mat. The additive–dominance model used cannot explain the variation between generations, which may be the result of the complexity of the mechanisms of genetic control of these traits. The dominance gene effects on Hmat, T30, T60, Tfert and W_80 (CG20/FKR19 and FKR19/CG20), L_mat and W_mat (CG20/FKR19) and H5_L, W_mat and L_mat (FKR19/CG20) were significant. In this case, the variation in generation revealed a digenic epistatic model between generations.
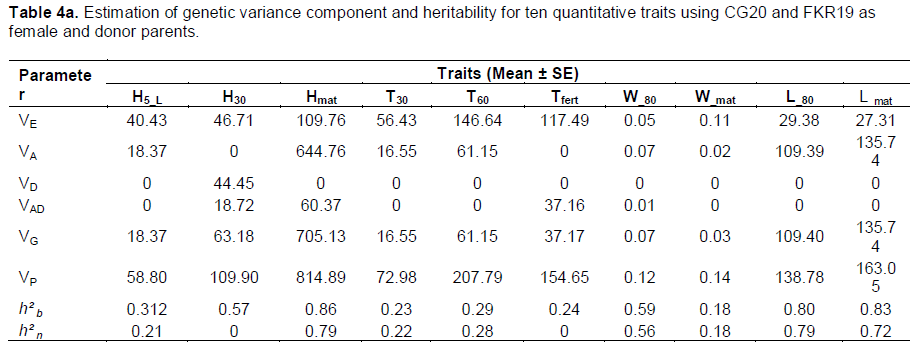
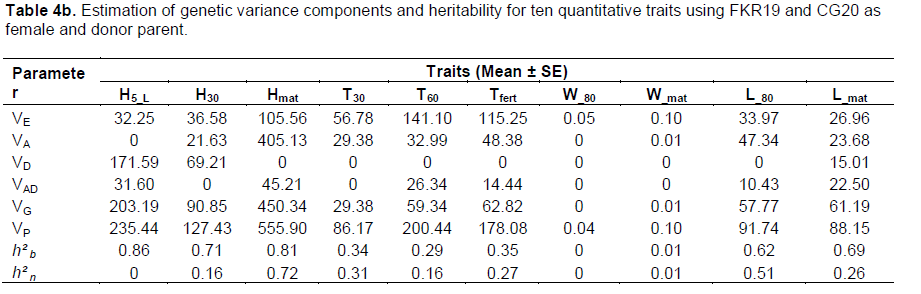
VE component values were higher for all traits analyzed, with the exception of W_80 and L_80 in both crosses. Estimated VA component values were highest for all analyzed traits except for H30 and Tfert in the CG20/FKR19 cross and H5_L and W_80 in the FKR19/GC20 cross. In accordance with the results shown in Table 4a and b, estimated values of broad-sense heritability (h²b) ranged from 0 (W_80) to 0.86 (H5_L) in FKR19/CG20, and from 0.23 (T30) to 0.86 (Hmat) in CG20/FKR19. For narrow-sense heritability (h²n), the highest estimated value was 0.79 (H_mat and L_80) in CG20/FKR19, while the range in FKR19/CG20 was 0.72 (H_mat).
The variations depended on the cross and on the associated trait. Variation in the generation means did not, in most cases, fit a simple epistatic model, as also reported by Dvojkovi? et al. (2010). This indicates that improvement in the traits studied would be more difficult to achieve in comparison with simpler models of inheritance such as additive–dominance and digenic epistatic models, which are considered best from a breeder’s point-of-view. These results are in accordance with the literature, and were validated through genetic analysis of the ten traits following the technique reported by Möhring and Piepho (2010).
The unexpectedly low F1 values obtained could be explained by the regression of heterosis reported by Lefort-Busson (1985), personal communication who mentions that the dispersion of alleles from the parents can occur when a cross is carried out between two genetically opposed parents, such as a rice–weed competitive variety and rice-weed non-competitive variety. On the other hand, the moderate heterosis values obtained suggest the genetic gain in the performance of some traits, but this depends on the cross carried out. In addition, maternal effect might explain some of the disparities between the crosses for T30, T60, Tfert, L_80 and L_mat. For the first and second backcrosses and reciprocal backcrosses, the differences found come from the parent’s contribution during the crosses.
These results indicate that improving these traits would be difficult, as reported by Dvojkovi? et al. (2010) in their genetic analysis for yield and yield traits associated for two winter wheat crosses. The present research showed a preponderance of dominance gene effects over additive gene effects in the expression of the ten traits (7/10 in CG20/FKR19 and 8/10 in FKR19/CG20), as already reported by Akhatar and Muhammad (2006), Fethi and El Mohamed (2010) and Hasib et al. (2002) regarding tillering ability and plant height. Highly significant dominance gene effects could explain the phenomenon of great dominance indicated by Akhatar and Muhammad (2006), resulting from the strong accumulation of dominant genes from parents of all generations, and indicating that the parents were dispersing genes (Dhanda and Sethi, 1996; Fethi and El Mohamed, 2010).
On the other hand, genetic recombination during the crossing process could explain the significant negative dominance gene effects obtained in generations, with the high degree of dispersion of increasing alleles between parents contributing to a slight and non-significant additive gene effect.
In most cases the variation between generation means did not fit a simple epistatic model, but the additive–dominance model was accurate for the main gene effects for Hmat, T30 and L_mat in the CG20/FKR19 cross and for H30, Hmat, W_80 and, L_80 in the FKR19/CG20 cross. Epistatic affects following an additive–dominance interaction were more important with the CG20/FKR19 cross than with the FKR19/CG20 cross. Duplicate epistasis was observed for Hmat, T30 and L_mat and means that the model was adequate for both crosses. However, a better explanation of this duplicate epistasis, offering greater precision on rice–weed competitiveness (Griffiths et al., 2006; Cuguen, 2010), could be obtained by estimating the substitution effects of additive–additive (aa), dominance–additive (da) and dominance–dominance (dd).
VA was high, despite some variations noted in CG20/FKR19, revealing that the variety CG20 can be used as donor parent in a breeding strategy to develop a weed-competitive rice variety. The negative, nil and non-significant estimates obtained with VD could be due to environmental variation, sampling errors and/or the fact that basic generations are inefficient for determining dominance variance (Dvojkovi? et al., 2010). In addition, the inheritance of quantitative traits has been described as a ‘moving target’ (Lewis and John, 1999 cited by Benjdi and El Gazzah, 2010), since it is affected not only by the actions of multiple individual genes, but also by the interactions between genes and environmental factors. The estimates values of narrow-sense heritability were lower than broad-sense heritability and are in accordance with those reported by Robinson et al. (1949) who identified three levels of heritability, low (h2<0.2), moderate (0.2<h2<0.4) and high (h2>0.4). Reported estimates of heritability indicate that these agro-morphological traits influence the weed-competitiveness of the variety. But for traits where estimates of heritability were low to moderate, further analysis of rice–weed competitiveness is needed, ensuring that the breeding population is wide and that selection for rice–weed competitiveness in later generations is exercised under controlled conditions (Saha and Amirul, 2008).
The initial expectations of this research were met and the study provided estimations of additive and dominance gene effects. Additive–dominance interaction effects enabled an explanation of the gene effects involved in the rice–weed competitiveness. The additive components of variance were higher with Hmat, T30 and L_mat. Dominance gene effects were high and significant, and epistasis was more important than additive gene effects, which were slight and non-significant for the majority of traits. The contribution of environmental component variance in governing weed competitiveness cannot be elucidated without estimates of the other substitution effects such as additive–additive (aa), dominance–additive (ad) and dominance–dominance (dd). These could confirm the nature of epistasis and offer new opportunities for genetic improvement of rice–weed competitiveness.
The authors have not declared any conflict of interest.
REFERENCES
|
Akhatar N, Muhammad AC (2006). Genetic analysis of yield and some other quantitative traits in bread wheat. Int. J. Agric. Biol. 4:523-527. |
|
|
|
Azizi F, Rezai AM, Saeidi G (2006). Generation mean analysis to estimate genetic parameters for different traits in two crosses of corn inbred lines at three planting densities. J. Agric. Sci. Technol. 8:153-169. |
|
|
|
Bioversity International–International Rice Research Institute–AfricaRice (2007). Descriptors for Wild and Cultivated Rice (Oryza spp.). Biodiversity International, Rome, P. 63. |
|
|
Caton BP, Cope AE, Mortimer M (2003). Growth traits of diverse rice cultivars under competition: Implications for screening for competitiveness. Field Crops Res. 80:157-172.
Crossref |
|
|
|
Cuguen J (2010). Laboratoire de génétique et évolution des populations végétales. Université de Lille, Lille, P. 149. |
|
|
Dingkuhn M, Jones MP, Johnson DE, Sow A (1998). Growth and yield potential of Oryza sativa and Oryza glaberrima upland rice cultivars and their interspecific progenies. Field Crop Res. 57:57-69.
Crossref |
|
|
Dingkuhn M, Johnson DE, Sow A, Audebert AY (1999). Relationships between upland rice canopy characteristics and weed competitiveness. Field Crops Res. 61:79-95.
Crossref |
|
|
|
Dhanda SS, Sethi GS (1996). Genetics and interrelationships of grain yield and its related traits in bread wheat under irrigated and rainfed conditions. Wheat Inf. Service 83:19-27. |
|
|
|
Dvojković K, Drezner G, Selovi ND, Lali A, Evi JK, Babi D, Bari M (2010). Estimation of some genetic parameters through generation mean analysis in two winter wheat crosses. Periodicum Biol. 112:247-251. |
|
|
|
Fall CA (1994). Optimisation des schémas de sélection pour l'adaptation physiologique à la sécheresse de l'arachide. Mémoire pour confirmation au grade de chargé de recherche génétique et sélection, Centre National de Recherches Agronomiques, Bambey–Sénégal, pp. 100–104. |
|
|
|
FAO (2008). FAO statistical databases. Food and Agriculture Organization of the United Nations, Rome. |
|
|
|
Fethi B, Mohamed EG (2010). Epistasis and genotype-by-environment interaction of grain yield related traits in durum wheat. J. Plant Breed. Crop Sci. 2:24-29. |
|
|
Fofana B, Rauber R (2000). Weed suppression ability of upland rice under low input conditions in West Africa. Weed Res. 40:271-280.
Crossref |
|
|
|
Hasib KM, Ganguli PK, Kole PC (2002). Line x tester analysis for yield and its component in scented rice. Madras Agric. J. 89:221-224. |
|
|
Gibson KD, Fischer AJ (2004). Competitiveness of rice cultivars as a tool for crop-based weed management. In: Inderjit (ed.) Weed Biology Management. Kluwer Academic Publishers, Dordrecht, pp. 517–537.
Crossref |
|
|
|
Griffiths JFA, David TS, Sanlaville C (2006). Introduction à l'analyse génétique (8th edition). De Broeck, Brussels, P. 782. |
|
|
|
Halidou A, Sido AY, Toudou A (2006). Evaluation de lignées de riz pour leur compétitivité vis-à-vis des adventices. In: WARDA (ed.) Proceedings of the Conference 'Beyond the first generation NERICA in Africa – paradigms and partnerships for the next decade', Dar-es-Salaam, pp. 157-161. |
|
|
|
INGER–IRRI (1996). Standard Evaluation System for Rice (Oryza spp) (Fourth edition) International Rice Research Institute, Los Ba-os, p. 52. |
|
|
Jannink JL, Orf JH, Jordan NR, Shaw RG (2000). Index selection for weed suppressive ability in soybean. Crop Sci. 40:1087-1094.
Crossref |
|
|
|
Jones MP, Johnson D, Fofana B, Koupeur T (1996). Selection for weed competitiveness in upland rice. Int. Rice Res. 21:32-33. |
|
|
Johnson DE, Dingkhun M, Jones MP, Mahamane MC (1998). The influence of rice plant type on the effect weed competition on Oryza sativa and Oryza glaberrima. Weed Res. 38:207-216.
Crossref |
|
|
Kearsey MJ, Pooni HS (1996). The Genetical Analysis of Quantitative Traits. Chapman and Hall, London, P. 381.
Crossref |
|
|
Mather K, Jinks JL (1971). Biometrical Genetics. Chapman and Hall, London, pp. 314-315.
Crossref |
|
|
Möhring J, Piepho HP (2010). Generation means analysis using mixed models. Crop Sci. 50:1674-1680.
Crossref |
|
|
|
Moukoumbi YD, Sie M, Vodouhe R, Bonou W, Toulou B, Ahanchede A (2011). Screening of rice varieties for their weed competitiveness. Afr. J. Agric. Res. 24: 5446-5456. |
|
|
Ni H, Moody K, Robles RP, Paller EC Jr, Lales JS (2000). Oryza sativa traits conferring competitive ability against weeds. Weed Sci. 48:200-204.
Crossref |
|
|
Robinson HP, Comstock RE, Harvey PH (1949). Estimates of heritability and the degree of the dominance in corn. Agron. J. 41:353-359.
Crossref |
|
|
Rodenburg J, Johnson DE (2009). Weed management in rice-based cropping systems in Africa. Adv. Agric. 103:150-201.
Crossref |
|
|
|
Saha RPK, Amirul IM (2008). Genetic analysis of salinity tolerance in rice. Bangl. J. Agric. Res. 33:519-529. |
|
|
|
Sarla NB, Mallikarjuna SBP (2005). Oryza glaberrima: A source for the improvement of Oryza sativa. Curr. Sci. 6:955-963. |
|
|
Wolf DP, Hallauer AR (1997). Triple testcross analysis to detect epistasis in maize. Crop Sci. 37:763-770.
Crossref |