Full Length Research Paper

ABSTRACT
White lupin (Lupinus albus L.) is rich in quality protein, relatively tolerant to drought, soil salinity and acidity, increase the fertility of soils and can contribute to improved agricultural sustainability, food security and reduce malnutrition which has close associations with climate change. This study was conducted to assess genetic variability of white lupin genotypes for agronomic traits and nutrient contents of grain, and to estimate association of traits. Twenty-five genotypes of white lupin were evaluated for 29 quantitative traits in 5 x 5 simple lattice designs at Holeta Agricultural Research Center during 2018/2019. The variations of genotypes for yield and grain protein content ranged from 122 to 3206 kg ha-1 and 28.55 and 35.81%, respectively. The genotypes had 2763, 772.3 and 81.59 mg/kg of average phosphorus, calcium and iron contents of grain. The PCV and GCV coefficient of variations varied from 4.39 to 29.54% and 3.41 to 28%, respectively. Heritability in broad sense and genetic advance as percent of mean ranged from 42.07 to 88.94% and 5.34 to 53.98%, respectively. The estimates of GCV, PCV, H2 and GAM were high to moderate. The research results showed the presence of variations among landraces of white lupin in Ethiopia and further evaluation of germplasm could be rewarding to improve the genetic resource in the country.
Key words: Genetic advance, genotypic, phenotypic, heritability, protein and mineral content
INTRODUCTION
White lupin (Lupinus albus L. (2n=50) originated from the North-East Mediterranean and is now distributed throughout the Mediterranean region and from the Azores Islands across North Africa to Ethiopia and Kenya (Vipin et al., 2013). Lupin production is targeted for its grain used as snack, for preparation of local alcoholic drink (Areke), to soil fertility maintenance values in Ethiopia and livestock feed in Australia, Europe and America (Yeheyis et al., 2010); besides, it also has higher protein content 30-40% (Hofmanova et al., 2014). The seed has a higher level of essential amino acids and important dietary minerals (iron and potassium) compared with other legumes such as pea, and faba bean, which are useful as ingredients of functional or healthy food products (Annicchiarico et al., 2014). The crop is produced by smallholder subsistent farmers in Ethiopia by more than 90,000 farmers on 15,500 ha of land and 17,690 tons of grain yields where the crop is mainly tons of grain yields where the crop is mainly produced in the Amhara, Benesangul, SNNPR, Oromiya, and Tigray Regions of Ethiopia (CSA, 2015). However, Amhara Regional States is the largest producer and the production of lupin on 17,877.23 ha in the 2017/18 Meher season was 24629.42 tons with average yields of 1.378 t ha-1. It had a 0.08% share of the total production of pulse crops (CSA, 2018).
In Ethiopia, about 500 white lupin genotypes have been collected and conserved at Ethiopia Biodiversity Conservation Institute (EBI, 1979-2016). In the previous studies on agromoropology conducted, the genotypes of white lupin indicated the presence of genetic diversity (Mulugeta et al., 2015; Hibistu, 2016). However, lack of information about the use of white lupin crop improvement in respect to climate change mitigation crops for goal of smart agriculture aims to reduce food insecurity problem. The information generated from agro-morphological and genetic characteristics of white lupin landraces was required to use the available genetic resource in the country and to give attention for importance of white lupin crops for utilization and essential to the current problem that comes with climate change. It was therefore important to conduct more studies on evaluation and characterization of white lupin landraces for improvement. The objective of this study was to assess the genetic variability of white lupin landraces as potential use of the crop for food security and nutrition, and present a possibility of exploiting its potential to tolerate various stresses aggravated by or resulting from climate change in Ethiopia.
MATERIALS AND METHODS
Germplasm collection
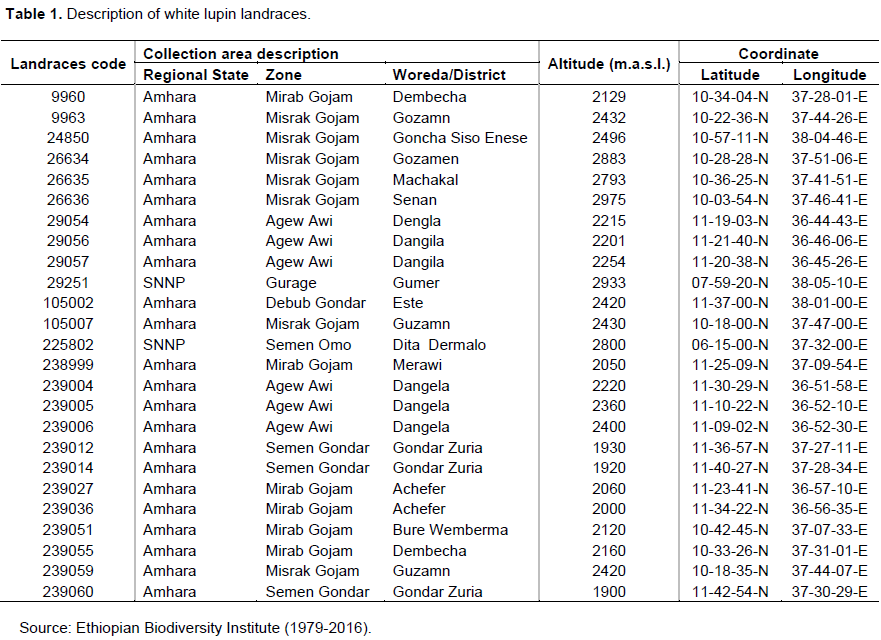
Twenty-five white lupin landraces collected from northwestern and southern parts of Ethiopia by Ethiopian Biodiversity Institute (EBI) were used in this study (Table 1).
Description of the study site
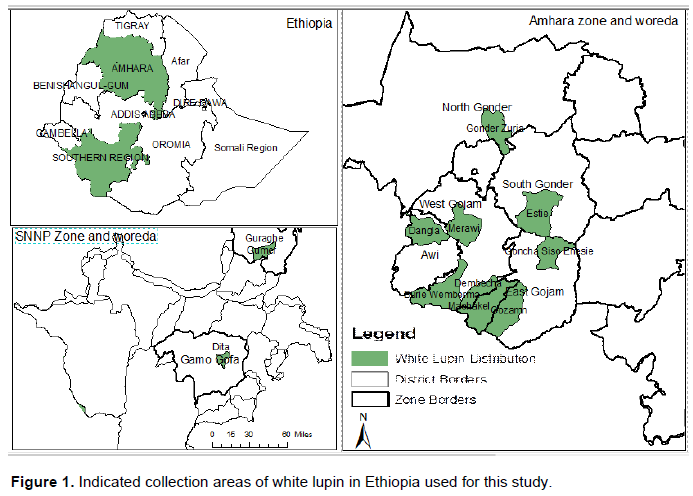
The landraces were evaluated at Holeta (09`N latitude and 38`29E longitude) during 2018/2019. Holeta is located at 2400 m above sea level (Figure 1) and receives 1100 mm of rainfall per annum and a mean relative humidity of 60.6%. Its soil is a predominantly Nitosol which is characterized by average organic matter (AOM) content of 1.8%, Nitrogen 0.17%, Phosphorous 4.55 ppm and Potassium 1.12 Meq/100 g of soil and pH 5.24.
Experimental genetic materials and design
The trial was laid down in a 5 x 5 simple lattice design. Each landraces was planted in one plot in each replication. Each plot consisted of one row and a total of 12 plants per row or per plot. The spacing between rows and plants was maintained at 0.75 and 0.25 m, respectively. The spacing between blocks and replications was 1.5 m.
Data collection
Grain yield was collected per plot and later converted to metric tons per hectare. Days to emergence, days to first flowering, days to 50% flowering, days to maturity and 100-seed weight were also determined on a plot basis. Height of lowest primary branch, plant height, petiole length, inflorescence length, number of branches per plant, stem thickness, leaf length, diameter of leaf, verticil number and number of leaflets per leaf, number of pods per plant, pod length, pod thickness, number of seeds per pod, seed length, seed width and seed weight per plant were recorded on plant basis. Protein and mineral composition of grains were estimated on plot basis. Protein and mineral content were estimated from 0.3 and 0.5 g respectively of grain using Kjeldahl method and Phosphorous was estimated by Magnesium Nitrate dry ashing Molybdenum blue method as the procedure established by Murphy and Riley (1962). Calcium, Potassium and Iron contents of grain were determined by Atomic Absorption Spectrometry.
Data analysis
Analysis of variance and mean comparison
The quantitative data were subjected to analysis of variance (ANOVA) for simple lattice (partially balanced or incomplete block) design (Gomez and Gomez, 1984) and computed with SAS statistical software (9.0) (SAS, 2004). In addition, the relative efficiency of square lattice to randomized complete block design (RCBD) was computed for each trait as:
Relative efficiency of a square lattice (%) 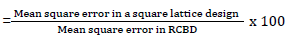
The comparison of the mean performance of genotypes was done following the significance of mean squares using Duncan’s Multiple Range (DMRT) at P<0.05. The traits that exhibited significant mean squares in general ANOVA were further subjected to genetic analyses.
Phenotypic and genotypic variances, heritability and genetic advance
The genotypic variance was estimated according to the method suggested by Burton and de Vane (1953).
i) For trait in which the efficiency of lattice design relative to RCBD was ≥100%
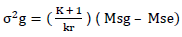
ii) For trait in which the efficiency of lattice design relative to RCBD was <100%

Where; σ2g = genotypic variance, K = Number of plots in a block, r = Number of replications, Msg = genotype/treatment mean square, Mse = error mean square.
The phenotypic and genotypic variance was estimated (Burton and de Vane, 1953) as follows
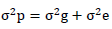
Where,  = phenotypic variance,
  = genotypic variance,
  = Environmental variance.
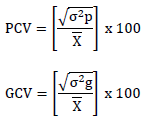
Where;  = Phenotypic coefficient of variation,
  = Genotypic coefficient of variation,
  Population mean of the trait evaluated. Low = 0 - 10%, Moderate = 10 – 20% and High = >20%. as indicated by Sivasubramaniah and Menon (1973).
Broad-sense heritability values were estimated using the formula adopted by Falconer and Mackay (1996) as follows:
H2 = (σ2g/σ2p) x 100
Where; H2 = heritability in a broad sense, σ2p = phenotypic variance, σ2g = Genotypic variance.
As suggested by Robinson et al. (1949), heritability percentage was categorized Low = 0 - 30%, Moderate = 30 – 60%, and High = > 60%.
Genetic advance in the absolute unit (GA) and percent of the mean (GAM), assuming selection of superior 5% of the genotypes were estimated in accordance with the methods illustrated by Johnson et al. (1955) as:
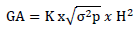
Where;  = Genetic advance, K= selection intensity at 5% (K = 2.063)
  Phenotypic standard deviation,
  Heritability in the broad sense, genetic advance as percent of the mean was estimated as follows:
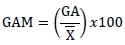
Where;  = Genetic advance as percent of mean, = Genetic advance, Populations mean for trait evaluated. as suggested by Johnson et al. (1955) as follows. Low = 0 - 10%, Moderate = 10 – 20, and High = >20
RESULTS AND DISCUSSION
Analysis of variance and mean performance of genotypes
Phenological parameters
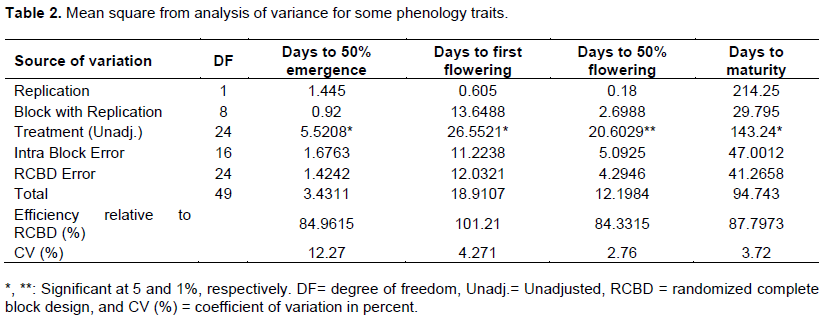
The twenty-five white lupin landraces showed significant differences for days to emergence, days to first flowering, days to maturity and highly significant differences for days to 50% of flowering (Table 2). Georgieva and Kosev (2016) reported significance difference of day to maturity by using 23 genotypes and stated that 10 genotypes fall under early maturity period in the range 92-95. Mulugeta et al. (2015) reported significant differences among 143 white lupin landraces from Ethiopian and one genotype from Germany for days to 50% flowering and days to 75% physiological maturity. Hibstu (2016) evaluated observed significant differences among 110 accessions of white lupin for days to 50% flowering and days to maturity at two locations. Georgieva et al. (2018) observed significance differences among 23 white lupin cultivars for days to flowering and maturity during the period 2014-2016 at the Institute of Forage Crops (Pleven). Obtaining of landraces that fall under the early maturity group might be more important in tackling the problems caused by climate change because early maturing landraces have a chance of escaping the terminal drought. The shortening of the length of growing duration is predicated as one of the future agriculture problems in Ethiopia (Evangelista et al., 2013; Hadgu et al., 2014; Kassie et al., 2014).
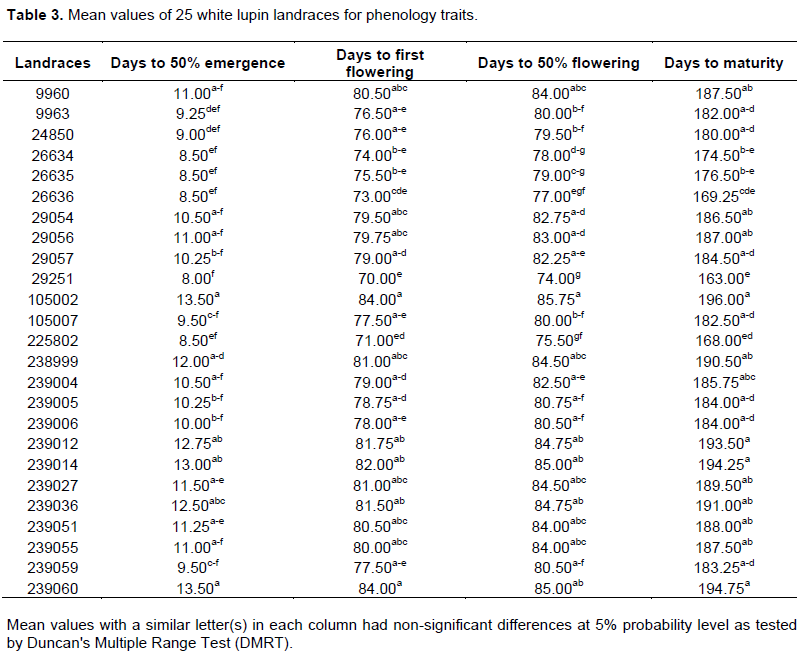
The variation of 25 white lupin landraces for days to 50% emergence was in the range between 8 and 13.5 days after sowing while the variation ranged from 70 to 84, 74 to 85.75 and 163 to 196 days after sowing for first flowering, 50% flowering and maturity, respectively. On average, the landrace took 10.55 days to reach 50% plant emergence, while landrace had an overall mean of 78.45, 81.66 and 184.13 days after sowing to set first flowering, attain 50% flowering and maturity, respectively (Table 3). The early days to 50% emergence, days to first flowering, days to 50% flowering and days to maturity were registered for 29251 while the delayed days to 50% emergence and days to first flowering registered for 239060 and 105002 while the delayed days to 50% flowering and days to maturity registered for 105002. However, this landrace had statistically non-significant differences with most of the other landraces for days to 50% emergence, days to first flowering, days to 50% flowering and days to maturity.
In lupin, germination can take from 5 to 15 days depending on soil temperature, moisture, and depth of sowing. The maximum emergence occurs between 10 and 20°C and for example, at 20°C lupin takes 4 to 4.5 days to emerge from a depth of 4 cm. A lupin plant was the flower for 4 to 8 weeks (Australia, 2011). In Old World lupins, flowering on the main inflorescence (primary flower set) starts 59-136 days from planting depending on species, landrace and the growth conditions (Buirchell and Cowling, 1998). Berger et al. (2017) evaluated wild and domesticated old world lupins and reported 70 days to flowering and 144 days to maturity. Mulugeta et al. (2015) reported 62.95 to 92.64 and 131 to 179 days to 50% flowering and days to 75% physiological maturity, respectively, for 143 white lupin landraces from Ethiopia and one genotype from Germany. Hibstu (2016) observed 57.71 to 86.46 and 149.08 to 215.21 days to 50% flowering and days to maturity, respectively, for 110 white lupin accessions evaluated at two locations in Ethiopia. Georgieva et al. (2018) finding also showed the early cultivars reached technical maturity on average about 129 to 134 days after sowing and the late ones at about 140-148 days after sowing. Dalaram (2017) suggested that the harvesting of white lupin is between 116 and 130 days after sowing. Other recent publications by Temesgen (2019) indicate that day to emergence starts from 6.67 after sowing to 15 days and start first flowering 51 days after sowing to 108 late flowering genotypes. He also reports day to 50% flowerings and day to maturity range from 66 to121.5 and 170.33 to 223.33 respectively in two locations using 36 white lupin genotypes.
Growth traits
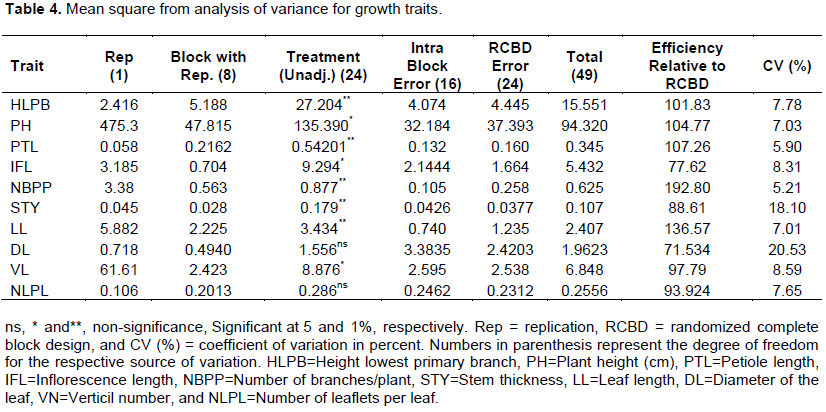
The results from ANOVA showed the presence of significant differences among white lupin landraces for plant height, inflorescence length, verticillated numbers. There was high significance for height lowest primary branch, petiole length, number of branches/plant, stem thickness and leaf length while non-significance for number of leaflets per leaf (Table 4) which implies presence of variability in growth traits for the crop useful for selection. Hibstu (2016) reported significant differences among 110 accessions of white lupin for plant height, inflorescence length, petiole length, number of branches/plant and stem thickness. Mulugeta et al. (2015) also reported significant difference among white lupin genotypes for growth characteristics. González-Andrés et al. (2007) reported significant differences for most of the growth traits of 31 accessions from Spanish Germplasm Collection except for the height of the lowest primary branch’ and the leaflet number.
The mean values of landrace for height lowest primary branch ranged from 32.05 to 21.05 cm whereas it was in the range between 64.75 and 93.2, 5.1 and 7.2 and 0.83 and 2.43 cm for plant height, petiole length and stem thickness, respectively. The entire highest and lowest mean values for all growth traits registered for landrace 105002 and 29251, respectively. However, 8, 14 and 8 landraces for height lowest primary branch, plant height, and petiole length, respectively, had mean values non-significant differences from landraces 105002. Whereas 11 landrace for height lowest primary branch, and 7, 9 and 22 landraces for plant height, petiole length and stem thickness, respectively, had non-significant differences with mean values of 29251 (Table 5). Annual lupin species differ from each other by the shape of the cross-section of their stems and by size (Petrova, 2002). The plant height of various species ranges from 0.2-1.5 m (Australia, 2011). Hibstu (2016) observed 44.81 to 83.1 of plant height in 110 accessions of white lupin evaluated at two locations in 2011. PísaÅ™íková and Zralý (2009) observed plant height in the range between 75 to 100 cm white lupine genotypes.
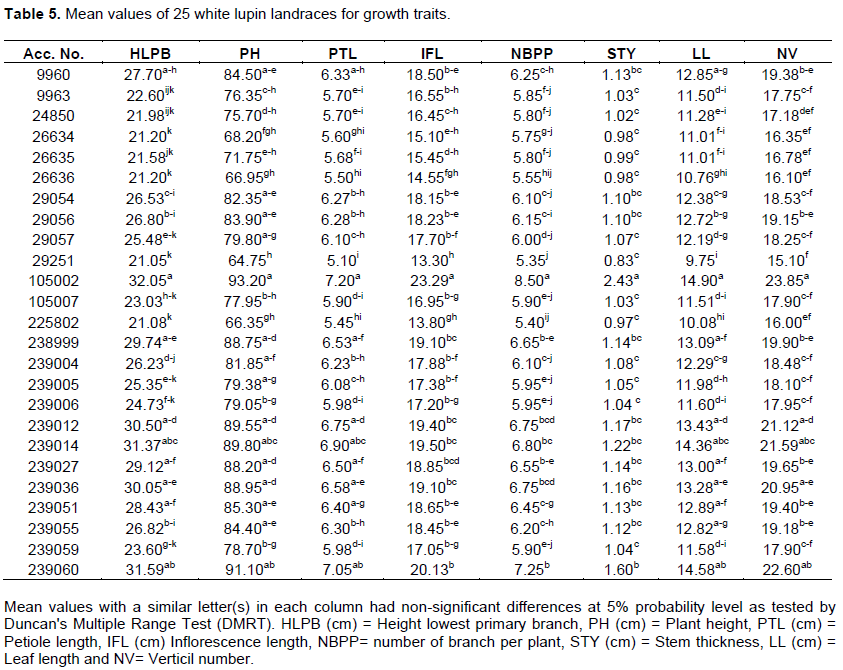
The mean values of landraces ranged from 9.75 to 14.9 cm and 13.3 to 23.29 cm for leaf length and inflorescence length, respectively. The landraces had mean values for a number of branches per plant and verticil number in the range between 5.35 and 8.5 and 15.1 and 23.85, respectively. The highest mean values for leaf length, inflorescence length, number of branches per plant and verticil number were registered for landraces 105002 while all the lowest mean values for the traits were registered for landraces 29251. But 9, 1 and 4 landraces had mean values for leaf length, inflorescence length and verticil number, respectively, non-significant from mean values of 105002, and nine landraces for leaf length, 6, 14 and 13 landraces for inflorescence length, number of branches per plant and verticil number, respectively, had non-significant difference from mean values of 29251 (Table 5). Hibstu (2016) observed minimum and maximum values of 11.31 and 20.84 cm inflorescence length, respectively for 110 white lupin genotypes. Also, Georgieva et al. (2018) reported that there was a wide range of variations for growth traits of 23 white lupin genotypes. Kurlovich (2002) observed that white lupin had a height of 30 to 130. A similar result of 120 cm height of white lupin genotypes was reported by Clark (2014). Similar results were also reported by Arab et al. (2014) white lupin genotypes height at green ripening was recorded in range 63 to 115. Also, Temesgen (2019) reports that plant height at flowering ranges from the shortest genotypes which were 56 in cm to the longest one which is 137.83 cm long.
Yield and yield component
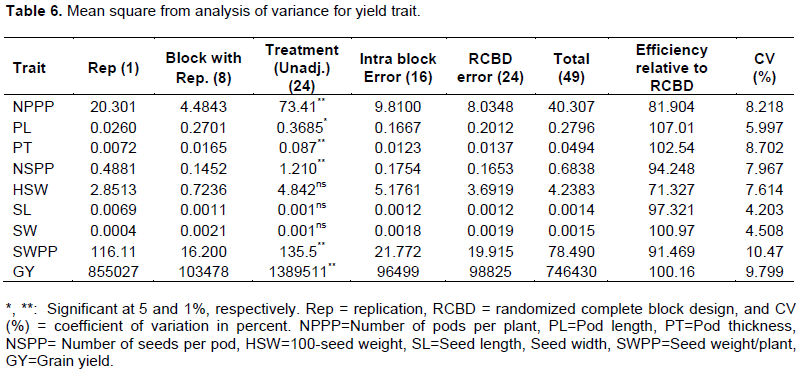
Statistical analysis of the data revealed that pod length was significantly different and seed weight/plant, number of pods per plant, number of seeds per pod and grain yield showed highly significant. However, the landraces exhibited a non-significant difference, 100-seed weight, seed length, and seed width was present as shown in Table 6. Georgieva et al. (2018) reported significant and highly significant differences among white lupin genotypes for yield traits such as seed weight per plant, pod length and pod thickness using 23 white lupin genotypes. Also, Ehab et al. (2016) in seasonal differences observed significant differences for number of seed per pod. Hibstu (2016) also reported by using 110 accessions of white lupin results of yield and yield component showed significant deference for pod length at Haramaya in 2012.
The mean values of landrace for the number of pods per plant ranged from 24.85 to 48.10 whereas it was in the range between 5.91 and 7.61 and 1.14 and 2.25 cm for pod length and pod thickness, respectively. The entire highest and lowest mean values for all pod character traits were registered for landraces 105002 and 29251, respectively. However, 7, 17 and 5 landraces for the number of pod per plant, pod length and pod thickness respectively, had mean values non-significant differences from landrace 105002. Whereas 2 landraces for the number of pod per plant and 7 and 13 landraces for pod length and pod thickness, respectively, had non-significant differences with mean values of 29251 (Table 7). The result indicated that the significant difference between the landrace of white lupin depends on the pod characters' agronomic traits. This was important for the breeder to select good landrace for yield and other breeding purpose. Ehab et al. (2016) reported that the number of pods/plant and number of seeds/pod had an overall average of 22.8 and ranged from 15.2 to 30.5 and 4.4 to 4.3 number of seeds/pod respectively. Number of seed per pods 3 to 6 seeded, pod length 9 to 15 cm and pod thickness 1 to 2 cm wide was reported by Clark 2014) and El Bassam (2010). Also, Hibstu (2016) observed minimum and maximum values of 11.31 and (20.84 cm inflorescence length, respectively, for 110 white lupin accessions. Similar results were also reported by Arab et al. (2014) pod length with minimum 3 and a maximum of 7 was recorded using 36 white lupin genotypes.
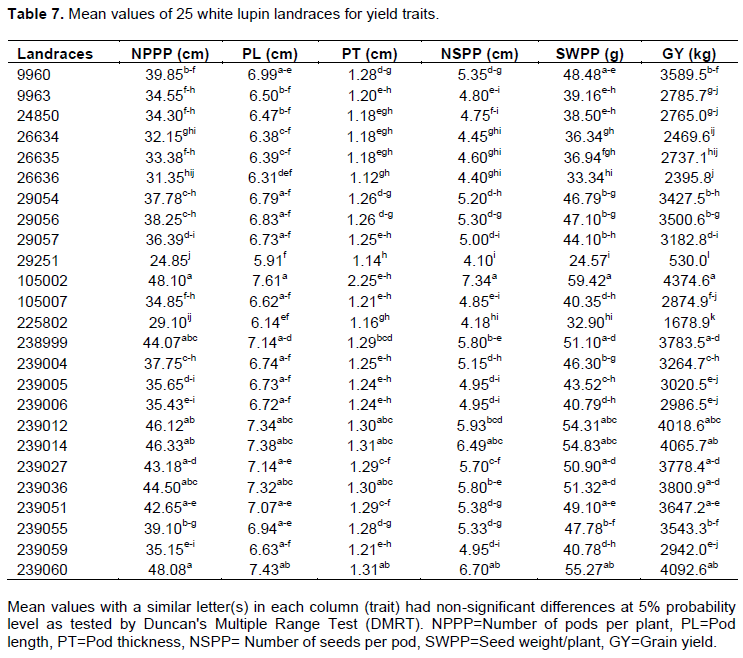
The mean values of landrace ranged from 4.1 to 7.34, 24.57 to 59.42 and 530.0 to 4374.6 for number of seed per pod, seed weight per plant and grain weight, respectively. The highest mean number of seed per pod, seed weight per plant and grain weight was registered for landrace 105002 while all the lowest mean values for the traits were registered for landrace 29251. But 2, 8 and 7 landraces had mean values for number of seed per pod, seed weight per plant and grain weight, respectively, non-significant from mean values of 105002, and 12, 2 landraces for number of seed per pod and seed weight per plant, had non-significant difference from mean values of 29251 (Table 7). Hibstu (2016) observed minimum and maximum values of 11.31 and 20.84 cm inflorescence length, respectively, for 110 white lupin accessions. The landrace that was superior in one of the yield components can be involved in a breeding program like 105002 for the number of pod per plant, pod length, pod thickness, number of seed per plant, seed weight per plant and grain weight respectively. In another study, Ehab et al. (2016) observes that the best seed yield per plant was produced by the Australian genotype 75B9.10 (38.3 g) closely followed by the landrace Fayed1 (38.2 g). Kurlovich (2002) observed pod length and number of seed per pod range from 1-2 to 7-16 cm and 3 to 6. Similar results were also reported by Clark (2014) who noted number of seeds per pod containing 3-7 seeds. Šariková et al. (2011) observed that grain yield ranged from 790 to 3940 kg/ha-1 in 2006–2008 trial seasons. Similarly, Gonzalez-Andre et al. (2007) reports during his findings, the lowest and highest values of mean grain yield per plant, number of pods per plant and number of seeds per pod was 26.6 g to 60.3g per plant, 17.5 to 45.6 pods per plant and 4.9 to 5.7 seeds per pod.
Protein and chemical composition of white lupin
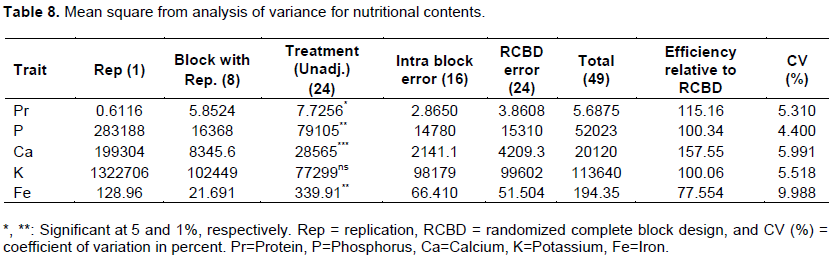
Chemical composition of white lupin grain indicated that significant difference exist for protein, phosphorus, iron and very high significance for calcium contents of grain in Table 8. Yorgancilar and Bilgiçli (2014) and Sujak et al. (2006) reported significant differences among white lupin genotypes for protein content of grain. Tizazu and Emire (2010) evaluated grains from the market in northwestern Ethiopia and observed significant differences for protein and mineral contents among the sample grains.
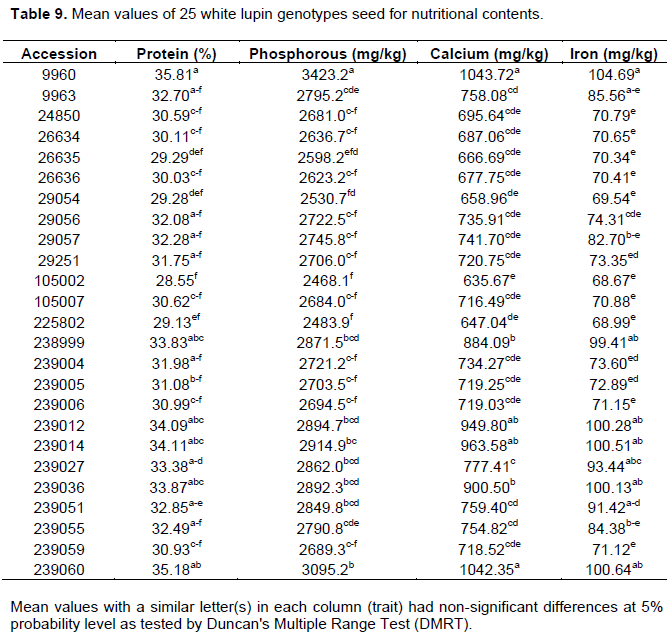
The mean values of landrace for protein% ranged from 28.55 to 35.81 (mg/kg) whereas it was in the range between 2468.1 and 3423.2, 635.67 and 1043.72, 68.67 and 104.69 (mg/kg) for phosphorous, calcium and iron, respectively in Table 9. The entire highest and lowest mean values for all chemical composition traits registered for landraces 9960 and 105002, respectively. However, 13, 3 and 8 landraces for protein, phosphorous, calcium and iron respectively, had mean values of non-significant differences from landraces 9960; whereas 10 landraces for protein, and 14, 14 and 15 landraces for Phosphorous, Calcium and Iron, respectively, had non-significant differences with mean values of 105002 (Table 9). Martinez-Villaluenga et al. (2006), and Straková et al. (2006) observed the protein content of white lupin range from 32.9% to more than 36% (Sujak et al., 2006). The variation attributed in the protein content between species and cultivars as a result of the characteristics depended on growing conditions and soil types (Martínez-Villaluenga et al., 2006) which varies from 28 to 48% (Capraroa et al., 2008). The variation of white lupin protein content was important for crop improvement through the selection to alleviate the protein malnutrition problem due to climate change in Ethiopia.
Tizazu and Emire (2010) observed significant variations among white lupin landraces for phosphorus and calcium contents in the range between 979.8 and 2487.7 μg/g and 671.3 and 2490.2 μg/g, respectively using genotype of lupin (L. albus) seeds which were collected from the local markets of Dembecha and Debretabor in Amhara region (Northern part of Ethiopia). However, from both locations (Dembecha and Debretabor), they observed 2489, 125.1 and 825.6 μg/g, phosphorus, iron and calcium contents respectively. Paulos (2009) also reported 60.0 and 67.2 μg/g contents of Iron for Dangla and Tilili white lupin genotypes respectively. Zelalem and Chandravanshi (2014) reported significant differences among white lupin genotype for calcium and iron in the range of 502 to 967 and 78 to 93 μg/g, respectively.
The mean value for phosphorus was higher than the other elements followed by calcium and iron was the least. The higher phosphorus in the white lupin landrace was probably due to the fact that phosphorus elements were highly mobile in the plant tissue and trans-located from old plant tissue to new plant tissue according to (Ishibashi et al., 2004). Highly fertilized soil with manure and organic residues for cultivating the white lupin has higher availability of Ca composition (Khetarpaul et al., 2004). The high concentration of Fe in white lupin may be due to the fact that these ions are readily transferred from the soil to plants, and accumulate in plants (Soetan et al., 2010; Saadia and Nabila, 2013). This indicated that white lupin genotype cultivation was possible on unfertile soil which prevents environmental pollution by fertilizer. Lupin generally contains about twice the protein found in those legumes normally consumed by humans; not only protein but also Ca level content of white lupin genotype was higher than many other crop foodstuffs including wheat, maize, and soybean as reported by Tizazu and Emire (2010). White lupin is mainly consumed and grown in different parts of Ethiopia with different agronomic and climate conditions. The wide variation in white lupin grain protein and mineral composition was important during selection for improvement in breeding of these crops within good grain composition to alleviate food insecurity due to climate change effects such as drought. The mineral composition of the white lupin genotype was aimed at mitigating the micronutrient malnutrition of the developing regions of the world as it compares with that of other dry beans (Tizazu and Emire, 2010).
Estimates of variability components
Phenotypic and genotypic variances
Estimates of phenotypic (σ2p) and genotypic (σ2g) variances, and phenotypic coefficients of variation (PCV) and genotypic coefficients of variation (GCV) are presented in Table 10. The genotypic and phenotypic coefficients of variation ranged between 4.39 to 29.54%, and 3.41 to 28% respectively, for 22 traits of 25 white lupin genotypes.
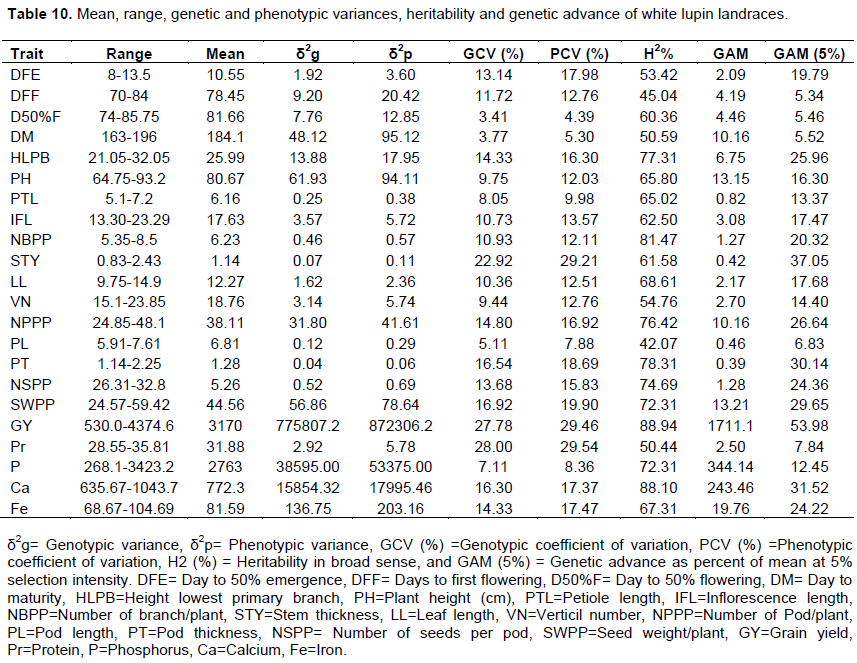
According to Sivasubramaniah and Madhavamenon (1973), the estimate of PCV and GCV can be categorized as low (<10%), moderate (10-20%) and high (> 20%). The GCV and PCV were estimated <10% for days to 50% flowering, days to maturity, petiole length, pod length and phosphorous content of the grains. This indicated the lesser phenotypic variability among white lupin genotype for these traits that might be due to the environmental influence of environmental factors, but improvement of these traits by selection is not possible as the heritable variation among genotypes is not enough. In support of this study results, Georgieva and Kosev (2016) observed low GCV and PCV was estimated for pod length in two white lupin genotypes Garant and Chernilovec. Also, low GCV was estimated for pod length for white lupin genotype as reported by Hibstu (2016), and Georgieva and Kosev (2018). The GCV and PCV were estimated as moderate (10-20%) inflorescence length.
The estimates of genotypic and phenotypic coefficients of variations were high (> 20%) for stem thickness and grain yield. This suggested that the traits were less influenced by environmental factors and selection based on phenotypic expression of the genotypes could be applied as a breeding method to identify genotypes for higher mean values. High phenotypic and genotypic coefficients of variation is an indication of the less influence of environmental factors in the expression of traits and the higher chance to improve the traits through selection inbreeding (Swati et al., 2014; Bharathiveeraman et al., 2012; Nwangburuka et al., 2012; Saleh et al., 2010). A similar finding by Annicchiarico et al. (2010) and Mera et al. (2006) reported high GCV and PCV for stem thickness and grain yield in white lupin genotypes. Also, Georgieva and Kosev (2016) observed high GCV for grain yield Chernilovec white lupin genotype.
Moderate GCV and PCV was estimated for days to 50% emergence, days to first flowering, days to maturity, height of lower branch, inflorescence length, number of branch per plant, leaf length, numbers of pod per plant, pod thickness, seed number per pod, seed weight per plant, calcium and iron content traits. Similarly, Dutta et al. (2013) and Jain et al. (2013) reported moderate GCV and PCV for inflorescence length. Similar result by Temesgen (2019) showed low genetic advance as percent of means for number of primary branches and pod length. Generally, the phenotypic variance exceeded the genotypic variance though little difference indicated small environmental influence contribution on the performance of the traits in addition to genotypic variance. This further indicates that the contribution of environmental variance was less than that of genotypic variance to selection for improvement of white lupin crops.
Estimates of heritability and genetic advance
Estimates of heritability in a broad sense (H2) and genetic advance as percent of the mean (GAM) for 22 quantitative traits of 25 white lupin genotypes are presented in Table 10. The heritability values ranged from 42.07% (pod length) to 88.94% (grain yield) while GAM was in the range between 5.34 (days to first flowering) and 53.98% (grain yield). As suggested by Johnson et al. (1955), heritability values are categorized as low (<30%), moderate (30-60%) and high (>60%) and GAM was classified as low (<10%), moderate (10-20%) and high (>20%).
High H2 and GAM estimates for height of lower branch, number of branch per plant, stem thickness, number of pod per plant, pod thickness, number of seed per plant, seed weight per plant, grain yield, and calcium and iron contents of grain. High heritability coupled with high genetic advance as percent of mean indicates function of additive gene action which is important for direct selection based on these traits to that diverse material which could be effective for desired improvement. In the light of this, Tesfaye et al. (2014) reviewed that high H2 couple with high GAM would give better information about genotypes than the individual parameter for selection. The recent study is in agreement with Temesgen (2019) who reported higher values of the coefficient of heritability and genetic advance as percent of means for number of primary branches per plant, pod thickness, number of pod per plant, seed number per pod, seed yield per plant in gram, and seed yield per hectare. Also, Georgieva and Kosev (2016) observed in both varieties Garant and Chernilovec an established high coefficient of heritability (H2) in the traits number of seeds per plant and higher values of the coefficient of heritability for number of pod per plant in Chernilovec, while the inheritance had a very low coefficient in Garant. Similarly, Hibstu (2016) reported higher genetic advance as percent of means for number of pods per plant and grain yield. Also, Mera et al. (2006) reported high broad sense heritability for pod wall proportion. Mohammadi and Pourdad (2009) and Hefny (2013) have reported high values of heritability, which are similar to those in the present study for grain yield per plant.
The moderate H2 with low GAM were estimated for day to first flowering, day to maturity and protein content while the moderate H2 and GAM were estimated for day to 50% emergency and vertical numbers. These show the influence of environmental effect on the expressions of the trait than that of genetic effect; so, selection based on this trait was not rewarded for improvement. Also, high heritability estimates was accompanied with moderate genetic advance as percent of the mean (10-20%) for plant height, petiole length, inflorescence length, leaf length and phosphorus contents. Selection of genotypes based on mean performances may be effective to improve traits that had high heritability estimates coupled with moderate or high genetic advance as percent of mean (Sivasubramanian and Madhavamenon, 1973).
CONCLUSION
The research results showed the presence of significant differences among white lupin landraces for agronomic traits, protein and mineral contents of grains. The landraces were collected mainly from northwestern Ethiopia and few from southern Ethiopia indicated the existence of variations for different agronomic traits and nutrient contents of grain in germplasm of white lupin. The variation of genotypes for yield ranged from 122 to 3206 kg with a mean grain yield of 1938.13 kg ha-1. The genotypes grain protein content was in the range between 28.55 and 35.81% with an average of 31.88%, and the grain of genotypes had phosphorus, calcium and iron contents of 268.1 to 3423.2, 635.67 to 1043.72 and 68.67 to 104.69 mg/kg, respectively. The phenotypic (PCV) and genotypic (GCV) coefficient of variations varied from 4.39 to 29.54% and 3.41 to 28%, respectively. Heritability in a broad sense (H2) and genetic advance as percent of the mean (GAM) ranged from 42.07 to 88.94% and 5.34 to 53.98%, respectively. The estimates of GCV, PCV, H2 and GAM were moderate to high for numbers of pod per plant, seed weight per plant, pod length, pod thickness, inflorescence length and verticil number, days to first flowering and number of branches per plant, plant height and stem thickness, numbers of seed per plant pod length and pod thickness. The observed variations among landraces suggested the higher chance of identifying genotypes for desirable traits either to be used as a variety after consecutive evaluation or used in crossing program for genetic recombination and selection of potential progenies in the subsequent generation. The improvement of white lupin for agronomic and nutrient contents of grain can contribute to adapting to climate variability and change in Ethiopia.
CONFLICT OF INTERESTS
The author has not declared any conflict of interests.
REFERENCES
|
Annicchiarico P, Harzic N, Carroni AM (2010). Adaptation, diversity and exploitation of global white lupin (Lupinus albus L.) landrace genetic resources. Field Crops Research 119:114-124. Crossref |
||||
|
Annicchiarico P, Manunza P, Arnoldi A, Boschin G (2014). Quality of Lupinus albus L. (white lupin) seed: extent of genotypic and environmental effects. Journal of Agricultural and Food Chemistry 62:6539-6545. Crossref |
||||
|
Arab SA, El Nahas MM, Khalaf RM, Hussin ME (2014). Morphological and Cytological Characterization of Some White Lupin Landraces Collected from Egypt. Egyptian Journal of Agronomy 36(2):219-234. Crossref |
||||
| Australia P (2011). Lupin growth and development. Lupin growth and development. Provide link | ||||
|
Berger JD, Shrestha D, Ludwig C (2017). Reproductive strategies in Mediterranean legumes: Trade-offs between Phenology, seed size and vigor within and between wild and domesticated Lupinus species collected along aridity gradients. Frontiers in Plant Science 8:548. Crossref |
||||
| Bharathiveeramani B, Prakash M, Prakash SA (2012). Variability studies of quantitative characters in Maize (Zea mays (L.). Electronic Journal of Plant Breeding 3(4):995-997. | ||||
| Buirchell BJ, Cowling WA (1998). Genetic resources in lupins. pp. 41-66. In: Gladstones JS, Atkins C, Hamblin J, (Eds.). Lupins as Crop Plants: Biology, Production and Utilization. CABI, Wallingford, UK. | ||||
|
Burton GW, De Vane EH (1953). Estimating heritability in tall fescue (Fistveaarundiancea) from the replicated clonal material. Agriculture Journal 45:284-291. Crossref |
||||
|
Capraro J, Magni CH, Fontanesi M, Budelli A, Duranti M (2008). Application of two-dimensional electrophoresis to industrial process analysis of proteins in lupin-based pasta. LWT-Food Science and Technology 41:1011-1017. Crossref |
||||
| Clark S (2014). Plant guide for white lupine (Lupinus albus L.). USDA-NRCS, Big Flats Plant Materials Center, Corning, New York. | ||||
| CSA (Central Statistical Agency) (2015). Agricultural sample survey 2014/2015 area and production of crops. Statistical Bulletin I (578). | ||||
| CSA (Central Statistical Agency) (2018). Agricultural Sample Survey 2017/2018, Volume II: Crop and Livestock Product Utilization. Central Statistical Agency, Federal Democratic Republic of Ethiopia. | ||||
|
Dalaram IS (2017). Evaluation of total polyphenol content and antioxidant capacity of different verity lupin seeds. Potravinarstvo 11:1. Crossref |
||||
| Dutta P, Dutta PN, Borua PK (2013). Morphological Traits as Selection Indices in Rice: A Statistical View. Universal Journal of Agricultural Research 1 (3):85-96. | ||||
| EBI (Ethiopian Biodiversity Institute) (1979-2016). Documentation. | ||||
|
Ehab EH, Ashrie A, Ammar M, Alghamdi S (2016). Genetic variation among Egyptian white lupin (Lupinus albus L.) genotypes. Turkish Journal of Field Crops 21(1):148-155. Crossref |
||||
|
El Bassam N (2010). Handbook of bioenergy crops: A complete reference to species, development and applications. Earthscan, London, UK. Crossref |
||||
|
Evangelista P, Nicholas Y, Jonathan B (2013). How will climate change spatially affect agriculture production in Ethiopia? Case studies of important cereal crops. Climate Change 119: 855-873. Crossref |
||||
| Falconer DS, Mackay TFC (1996). An Introduction to quantitative genetics. ed, 4.Printice Hall London. P. 464. | ||||
|
Georgieva NA, Kosev VI (2016). Analysis of Character Association of Quantitative Traits in Lupinus Species. Journal of Agricultural Science 8(7):23. Crossref |
||||
| Georgieva N, Kosev V (2018). Possibilities for identification of the genotype by phenotype in lupine albusl. white lupine cultivars. Pakistan Journal of Botany 50(3):977-981 | ||||
| Georgieva NA, Kosev VI, Genov NG (2018). Morphological and biological characteristics of white lupine cultivars (Lupinus albus L.). Romanian Agricultural Research 35:109-119. | ||||
| Gomez KA, Gomez AA (1984). Statistical procedures for agricultural research. John Wiley & Sons. | ||||
|
Gonzalez-Andres F, Casquero PA, San-Pedro C, Hernández-Sánchez E (2007). Diversity in white lupin (Lupinus albus L.) landraces from Northwest Iberian plateau. Genetic Resources and Crop Evolution 54:27-44. Crossref |
||||
|
Hadgu G, Kindie T, Girma M, Belay K (2014). Analysis of climate change in Northern Ethiopia: implications for agricultural production. Theoretical and Applied Climatology 121:3-4. Crossref |
||||
| Hefny MM (2013). Use of genetic variability estimates and interrelationships of agronomic: biochemical characters for selection of lupin genotypes under different irrigation regimes. African Crop Science Journal 21(1):97-108. | ||||
| Hibstu AD (2016). Genetic diversity and association of traits in white lupin (Lupinus albus L.) accessions of Ethiopia. Doctoral dissertation, Haramaya University. | ||||
| Hofmanová T, Švec I, Hrušková M (2014). Nutritional properties of non-traditional seeds. Journal of Life Medicine 2(1):10-14. | ||||
|
Ishibashi Y, Matsuo H, Baba Y, Nagafuchi Y, Imato T and T Hirata (2004). Association of manganese effluent with the application of fertilizer and manure on tea field. Water Resource 38:2821-2826. Crossref |
||||
| Jain A, Singh B, Solanki R, Saxena S, Kakani R (2013). Genetic variability and character association in fenugreek (Trigonella foenum-graecum L.). International Journal Seed Spices 2:22-28. | ||||
|
Johnson HW, Robinson HF, Comstock RW (1955). Estimates of Genetic and Environment variability in Soybean. Agronomy Journal 47:314-318. Crossref |
||||
|
Kassie BT, Rotter RP, Hengsdijk H, Asseng S, Vanittersum MK, Kahiluoto H, Vankeulen H (2014). Climate variability and change in the central Rift Valley of Ethiopia. Journal of Agricultural Sciences 152:58-74. Crossref |
||||
|
Khetarpaul N, Garg R, Goyal R (2004). Improvement in cooking quality of soybean by presoaking treatment with enzyme (lipase) solution. Nutrition and Food Science 34:8-12. Crossref |
||||
| Kurlovich BS (2002). Editor. Lupins: geography, classification, genetic resources and breeding. | ||||
|
Martínez-Villaluenga C, Frías J, Vidal-Valverde C (2006). Functional lupin seeds (Lupinus albus L. and Lupinus luteus L.) after extraction of α-galactosides. Food Chemistry 98:291-299. Crossref |
||||
|
Mera M, Beltran L, Miranda H, Rouanet JL (2006). Strong Heritabiltiy across years and sites for pod wall proportion and specific weight in Lupinus albus and genotypic correlation with other pod and seed attributes. Plant Breeding 125:161-166. Crossref |
||||
|
Mohammadi R, Pourdad SS (2009). Estimation, interrelationships and repeatability of genetic variability parameters in spring safflower using multi-environment trial data. Euphytica 165:313-324. Crossref |
||||
|
Mulugeta A, Kassahun T, Kifle D, Dagne W (2015). Extent and pattern of genetic diversity in Ethiopian white lupin landraces for agronomical and phenological traits. African Crop Science Journal 23(4):327-341. Crossref |
||||
|
Murphy J, Riley JP (1962). A modified single solution method for the determination of phosphate in natural waters. Analytica Chimica Acta 27:31-36. Crossref |
||||
|
Nwangburuka CC, Denton OA, Kehinde OB, Ojo DK, Popoola AR (2012). Genetic variability and heritability in cultivated okra [Abelmoschus esculentus (L.) Moench]. Spanish Journal of Agriculture Research 10(1):123-129. Crossref |
||||
| Paulos G (2009). Chemical composition and the effects of traditional processing on nutritional composition of Gibto (Lupinus albus L.) grown in Gojam area. M.Sc. Thesis, Addis Ababa University, Addis Ababa, Ethiopia. | ||||
| Petrova MV (2002). Anatomic structure. Lupins: Geography, Classification, Genetic Resources and Breeding.183-203. | ||||
|
PísaÅ™íková B, Zralý Z (2009). Nutritional value of lupine in the diets for pigs (a review). Acta Veterinaria Brno 78(3):399-409. Crossref |
||||
|
Robinson HF, Comstock RE and Harvey PH (1949). Estimates of heritability and the degree of dominance in corn. Agronomy Journal 41(8):353-359. Crossref |
||||
|
Saadia RT, Nabila R (2013). Multivariate analysis of metal levels in paddy soil, rice plants, and rice grains: A case study from Shakargarh, Pakistan. Journal of Chemistry Volume 2013, Article ID 539251, pp. 1-10. Crossref |
||||
|
Saleh TA, Gondal MA, Drmosh QA (2010). Preparation of a MWCNT/ZnO nanocomposite and its photocatalytic activity for the removal of cyanide from water using a laser. Nanotechnology 21(49):495705. Crossref |
||||
|
Šariková D, Hnát A, Fecák P (2011). Yield Formation of White Lupin Lupinus albus L. on Heavy Gleyey Alluvial Soil. Agriculture 57(2):53-60. Crossref |
||||
| AS Institute (2004). SAS/ETS 9.1 User's Guide. SAS Institute. | ||||
| Sivasubramaniah S, Meron M (1973). Heterosis and inbreeding depression in rice. Madras Agriculture Journal 60:1139-1144. | ||||
| Soetan KO, Olaiya CO, Oyewole OE (2010). The importance of mineral elements for humans, domestic animals and plants: A review. African Journal of Food Science 4:200-222. | ||||
|
Straková E, Suchý P, VeÄerek V, Šerman V, Mas N, Jůzl M (2006). Nutritional composition of seeds of the genus Lupinus. Journal of the University of Veterinary and Pharmaceutical Sciences in Brno. 75(4):489-493. Crossref |
||||
|
Sujak A, Kotlarz A, Strobel W (2006). Compositional and nutritional evaluation of several lupin seeds. Food Chemistry 98(4):711-719. Crossref |
||||
| Swati B, Reena N, Meenakshi R, Jain PK (2014). Genetic variability in okra [Abelmoschus esculentus (L.) Moench]. An International Quarterly Journal of Environmental Sciences 6:153-156. | ||||
| Temesgen BG (2019). Genetic Variability, Heritability and Genetic Advance for Some Yield and Yield Related Traits among 36 Ethiopian White Lupine (Lupinus albus L.) Genotypes. Food Science and Quality Management 86:7-18. | ||||
|
Tizazu H, Emire S (2010). Chemical composition, physicochemical and functional properties of lupin (Lupinus albus) seeds grown in Ethiopia. African Journal of Food, Agriculture, Nutrition and Development. 10:3029-3046. Crossref |
||||
|
Vipin CA, Luckett JD, Harper I, Ash GJ, Kilian A, Ellwood SR, Phan HTT, Raman H (2013). Construction of linkage map of a recombinant inbred line population of white lupin (Lupinus albus L.). Breeding Science 63:292-300. Crossref |
||||
| Yeheyis L, Kijora C, Melaku S, Girma A, Peters KJ (2010). White lupin (Lupinus albus L.), the neglected multipurpose crop: Its production and utilization in the mixed crop-livestock farming system of Ethiopia. Livestock Research for Rural Development 22(4):74. | ||||
|
Yorgancilar M, Bilgiçli N (2014). Chemical and nutritional changes in bitter and sweet lupin seeds (Lupinus albus L.) during bulgur production. Journal of Food Science and Technology 51(7):1384-1389. Crossref |
||||
| Zelalem KA, Chandravanshi BS (2014). Levels of essential and non-essential elements in raw and processed lupinus albus l. (white lupin, gibto) cultivated in Ethiopia. African Journal of Food, Agriculture, Nutrition and Development 14(5). | ||||
Copyright © 2024 Author(s) retain the copyright of this article.
This article is published under the terms of the Creative Commons Attribution License 4.0


