Full Length Research Paper

ABSTRACT
Environments explained 49.4%, G×E interaction 28.1%, and genotypes only 5.6% of the total sum of squares due to treatments for the first year of studied period 2018-2019 and 2019-2020. More than 95% of variations had been accounted for by the first seven interaction principal components. Superiority indexes had identified WH1239, DBW187, HD3249 genotypes as per the BLUE estimates. Same genotypes were highlighted by superiority and other measures based on BLUP of genotypes. Adaptability measures as per BLUEs expressed deviation from other measures and maintained the right angle with MASV1 and stability measures in Biplot analysis. Superiority indexes were clustered in the same quadrant. Similar clustering patterns had been displayed by measures based on BLUPs. Wheat genotypes HD3249, K1006 selected by superiority indexes and adaptability measures for the second year. Biplot analysis utilized 80% variability accounted by two PCs. Adaptability measures were placed in a different quadrant. However, measures maintained nearly the right angle with other stability measures with exception of superiority indexes. A similar pattern of clustering had been observed for adaptability as well as superiority indexes as per BLUP of genotypes.
Key words: AMMI model, MASV, WAASB, SI, SSI, Biplot analysis.
INTRODUCTION
A large number of statistical analytics has been developed to estimate G×E interactions under multi location trials (Agahi et al., 2020). Widely utilized AMMI analysis considered the fixed-effect of genotypes under linear model (Mohammadi et al., 2015). Recently, it may be reasonable to consider genotypes, environments, or both to be random effects in a mixed model approach (Piepho et al., 2008; Mendes et al., 2012). BLUP proved the potential to improve the predictive accuracy of random effects (Ajay et al., 2020). BLUP and AMMI, two distinct approaches, utilized to distinguish the pattern from the random error components in G×E interactions. AMMI analysis retained most of the G×E pattern in the first interaction principal component axis (IPCA), while most of the random error had been explained by the last IPCAs (Gauch, 2013). BLUP, on the other hand, first estimated the effects of the ANOVA model and then attributes weights to these effects and could thus be considered a shrinkage estimator (Piepho, 1994). Frequently, these two models have been used separately in the field evaluation of genotypes under multi location trials (Sa’diyah and Hadi, 2016; Ashwini et al., 2021). Taking into account the importance of AMMI and BLUP, the benefits of these two important techniques were incorporated into a measure superiority index for stability and adaptability of genotypes (Olivoto et al., 2019). Further, the behavior of stability and adaptability measures had been compared as per BLUP and BLUE of wheat genotypes evaluated under multi-location trials under irrigated timely sown trials in the North Eastern Plains Zone of the country.
MATERIALS AND METHODS
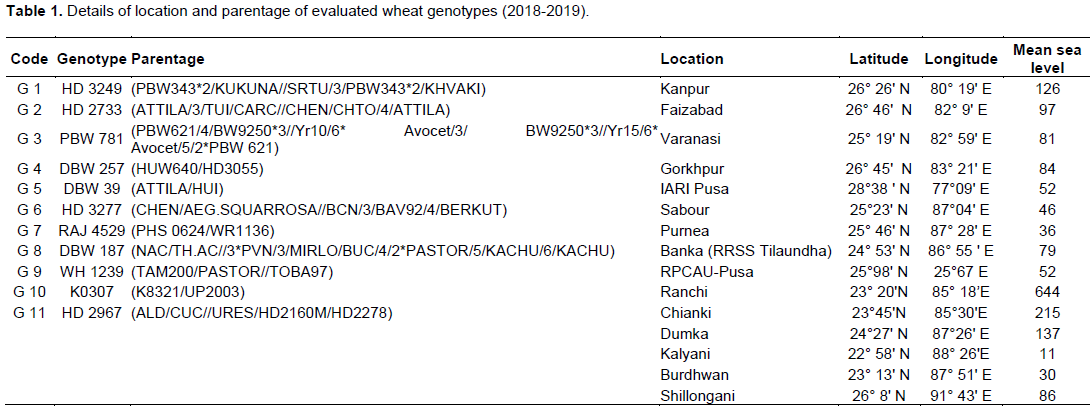
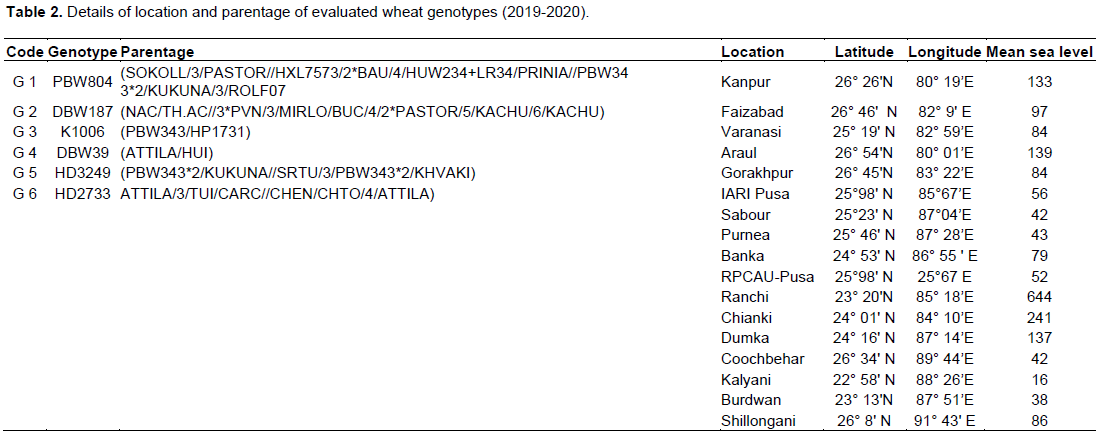
The zone has immense potential to increase the wheat production of the country as highly productive states Bihar, eastern Uttar Pradesh, Jharkhand, Assam and plains of West Bengal comprise the North Eastern Plains Zone of the India. Still scope to increase the cereal production of the country has untapped and additional production to the potential of crops to ensure food security of the country. Eleven promising wheat genotypes at advanced stages tested at fifteen major locations and six genotypes at seventeen yield. Details of locations and parentage of evaluated genotypes are shown in Tables 1 and 2 for ready reference.
Stability measure Weighted Average of Absolute Scores (WAASB) was calculated as:
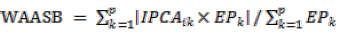
Where WAASBi was the weighted average of absolute scores of the ith genotype (or environment); IPCAik the score of the ith genotype (or environment) in the kth IPCA, and EPk was the amount of the variance explained by the kth IPCA.
Superiority index allowed variable weights to yield and stability measure (WAASB) to select genotypes that combine high performance and stability as:
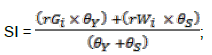
where rGi and rWi were the rescaled values for yield and WAASB, respectively, for the ith genotype; Gi and Wi were the yield and the WAASB values for ith genotype. SI superiority index for the ith genotype that weighted between yield and stability, and θY and θS were the weights for yield and stability assumed to be of order 65 and 35, respectively in this study.
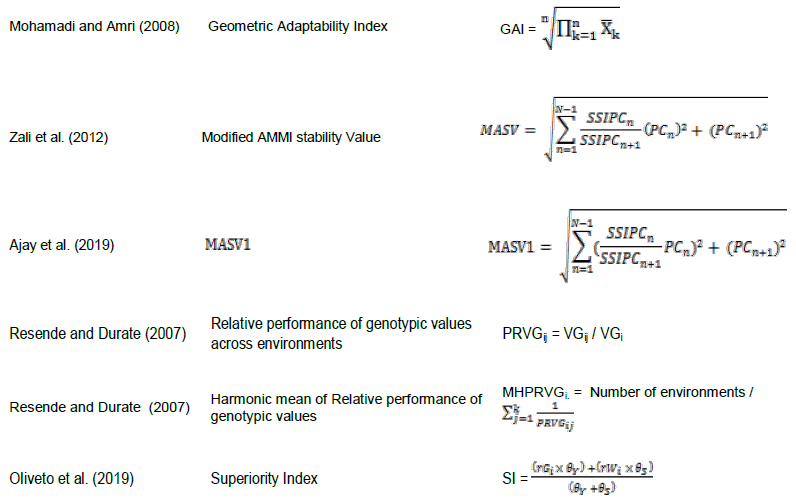
AMMI analysis was performed using AMMISOFT version 1.0, available at https://scs.cals.cornell.edu/people/hugh-gauch/ and SAS software version 9.3. Stability measures compared relative performance of genetic values (PRVG) and harmonic mean-based measure of the relative performance of the genotypic values (MHPRVG) for the simultaneous analysis of stability, adaptability, and yield (Mendes et al., 2012).
RESULTS AND DISCUSSION
First-year 2018-19 AMMI analysis
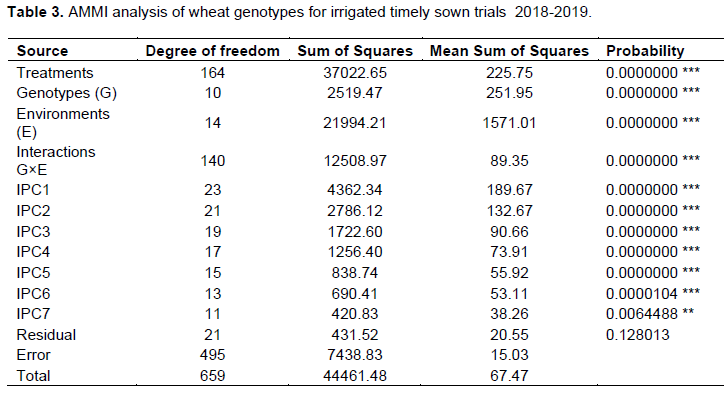
AMMI analysis gave highly significant effects of environment (E), genotypes (G), and G×E interaction. The analysis showed the greater contribution of environments, G×E interactions, and genotypes to the total sum of squares (SS) as compared to the residual effects. Further SS attributable to G×E interactions was partitioned as attributed to G×E interactions signal and G×E interactions noise. AMMI analysis is appropriate for data sets where-in SS due to interactions were of magnitude at least due to additive genotype main effects (Gauch, 2013). Environments explained significantly about 49.4% of the total sum of squares due to treatments (Table 3) which indicated the diversity of studied locations (Ajay et al., 2020). Genotypes explained only 5.6% of the total sum of squares, whereas G×E interaction accounted for 28.1% of treatment variations in yield. The higher percentage of G×E interaction as compared to genotypes supported the presence of complex G×E interaction for wheat yield. First seven significant interaction principal components (IPCA1, IPCA2…, IPCA7) explained 34.8, 22.2, 13.7, 10, 6.7, 5.5 and 3.3% of G×E interaction sum of squares, respectively. The total of significant components was 96.5% and the remaining was the residual (Oyekunle et al., 2017).
Ranking of genotypes vis-à-vis number of IPCAs
Values of IPCAs in the AMMI analysis indicate stability or adaptability of genotypes. The greater the IPCA scores reflect the specific adaptation of genotype to certain locations. While values approximate to zero recommends in general adaptations over all the locations, for the genotype. Genotypes as per absolute IPCA-1 scores were WH1239, HD3277, and HD3249. While for IPCA-2, genotypes DBW39, RAJ4529, and WH1239, would be of choice (Table 4). Values of IPCA-3 favored PBW781 K0307, DBW187, wheat genotypes. As per IPCA-4, DBW257 DBW39, and HD3249, genotypes would be of stable performance. RAJ4529, DBW187, and HD2733 genotypes were pointed by IPCA-5 measure. Genotypes DBW257,
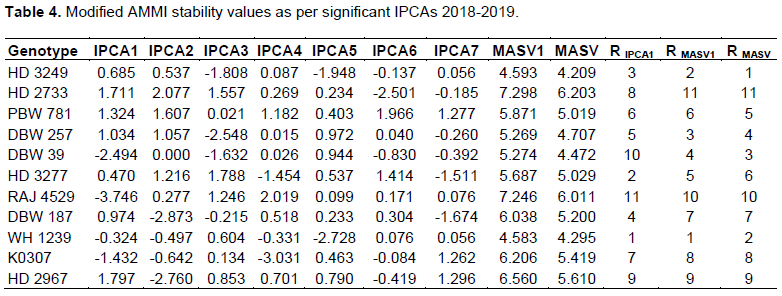
WH1239, and K0307 were identified by absolute values of IPCA-6. As per IPCA-7, desirable genotypes would be HD 3249, WH1239, and RAJ4529 for considered locations of the zone. Adaptability measures MASV and MASV1 considered all seven significant IPCAs of the AMMI analysis. Values of MASV1 identifying WH1239, HD3249, and DBW257 genotypes would express stable yield whereas genotypes HD3249, WH1239, and DBW39 would be of stable performance by MASV measure, respectively (Ajay et al., 2019).
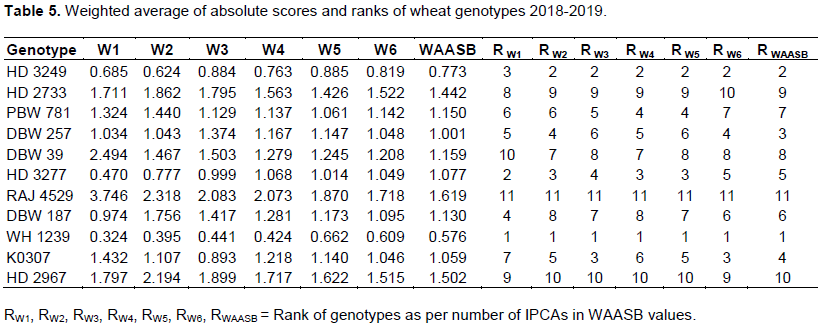
To identify how the ranks of evaluated wheat genotype was altered with utilizing numbers of IPCA in the WAASB estimation, the genotype’s ranks were obtained while considering 1, 2,..., p IPCAs in the WAASB calculations. WAASB = |IPCA1| for using only first IPCA. The genotype with the smallest WAASB value had been ranked with the first-order. Preferences of genotypes varied from WH1239, HD3277, and HD3249, based on W1 to WH1239, HD3249, and HD3277 as per W2 values while WH1239, HD3249, and K0307 by values of W3 (Table 5). Genotypes WH1239, HD3249, and HD3277 were pointed by W4; W5 favored WH1239, HD3249, and HD3277.
As per W6 measure, the genotypes WH1239, HD3249 and K0307 got higher ranks for their stable performance. Stability measures WAASB based on seven significant IPCAs simultaneously and settled for WH1239, HD3249, and DBW257 genotypes for considered locations of the zone for stable high yield. The genotype’s ranking was altered utilizing a greater number of IPCAs in the stability estimation (Olivoto et al., 2019).
Productive and broadly adapted genotypes (AMMI + BLUP)
Mean yield of genotypes as per their BLUP estimates selected DBW187, WH1239, and HD3249 wheat genotypes (Table 6). This method is simple, but not fully exploiting all information contained in the dataset. Geometric mean was also recommended to study the adaptability of genotypes (Mohamadi and Amri, 2008). Geometric mean showed higher values of DBW187, WH1239, and HD3249 as the top-ranked genotypes. As proposed by Resende (2007), the harmonic mean of genetic values (HMGV) considered the yield and stability simultaneously for the ranking of genotypes for their performance. Harmonic mean found maximum values by DBW187, WH1239, and HD3249 genotypes. Moreover, the Harmonic Mean of Relative Performance of Genotypic Values (HMRPGV) method proposed by Resende (2007a) is similar to the methods of Lin and Binns (1988) and Annicchiarico (1992). HMRPGV method for stability analysis, the genotypes can be simultaneously sorted by genotypic values (yield) and stability using the harmonic means of the yield so that the smaller the standard deviation of genotypic performance among the locations. Values of HMRPGV ranked DBW187, WH1239, and HD3249 with the performance of the genotypes among the locations. While considering the yield and adaptability simultaneously, the recommended approach was to calculate the relative performance of genetic values (RPGV) overcrop years. Relative performance of genotypic values settled for DBW187, WH1239, and HD3249 wheat genotypes.
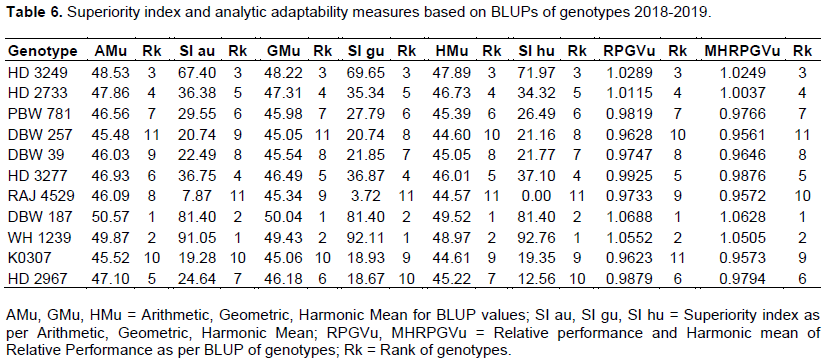
While assigning 65 and 35 weights to yield and stability, the superiority index pointed out WH1239, DBW187, and HD3249 genotypes would maintain high yield and stable performance. SI measure, considered GM and stability WH1239, DBW187, and HD3249 selected genotypes. Values of SI, using HM and stability, favored the same set of wheat genotypes WH1239 DBW187, and HD3249. Analytic measures of adaptability RPGV and MHRPGV pointed out DBW187, WH1239, and HD3249 would be more adaptable genotypes.
Productive and broadly adapted genotypes (AMMI + BLUE)
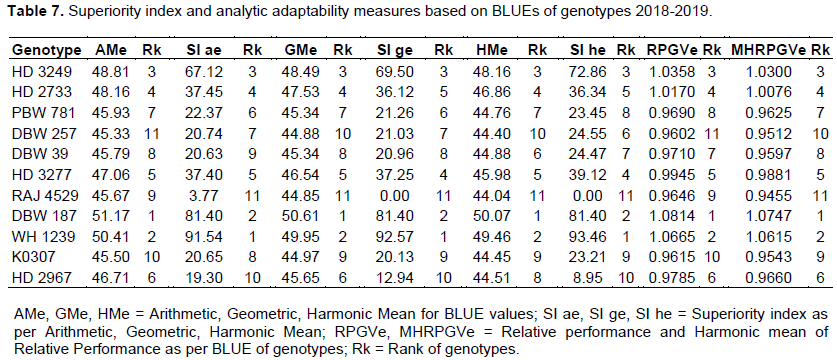
Mostly employed average of a genotype across environments identified DBW187, WH1239, and HD3249 wheat genotypes (Table 7). Genotypes with higher values of DBW187, WH1239, and HD3249 would be recommended. Wheat genotypes DBW187, WH1239, and HD3249 were selected by the harmonic mean measure. For adaptability analysis, the Relative Performance of Genotypic values had been measured across environments, and genotypes DBW187, WH1239, and HD3249 would be of choice.
The superiority index measures by assigning 65:35 weights to yield and stability pointed out WH1239, DBW187, and HD3249 genotypes would maintain high yield and stable performance. Moreover, for SI values, GM and stability were considered selected WH1239, DBW187, and HD3249 genotypes. Moreover, the values of SI based on HM along with stability favored the same set of wheat genotypes WH1239, DBW187, and HD3249. Surprisingly the same genotypes WH1239, DBW187, and HD3249 observed as more adaptable to considered locations by RPGV and MHRPGV measures also.
Biplot analysis of measures BLUP
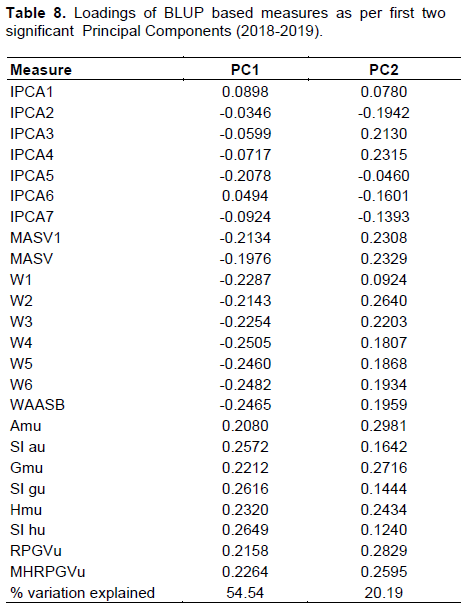
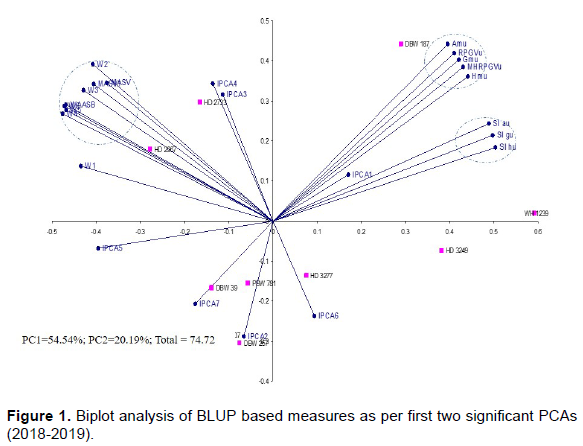
The first two significant PCs explained about 74.7% of the total variation (Table 8) with 54.5 and 20.1 contributions by PC1 and PC2 (Mohammadi et al., 2015). Random effects of wheat genotypes had been considered for stability measures. A group comprised stability measures by utilizing two or more number of interaction principal components (Figure 1). Adaptability measures as per arithmetic, geometric and harmonic means along with the corresponding values of RPGV and MHRPGV expressed bondage with each other. The cluster is seen in different quadrants. Moreover, this group maintained the right angle with MASV, MASV1 and stability measures. Superiority indexes were based on the mean yield of wheat genotypes placed in the same quadrant. The performance difference of genotypes would be very less by superiority indexes and adaptability measures.
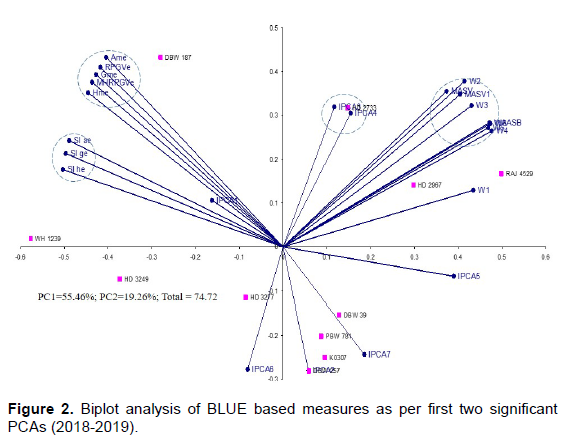
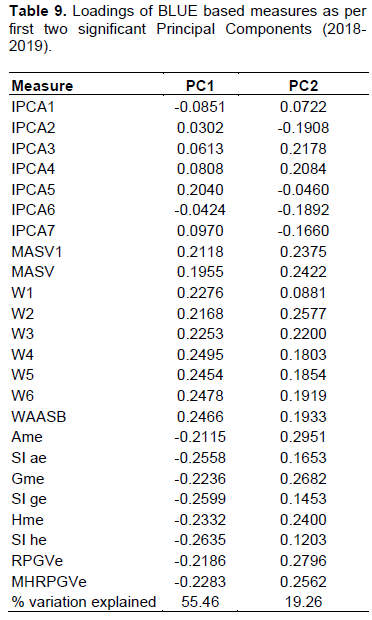
BLUE
Table 9 reflects the loadings of the stability measures as per the first two significant principal components while considering the fixed effects of genotypes. Two significant PCs have explained 74.7% of the total variation with respective contributions of 55.4 and 19.2% (Table 9). The first group comprised MASV, MASV1 (Ajay et al., 2020), and stability measures by utilizing two or more number of interaction principal components (Figure 2). Adaptability measures as per arithmetic, geometric and harmonic means and their corresponding values expressed deviation from all already mentioned measures and observed in a different quadrant. However, this group maintained the right angle with MASV, MASV1, and stability measures. The cluster of superiority indexes as per averages of wheat genotypes yield was placed in the same quadrant. Performance of genotypes would not be different by superiority indexes and adaptability measures.
Second-year 2019-2020 AMMI analysis
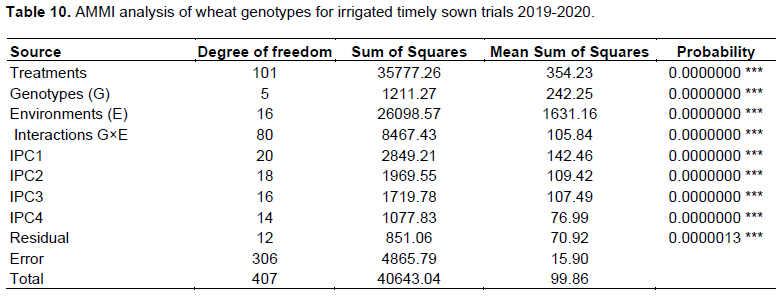
Highly significant effects of environment (E), genotypes (G), and G×E interaction were observed by AMMI analysis of wheat genotypes evaluated under multi-location trials. The environment had explained significantly portion 64.2% of the total sum of squares due to treatments (Table 10). Genotypes explained only 2.9% of the total sum of squares, whereas G×E interaction accounted for 20.8% of treatment variations in yield. First four significant interaction principal components (IPCA1, IPCA2, IPCA3 and IPCA4) explained 33.6, 23.2, 20.3, and 12.7% of G×E interaction sum of squares, respectively. The total significant component was 89.9% of total variation which was accounted for by four interaction terms and the remaining leftover was the residual.
Ranking of genotypes vis-à-vis number of IPCAs
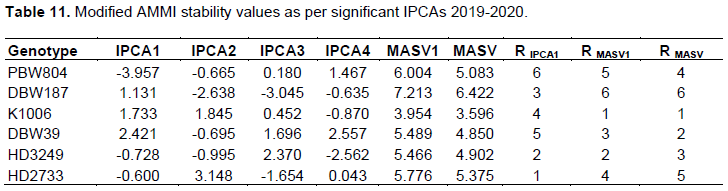
As per absolute IPCA-1 scores, genotypes were ranked as HD2733 and HD3249. While for IPCA-2, genotypes PBW804 and DBW39 would be of choice (Table 11). Values of IPCA-3 favored PBW804 and K1006 wheat genotypes. As per IPCA-4, HD2733, and DBW187, genotypes would be of stable performance. Adaptability measures MASV and MASV1 considered all significant IPCAs of the analysis simultaneously. Values of MASV1 identified genotypes K1006 and HD3249 would express stable yield whereas genotypes K1006 and DBW39 would be of stable performance by MASV measure, respectively.
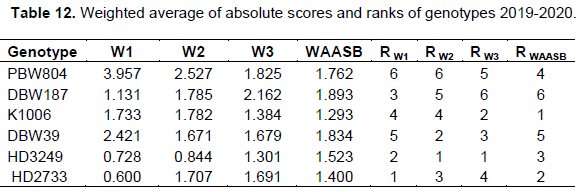
Values of stability measure W1 preferred HD2733 and HD3249 genotypes and HD3249 and DBW39 as per W2 values, while HD3249 and K1006 by values of W3 (Table 12). Stability measures WAASB based on all significant IPCAs settled for K1006 and HD2733 genotypes for considered locations of the zone for stable high yield. It was observed that the genotype ranking was altered by the extent to which IPCAs are included in the WAASB estimation.
Productive and broadly adapted genotypes (AMMI + BLUP)
An average yield of genotypes as per BLUP values of genotypes yield selected HD3249 and K1006 wheat genotypes (Table 13). Geometric mean observed higher values for HD3249 and K1006 as top-ranked genotypes. Harmonic mean of yield expressed higher values for HD3249 and K1006 genotypes. Values of HMRPGV ranked HD3249 the genotypes performance among the locations. Relative Performance of Genotypic Values settled for HD3249 and K1006 wheat genotypes.
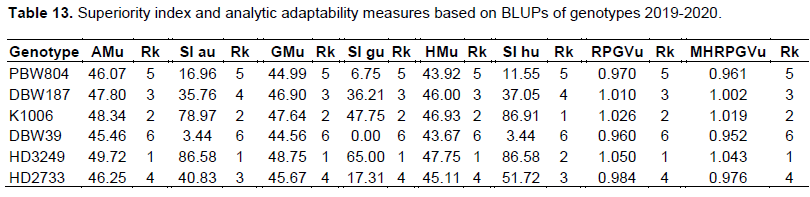
While assigning 65 and 35 weights to yield and stability, superiority indexes pointed out HD3249 and K1006 genotypes would maintain high yield and stable performance. Analytic measures of adaptability RPGV and MHRPGV pointed out HD3249 and K1006 would be more adaptable genotypes.
Productive and broadly adapted genotypes (AMMI + BLUE)
The arithmetic means identified HD3249 and K1006 wheat genotypes (Table 14). Geometric mean selected HD3249 and K1006 genotypes with high values. HD3249 and K1006 genotypes were selected by measure of Harmonic mean. For HMRPGV method for stability analysis, the genotypes can be simultaneously sorted by genotypic values (yield) and stability using the harmonic means of the yield so that the smaller the standard deviation of genotypic performance among the locations Wheat genotypes HD3249 and K1006 were selected by this measure. The Relative Performance of Genotypic Values found HD3249 and K1006 genotypes would be of choice.
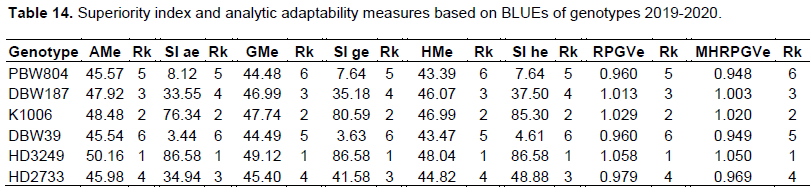
Superiority index while assigning 65 and 35 weights to various averages yield and stability pointed out HD3249 and K1006 genotypes would maintain high yield and stable performance.
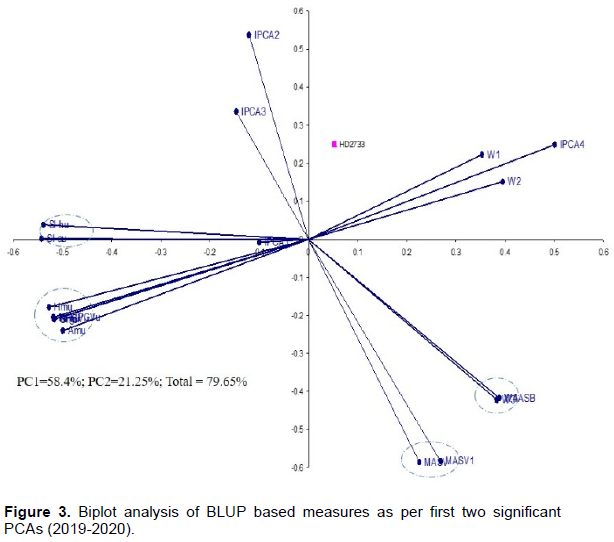
Biplot analysis of measures BLUP
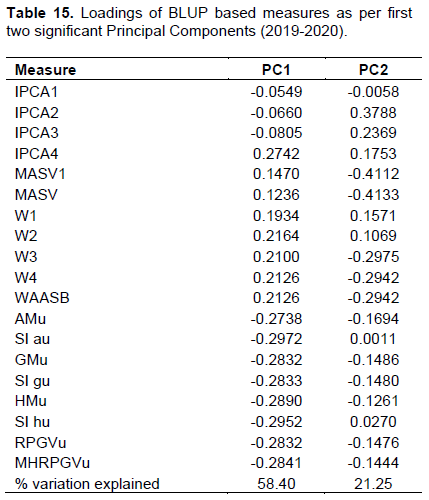
The first two significant PCs jointly explained 79.6% of the total variation (Table 15) with 58.4 and 21.2 contributions by PC1 and PC2. A group comprised MASV, MASV1 and nearby group contained stability measures by utilizing three or more number of interaction principal components (Figure 3). As stability measures, the first two interaction principal components were placed with IPCA4 measure. Adaptability measures as per arithmetic, geometric and harmonic means along with the corresponding values of RPGV and MHRPGV expressing bondage and placed in a different quadrant. Superiority indexes as per yield of wheat genotypes placed in another cluster occupied place in a separate quadrant. However, this group maintained right angle with AMMI based measures. The performance difference of genotypes would be very more by superiority indexes and stability measures.
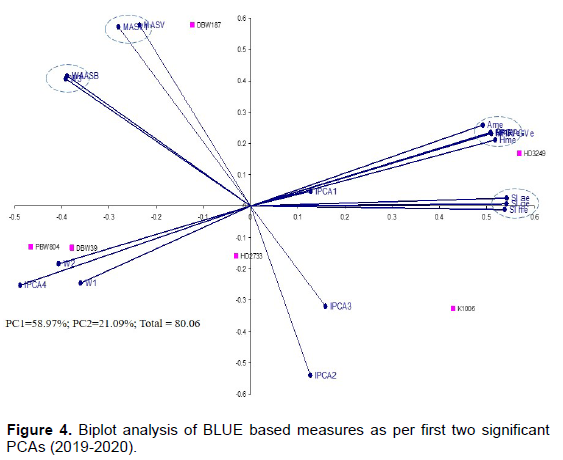
BLUE
Loadings of the stability measures as per BLUE of genotypes were tabulated and the first two significant PC has explained 80% of the total variation with respective contributions of 58.9 and 21.1% (Table 16).
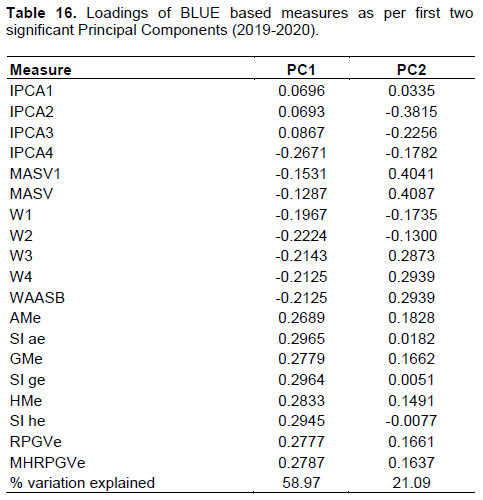
The first group comprised MASV and MASV1 and the second nearby cluster of stability measures by utilizing three or more interaction principal components (Figure 4). Adaptability measures as per arithmetic, geometric and harmonic means and their corresponding values expressed deviation from all already mentioned measures and placed in a different quadrant. Moreover, this group maintained the right angle with stability measures. The cluster of superiority indexes as per averages yield of wheat genotypes were placed in the same quadrant. Right angles were expressed by superiority indexes with AMMI-based measures, that is, MASV and MASV1. Performance of genotypes would not be different by superiority indexes and adaptability measures.
CONCLUSIONS
Stability measures considering stability and yield simultaneously would be more appropriate to recommend/identify high-yielding wheat genotypes with stable performance. In the present study, the main advantages of AMMI and BLUP had been combined to increase the reliability of multi-locations trials analysis. An interesting advantage was provided by superiority indexes to assign variable weights to the yield and stability performance of genotypes. Researcher may prioritize the productivity of a genotype rather than its stability or vice-versa as per the goal of a crop improvement trial.
The superiority index has the potential to provide reliable estimates in future studies with the possibility of joint interpretation of performance and stability in a biplot graphs while utilizing number of IPCAs.
CONFLICT OF INTERESTS
The authors have not declared any conflict of interests.
REFERENCES
|
Agahi K, Ahmadi J, Oghan H A, Fotokian M H, Orang S F (2020). Analysis of genotype × environment interaction for seed yield in spring oilseed rape using the AMMI model. Crop Breeding and Applied Biotechnology 20(1):e26502012. |
|
|
Ajay BC, Aravind J, Fiyaz R A, Kumar N, Lal C, Kona P, Dagla M C, Bera S K (2019). Rectification of modified AMMI stability value (MASV). Indian Journal of Genetics and Plant Breeding 79(4):726-731. |
|
|
Ajay BC, Bera SK, Singh AL, Kumar N, Gangadhar K, Kona P (2020). Evaluation of Genotype × Environment Interaction and Yield Stability Analysis in Peanut Under Phosphorus Stress Condition Using Stability Parameters of AMMI Model. Agriculture Research 9:477-486. |
|
|
Annicchiarico P (1992). Cultivar adaptation and recommendation from alfalfa trials in northern Italy. Journal of Genetics and Plant Breeding 46:269-278. |
|
|
Ashwini KVR, Ramesh S, Sunitha NC (2021). Comparative BLUP, YREM-based performance and AMMI model-based stability of horse gram [Macrotyloma uniflorum (Lam.) Verdc.] genotypes differing in growth habit. Genetic Resources and Crop Evolution https://doi.org/10.1007/s10722-020-01089-x. |
|
|
Gauch HG (2013). A simple protocol for AMMI analysis of yield trials. Crop Science 53(5):1860-1869. |
|
|
Lin CS, Binns MR (1988). A superiority measure of cultivar performance for cultivar x location data. Canadian Journal of Plant Science 68(1):193-198. |
|
|
Mendes FF, Guimarães LJM, Souza JC, Guimarães PEO, Pacheco CAP, Machado JR, de A, Meirelles WF, Silva AR da, Parentoni SN (2012). Adaptability and stability of maize varieties using mixed model methodology. Crop Breeding and Applied Biotechnology 12(2):111-117. |
|
|
Mohammadi M, Sharifi P, Karimizadeh R, Jafarby JA, Khanzadeh H, Hosseinpour T, Poursiabidi MM, Roustaii M, Hassanpour HM, Mohammadi P (2015). Stability of grain yield of durum wheat genotypes by AMMI model. Agriculture Forestry 61(3):181-193. |
|
|
Mohammadi R, Amri A (2008). Comparison of parametric and non-parametric methods for selecting stable and adapted durum wheat genotypes in variable environments. Euphytica 159(3):419-432. |
|
|
Olivoto T, Lucio A Dal'Col, Gonzalez, Silva JA da, Marchioro VS (2019). Mean performance and stability in multi-environment trials I: Combining features of AMMI and BLUP techniques. Agronomy Journal 111(6):2949-2960. |
|
|
Oyekunle M, Menkir A, Mani H, Olaoye G, Usman IS, Ado S (2017). Stability analysis of maize cultivars adapted to tropical environments using AMMI analysis. Cereal Research Communications 45(2):336-345. |
|
|
Piepho HP (1994). Best linear unbiased prediction (BLUP) for regional yield trials: a comparison to additive main effects and multiplicative interaction (AMMI) analysis. Theoretical and Applied Genetics 89(5):647-654. |
|
|
Piepho HP, Mo¨hring J, Melchinger AE, Bu¨chse A (2008). BLUP for phenotypic selection in plant breeding and variety testing. Euphytica 161(1):209-228. |
|
|
Resende MDV (2007). Software Selegen - REML/BLUP: sistema estatístico e seleção genética computadorizada via modelos lineares mistos. Embrapa Florestas, Colombo 350 p. |
|
|
Resende MDV, Duarte JB (2007). Precision and Quality Control in Variety Trials. Pesquisa Agropecuaria Tropical 37:182-194. |
|
|
Sa'diyah H, Hadi A F (2016) AMMI Model for Yield Estimation in Multi-Environment Trials: A Comparison to BLUP. Agriculture and Agricultural Science Procedia 9:163-169. |
|
|
Zali H, Farshadfar E, Sabaghpour SH, Karimizadeh R (2012) Evaluation of genotype × environment interaction in chickpea using measures of stability from AMMI model. Annals of Biological Research 3:3126-3136. |
|
Copyright © 2024 Author(s) retain the copyright of this article.
This article is published under the terms of the Creative Commons Attribution License 4.0


