Full Length Research Paper

ABSTRACT
The primary efforts in any wheat breeding program are the targeting of important traits and the detection of genetic diversity among different wheat genotypes in different environments. Hence to identify prominent traits in wheat lines in low altitude conditions of the bimodal humid forest zone of Cameroon, 38 wheat lines were characterized on the base of morphological traits. The field experiment was conducted in low altitudes conditions in 2016-2017. 18 morphological traits were scored on the 38 wheat lines sown following an incomplete alpha-lattice design. The result obtained revealed a high genetic variation among all the studied traits in this area. Correlation and path correlation analysis revealed overall positive influence of the glossiness of grains and grain color on the grain quality character. Factors analysis based on principal component analysis revealed 3 important factors with a cumulative variance of 40.3%. The first important factor F1, explaining 16.7% of the variance was composed of Plant habit (Phb), Tiller number (Tnu), Culm thickness (Cthic), and Spike density (Sde). The second factor (F2) explaining 12.4% of the variance was composed of Leaf angle (Lan), Glume color (Glco), and Spike density (Sde). The third factor (F3) explaining 11.2% of the variance was composed of Grain color (Gco), Grain quality (Gqu) and Glossiness of grain (GlGr). Thus, suggesting suitable characters for wheat breeding programs in this studied area. The determination of contribution of variance and cluster analysis studies allowed observing that the wheat lines SST835, Konstrad F2004- 1, Kenya2, SST843, SST806, Pfau4, Sup152-1 and Nd643-2 highly contributed to the variance in each factor with a high genetic dissimilarity among them. Thus, suggesting they may possess a high genetic polymorphism that could be further explored through molecular techniques for breeding programs.
Key words: Genetic traits, wheat line, breeding programs.
INTRODUCTION
Wheat is a cereal grass of the genus Triticum of Poaceae family. It is the third most consume cereal after maize and rice with a world annual production of approximately 766 million tons (FAO, 2019). Africa wheat demand has increased along the years, especially in urban areas due to increase in population growth rate and strong urbanization registered (Negassa et al., 2013). As the main source of food security, wheat production in Cameroon is estimated at 900 tons annually FAO(2019), which is highly inferior to the national demand estimated at 860,000 tons in 2020, with a projection of imports of 900,000 tons in 2021 (Anonyme, 2021). Cameroon is naturally endowed with enormous agricultural potential despite this fact our consumption depends at 100% on importation (PAM, 2011). The major and logical resolution would therefore be the increase in local production which will involve the extension of wheat cultivation in the five agro-ecological zones. Cameroon landforms are mostly characterized by a high level of topographic variation. Thus, wheat evaluation in high, mid and low altitude areas will be of great necessity, to firstly extent wheat adaptation capacities in these areas, and secondly provide information to plant breeders, to target characters that may easily permit a better selection of wheat lines highly adapted in these environments. A Similar study was conducted in high altitude conditions in Cameroon by Ngo Ngom, (2017), where appropriate characters were selected for wheat breeding programs in this high altitude environment. However, the potential of adaptation and expression of wheat lines in high and low altitude conditions has been demonstrated by Altuhaish et al. (2014) to vary significantly. Hence conducting the same study in different environments with a greater number of different wheat genotypes will be highly informative to plant breeders and for wheat cultivation extension in Cameroon.
The assessment of genetic diversity is a key prerequisite for studying the adaptation of populations to new environmental conditions, and therefore for the selection of new varieties (Tékeu et al., 2017). Hence it is important to study genetic variability in wheat germplasm to meet the diversified goals, such as increase yield, wider adaptation, desirable qualities, pest and fungi diseases resistance (Fufa et al.,2005). Morphological and agronomic characters played a pivotal role in determining important traits, which can be used in breeding programs (Siahbidi et al., 2012). These morphological descriptors are displayed as presence/absence of character state to discriminate accessions during germplasm evaluation (Malik et al., 2014). Multivariate analysis is the most commonly used approach for genetic variability estimation. Multivariate technics like principal component analysis or factor analysis and cluster analysis are one of the preferred tools in agro-morphological characterization of genotypes and their grouping on the basis of their similarity (Mohammadi and Prasanna, 2003; Peeters and Martinelli, 1989).
Principal components analysis or factor analysis is a method that reduces a large number of correlated variables to a small number of uncorrelated variables or component. It extracts a subset of identical variables, identifies the basic concept of multivariate data, and recognizes applied and biological connections among the traits (Bramel et al., 1984; Siahbidi et al., 2012). Principal component analysis or factor analysis is an approach that gives comprehensive information of characters that deeply reveals the variability in crops (Rachovska et al., 2002). Factor analysis identifies plant traits that characterize best the distinctness among selected genotypes. It has been used to partition observed agronomic variation in genotypes of many crops such as, rubber (Omokhafe and Alika, 1999), sweet potato landraces (Afuape et al., 2011), rice (Nassir, 2002), sesame (Mponda et al., 1997) and durum wheat (Ahmadizadeh et al., 2011; Siahbidi et al., 2012). Hence, it exploitation may not only revealed the interrelationship existing among the study traits, but also permit the appreciation of important characters that could be chosen by local plant breeders in selection of high quality wheat cultivars. This study aimed to identify important morphological characters in wheat lines evaluated in low altitude conditions of the bimodal humid forest zone of Cameroon.
MATERIALS AND METHODS
Field experiment
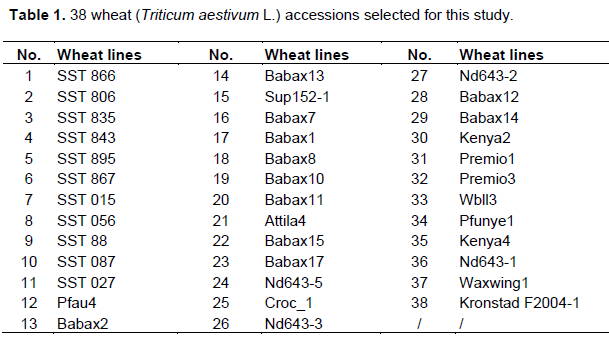
The experiment was conducted in low altitude area of 650 m above the sea level, with average temperature and rainfall of 24.5°C and 1560 mm respectively, located in lowland of Nkolbisson zone with a relative humidity of 62%. A total of thirty-eight wheat lines were evaluated in a trial during 2016-2017. Accessions were collected in Africa, Mexico and some from international Maize and wheat improvement center (CIMMYT) (Table 1). Those varieties were evaluated in an incomplete alpha-lattice design with 2 repetitions. Each wheat line was planted in a single 3 m row with 25 cm spacing between the rows.
Morphological measured traits
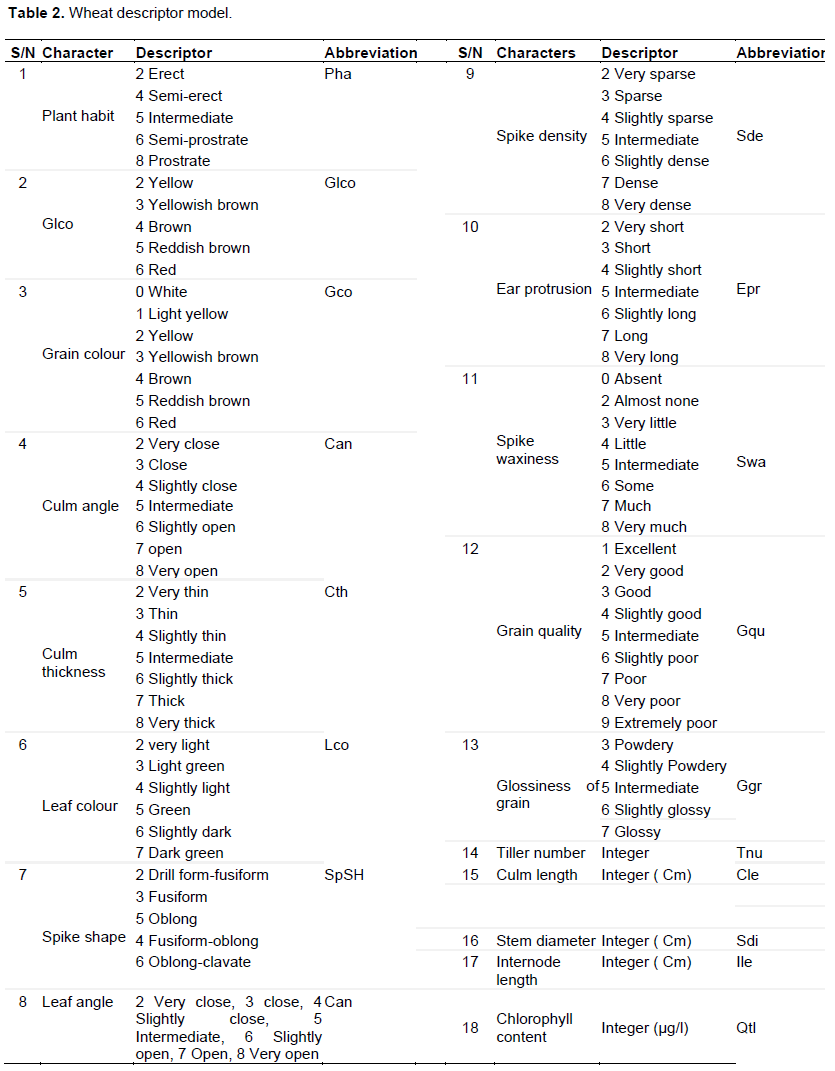
The 38 wheat lines were scored on the base of 18 morphological traits, among which, Spike shape (SpSH), Leaf colour (Lco), Spike waxiness (Swax), Plant habit (Phb), Culm thickness (Cthic), Glume colour (Glco), Grain colour (Gco), Ear protrusion (Epr), Spike density (Sde), Glossiness of grain (GrGlo), Grain quality (Gqu), Tiller number (Tnu), Chlorophyll content (Qtl), Leaf angle (Lan), Internode length (Ile), Culm angle (Can), Stem diameter (Sdim) and Culm length (Cle). These traits were collected following the wheat descriptor model (Table 2), and were submitted to data analysis.
Data analysis
The 18 morphological characters were analyzed. Their means subjected to analysis of variance (ANOVA), correlation analysis to appreciate the interrelationship existing among them and genetic correlation applied for computation of path analysis according to Felipe de Mendiburu method (Singh and Chaudhary, 1979). Factor analysis was done and principal components method analysis was used to extract factorial load of matrix and to estimate the number of factors. Hence, the factors having a root bigger than two were selected, which permitted the formation of a factorial coefficient matrix (Harman, 1976). Hierarchical clustering was done using the euclidean distancing method. The data were analyzed using R software of version 3.5.3.
RESULTS
Analysis of variance
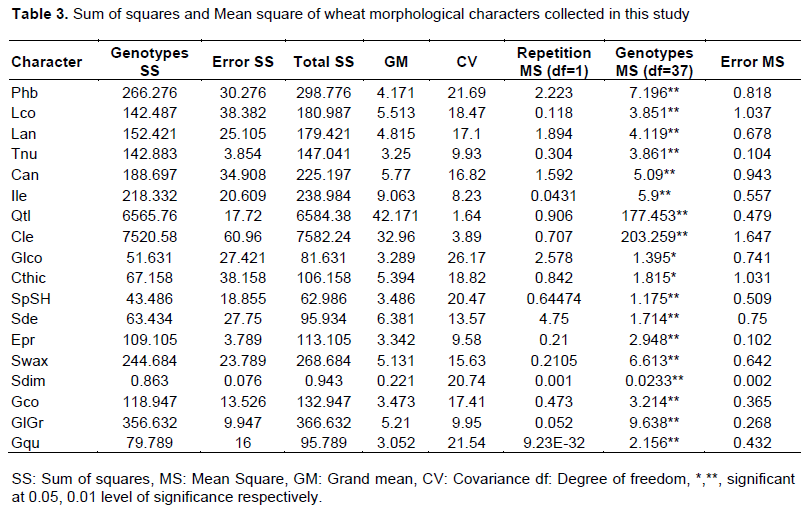
The analysis of variance of the data collected following the wheat descriptor model for all the studied traits indicated significant differences (P<0.01) among the 38 wheat genotypes evaluated in this environment (Table 3).
Correlation analysis
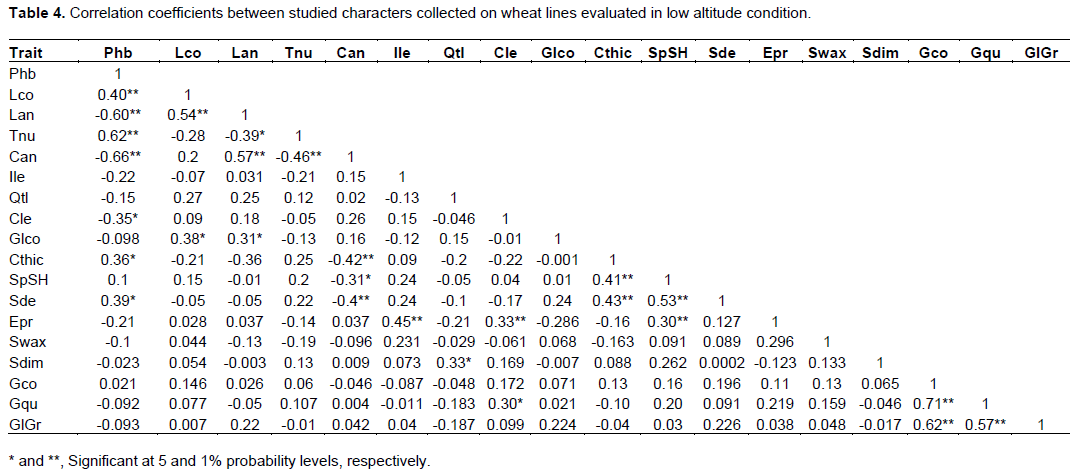
The present study showed positive significant correlations between important kernel variables like glossiness of grain (GlGr) and Grain color (Gco) (0.62**), glossiness of grain and grain quality (Gqu) (0.57**) and between grain quality and grain color (0.71**) (Table.4). This indicate that the glossy grains in this studied showed poor grain quality compare to powdery grains (Table.2), and that white colored grains were mostly of good quality. Also, positive correlation was observed between grain quality and culm length (0.30*) (Table 4), hence an increase in culm length might negatively influence the quality of grains in this study area (Table 2). On the other hand, negative correlation were observed between grain quality (Gqu) and variables like plant habit, chlorophyll content (Qtl), leaf angle (Lan), culm thickness (Cthic), internode length (Ile) and stem diameter (Sdim) (Table 4), which indicate an increase in each of this variable, will positively influence the grain quality (Table 2). Equally, positive correlations were observed between spike variables like spike density and spike shape (0.53**) (Table 4). Which indicate there is an increase in spike density when the spike shape varies from oblong to oblong-clavate (Table 2). Also, it was observed that the spike density increases as the plant habit goes from erect to prostrate (Table 2), as a positive correlation (0.39*) was revealed between these variables (Table 4). This observation was also, verified between the spike density and culm thickness (0.43**), where an increase in culm thickness positively influence the spike density (Table 2). Furthermore, variable like glume color (Glco) showed positive significant correlations with variables like leaf color (0.38*) and leaf angle (0.31*). Lastly correlations were observed between important variables like culm thickness and plant habit (0.39*), culm angle and leaf angle (0.57**), tiller number and plant habit (0.62**), leaf angle and leaf color (0.54**) and between plant habits and leaf color (0.40**) (Table 4).
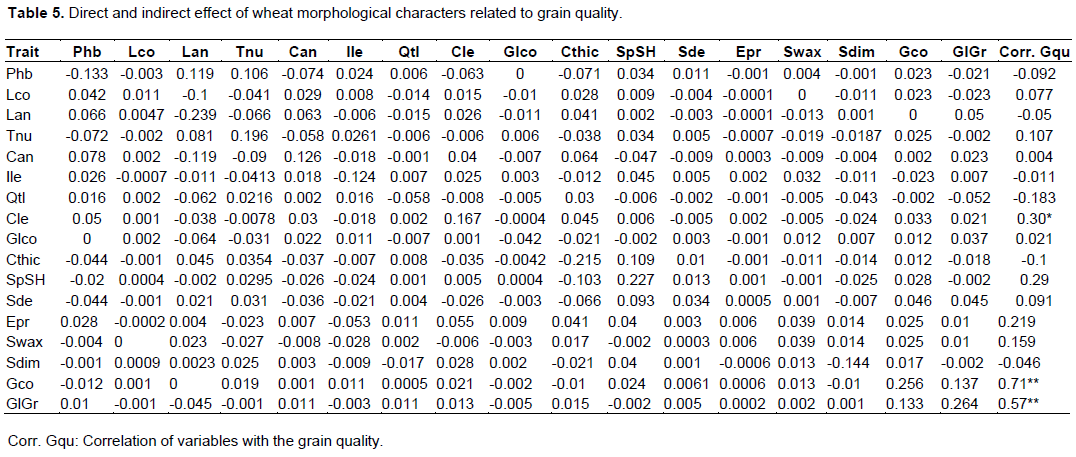
Path analysis
Path analysis is basically breaking down of correlation to define path through which a particular character contributes to a major trait. In this study it depicted the strength of association of all independent variables under study on the grain quality character (Table 5). Path coefficient analysis in this study revealed that the glossiness of grain had a maximum direct effect on grain quality variable followed by the character grain color and the spike shape (Table 5). Nonetheless, overall positive effect of the spike shape on the grain quality variable was not significant due to the negative indirect effect through some characters like the plant habit, leaf angle, culm thickness, spike waxiness, stem diameter and glossiness of grains (Table 5). The character tiller number showed a direct positive effect (0.196) on grain quality, but a non-significant positive association with the character grain quality (Table 5). This can be justified by the negative indirect effect through characters like plant habit, leaf color, culm angle, chlorophyll content, culm length, culm thickness, ear protrusion, spike waxiness, stem diameter and glossiness of grains (Table 5). This observation was also revealed for the character culm angle on grain quality, that showed a positive direct effect (0.126), but a non-significant positive association with the grain quality, due to the negative indirect contribution of characters like leaf angle, internode length, chlorophyll content, glume color, spike shape, spike density, spike waxiness and stem diameter (Table 5). Equally, the character leaf color showed a positive direct effect on grain quality. However, it was revealed a non-significant positive association with the character grain quality due to the negative indirect effect of some characters like leaf angle, tiller number, chlorophyll content, glume color, spike density, ear protrusion, stem diameter and glossiness of grain (Table 5). This observation was also verified for the character spike density, that showed a positive direct effect on grain quality, but with a non-significant positive association, which here is justified by a negative indirect effect of characters like plant habit, leaf color,, culm angle, internode length, culm length, glume color, culm thickness, and stem diameter (Table 5). Also, the character ear protrusion and spike waxiness showed positives direct effect on grain quality, but with positives non-significant associations, this due to the negative indirect contributions of variables like leaf color, tiller number, internode length and plan habit, tiller number, culm angle, internode length, culm length, glume color, spike shape respectively. Instead, the variable culm length revealed a positive direct (0.167) effect and a positive significant association with the grain quality variable (Table 5). On the contrary, variables like the plant habit, leaf angle, internode length, chlorophyll content, glume color, culm thickness and stem diameter showed negative direct and indirect effect, hence with negative association with the variable grain quality (Table 5).
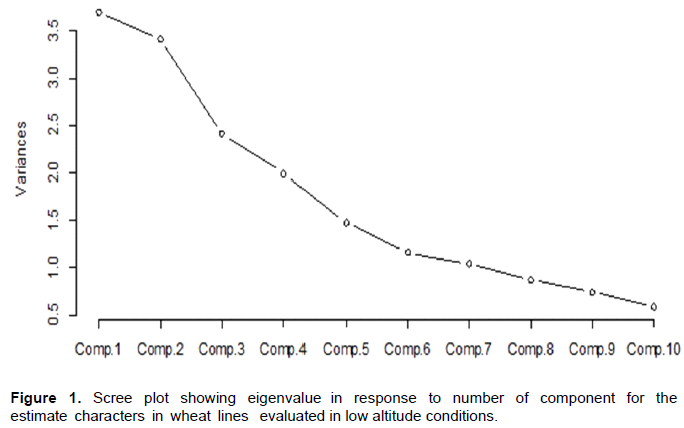
Scree plot and factor analysis
Scree plots were constructed to appreciate the variation in eigenvalue of the different factors and their importance in low altitude conditions (Figure 1). Generally, factors with eigenvalues greater than 1 (eigenvalue > 1) are selected in all analyses. But the appreciation of the variation in eigenvalue of each factor in this study permitted to select factors with an eigenvalue greater than 2 (eigenvalue > 2) (Figure 1).
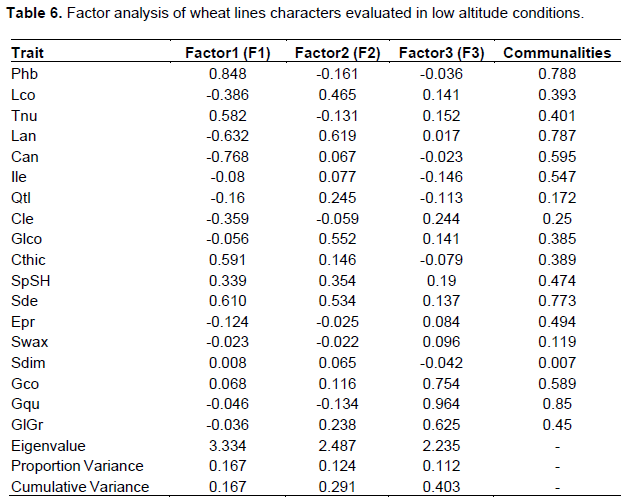
The first three factors explained 40.3% of cumulative variance (Table 6). The first factor F1 explained 16.7 % of the variance, was composed of highly loaded suitable growth variables like Plant habit (Phb), Tiller number (Tnu), Culm thickness (Cthic) and Spike density (Sde), the second factor (F2), explained 12.4% of the variance was composed of variables like Leaf angle (Lan), Glume color (Glco) Spike density (Sde) and the third factor (F3) explained 11.2 % of the variance was composed of Grain color (Gco), Grain quality(Gqu) and Glosiness of Grain (GlGr) (Table 6).
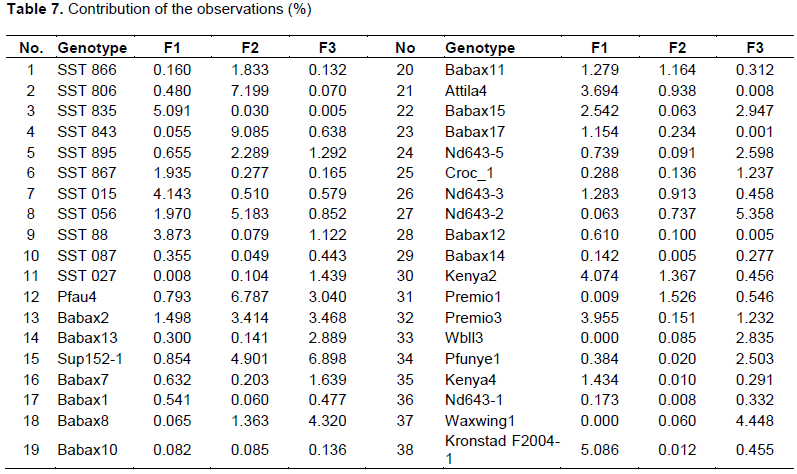
Contribution of wheat lines to F1, F2 and F3 factors
The evaluation of the contributions of each wheat line to the variance in each factor showed that, lines SST835 and Kronstrad F2004-1 contributed 5% of variance in F1 factor. The wheat lines SST015 and Kenya2 showed a contribution of 4% and lastly, the lines SST88, Atilla4 and Premio3 showed a contribution of 3% in F1 factor (Table 7). It was observed a high contribution of more than 9% of line SST843, followed by SST806 and Pfau4, which showed a contribution of more than 7 and 6% of variance respectively in F2 factor. Also, wheat lines SST056, Sup152-1 and Babax2 showed different contributions in variance of more than 5, 4 and 3% respectively in F2 factor. Lastly, it was observed in F3 factor a high contribution of variance of more than 6 and 5% of wheat lines Sup152-1 and Nd643-2 respectively. Babax8 and Waxwing1 showed a contribution of more than 4%, and Pfau4 and Babax2 showed a contribution of more than 3% of variance in F3 factor (Table 7).
Cluster analysis
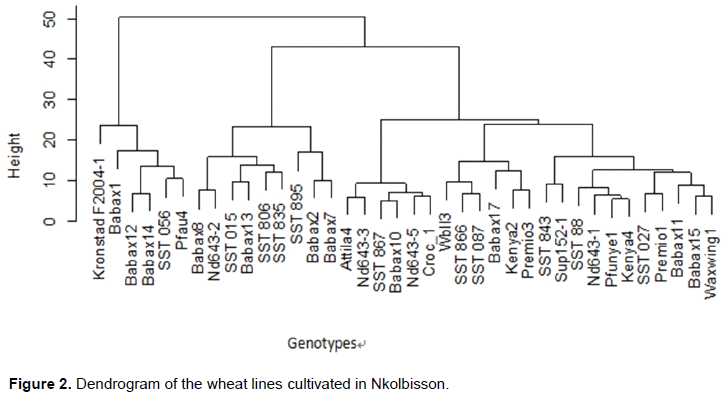
Cluster analysis appreciates the genetic similarity and dissimilarity among genotypes. In this study cluster analysis was performed to appreciate the genetic variability among wheat genotypes that contributed to the variance in each factor. It was revealed in this study that, the wheat genotypes SST835 and Konstrad F2004-1 that highly contributed (>5%) to the variance in F1 factor (Table 7), showed a high genetic dissimilarity among them (Fig.2). This observation was similar for wheat genotypes SST015 and Kenya2 that contributed at 4% to the variance in F1 factor (Table 7) and showed a high genetic dissimilarity. However, it was revealed that wheat genotypes SST015 and SST835 showed a low genetic dissimilarity among them (Fig.2). In the second factor (F2), the wheat genotype SST843 that highly contributed (>9%) to the variance (Table 7), showed a high genetic dissimilarity with the wheat genotype SST806 that contributed at 7% to the variance in F2 factor and with the wheat genotype Pfau4 that contributed at 6% to the variance in F2 factor (Figure 2). Also, the wheat genotypes SST806 and Pfau4 showed a high genetic dissimilarity among them (Figure 2). Lastly, in F3 factor the wheat genotype Sup152-1 that highly contributed (6%) to the variance showed a high genetic dissimilarity (Figure 2) with the wheat genotype Nd643-2 that contributed at 5% to the variance in F3 factor (Table.7). Also, it was observed that genotype Babax8 and Waxwing1 that contributed both at 4% to the variance in F3 factor (Table 7) showed a high genetic dissimilarity among them (Figure 2). However, the genotype Babax8, was genetically closer to genotype Nd643-2, meanwhile, genotype Waxwing1 showed a close genetic similarity with genotype Sup152-1 (Figure 2).
DISCUSSION
The collection and characterization of various agronomic and physiological traits of genotypes are primary steps in plant breeding programs (Ahmadizadeh & al., 2012). A high number of researchers by means of factor analysis have determined various important criteria that could be used in selection of important grain quality and yield traits in wheat genotypes. Thus, this study that purpose was to target important morphological characters essential for wheat breeding programs in Nkolbisson study area revealed after correlation and factor analysis that, the character glossiness of grain and grain color showed positive significant correlation and indirect positive effect with the variable grain quality, and it appears in this study after factor analysis that these characters were suitable selection criterion for wheat improvement in this area. These results confirm the report made by Gaines et al. (1996), which classified the grain vitreousness and color as physical factors that persuade the grain quality of wheat. Also, this study revealed that important spike variables like spike density showed positive non-significant correlation with grain quality variable with positive direct and indirect effect and factor analysis study revealed that this variable is suitable for genetic diversity study of wheat in this area. A Similar result was obtained by Siahbidi et al. (2012), in their study of factor analysis of agro-morphological characters in durum wheat lines, where it was revealed a high loading in first factor (F1) of the variable number of spikelet annotated Spike density (Sde) in our study and appeared to be effective in increasing yield in wheat lines. A similar result was also observed in a study of the correlation and path analysis of yield and its components and plants traits in wheat, where the number of spike was observed like a prominent traits that directly influences yield in wheat (Okuyama et al., 2004). Also, Malik et al. (2014), showed in their study that, morphological character like Spike density and Plant habit were prominent determinants for genetic diversity in Indian wheat. This result was verified in our study since the character Plant habit (Phb) appeared to be highly loaded in the first factor (F1). Equally the variable tiller number in this study was observed after factor analysis to be suitable for wheat diversity study and positively contribute to grain quality variables. Feng et al. (2007), in their study of the difference in grain yield and quality among tillers in rice genotypes differing in tillering capacity, demonstrated that there exists a significant difference in grain quality among tillers within a plant for both genotypes. In contrary, the variable culm thickness that showed negative correlation and negative direct effect on grain quality, appeared to be suitable characters for wheat breeding programs in this area after factor analysis. Indeed, large culm trait was demonstrated to be an important trait in biological and grain yield increase in rice Wu et al. (2011). Furthermore, this study showed that an increase in culm length negatively influence the grain quality character. Lastly, the glume color, that showed positive but non-significant contribution to the grain quality, appeared to be highly loaded in F2 factor, indicating it is a suitable character for wheat breeding programs in this study area. Instead, the leaf angle character showed a negative contribution to the grain quality variable, however, showed a high loading in F2 factor. This same character leaf angle was observed in a study of relationships between grain yield, flag leaf morphology, carbon isotope discrimination and ash content in irrigated wheat, to have non-significant influence on wheat yield (Monneveux et al., 2004). On the other hand, it was reported in recent studies that, Leaf traits such as flag leaf angle, flag leaf width, flag leaf length, the ratio of length/width of flag leaf, and flag leaf area may be useful for improving grain yield in wheat (Liu et al., 2018). For wheat breeders to increase the genetic progress in yield, they search for germplasm of high genetic diversity (Uddin and Boerner, 2008). The estimated genetic diversity has great importance for optimal utilization and conservation of germplasm for plant breeding and other activities, so, there is a great necessity of investigating the genetic diversity in wheat germplasm, to broaden the genetic variation for future breeding and genetic resource conservation program (Al-Naggar et al., 2020) and crop improvement programs. To this end, the contribution of each genotypes to the variance in each factor was conducted to appreciate the genetic polymorphism that could exist among the same or different genotypes in view of targeting wheat genotypes with high morphological diversity which could translate the high genetic diversity existing among them, since genetic diversity is the material basis for crop improvement (Valentina Špani? et al., 2012). Hence this study of the contribution of wheat genotypes to the variance in each factor revealed that, in F1 factor the wheat lines SST835 origin from South Africa, Konstrad F2004-1 and Kenya2 both origin from CIMMYT highly contributed to the variance and could possess after cluster analysis a high genetic polymorphism that showed a high dissimilarity among them. Also, wheat lines SST843, SST806 from South Africa and Pfau4 from CIMMYT, that highly contributed to the variance in F2 factor appeared to be genetically dissimilar after cluster analysis. Main while in F3 factor only Sup152-1 and Nd643-2 both from CIMMYT, were retain to highly contribute to the variance with a high genetic dissimilarity among them.
CONCLUSION
The determination of important morphological variables remains primordial in the targeting of genetic characters essential for crop improvement in plant breeding programs. Thus, this study which aimed to identify important morphological characters in wheat lines evaluated in low altitude conditions of the bimodal humid forest zone of Cameroon allowed to observe that, the glossiness (vitreousness) and color of grains were revealed as important variables for breeding purpose and that could directly influence the grain quality of wheat in this study area. Additionally, variables like culm thickness, spike density, plan habit, leaf angle, tiller number, glume color, were revealed to be suitable for wheat breeding programs in this area, with the following wheat lines SST835, Konstrad F2004-1, Kenya2, SST843, SST806, Pfau4, Sup152-1 and Nd643-2 that were observed to possess a high genetic variability and hence could be exploited through molecular technic to further target important genes that could play a pivotal role for crop improvement in Cameroon.
CONFLICT OF INTERESTS
The authors declare that there is no conflict of interest regarding the publication of this paper.
DATA AVAILABILITY
The data analysis used to support the findings of this study and other supplementary images related to this study are available from the corresponding author upon request.
ACKNOWLEDGEMENTS
A special thanks to the MIC-CERES project (Microbial eco-compatible strategies for improving wheat quality traits and rhizospheric soil sustainability), Agropolis Fondation (grant AF project ID 1301-003), investment d’avenir programme (with reference number ANR-10-LABX-0001-01), Fondazione Cariplo (grant FC project ID 2013-1888), Institute of Agricultural Research for Development (IRAD) and University of Yaounde I.
REFERENCES
|
Afuape SO, Okocha PI, Njoku D (2011). Multivariate assessment of the agromorphological variability and yield components among sweet potato (Ipomoea batatas (L.) Lam) landraces. African Journal of Plant Science 5(2):123-132. |
|
|
Ahmadizadeh M, Valizadeh M, Shahbazi H, Zaefizadeh M, Habibpor M (2011). Morphological diversity and interrelationships traits in durum wheat landraces under normal irrigation and drought stress conditions. Advances in Environmental Biology 2011:1934-1941. |
|
|
Ahmadizadeh M, Shahbazi H (2012). Assessment relationship between agro-morphological traits and grain yield in bread wheat genotypes under drought stress condition. African Journal of Biotechnology 11(35):8698-8704. |
|
|
Al-Naggar AMM, Abd El MAEM, El-Shal MH, Anany AH (2020). Molecular Assessment of Genetic Diversity among Egyptian Landraces of Wheat (Triticum aestivum L.) Using Microsatellite Markers. Asian Journal of Biochemistry, Genetics and Molecular Biology 3(4):46-58. |
|
|
Altuhaish AAK, Yahya S (2014). Field adaptation of some introduced wheat (Triticum aestivum L.) Genotypes in two altitudes of tropical agro-ecosystem environment of Indonesia. Hayati Journal of Biosciences 21(1):31-38. |
|
|
Anonyme (2021). |
|
|
Bramel PJ, Hinz PN, Green DE, Shibles RM (1984). Use of principal factor analysis in the study of three stem termination types of soybean. Euphytica 33(2):387-400. |
|
|
Feng W, Cheng FM, Zhang GP (2007). Difference in grain yield and quality among tillers in rice genotypes differing in tillering capacity. Rice Science 14(2):135-140. |
|
|
Food and Agricultural Organisation of the United Nations. |
|
|
Fufa H, Baenziger PS, Beecher BS, Dweikat I, Graybosch RA, Eskridge KM (2005). Comparison of phenotypic and molecular marker-based classifications of hard red winter wheat cultivars. Euphytica 145(1- 2):133-146. |
|
|
Gaines CS, Finney PF, Fleege LM, Andrews LC (1996). Predicting a hardness measurement using the single-kernel characterization system. Cereal chemistry (USA). |
|
|
Harman HH (1976). Modern factor analysis. University of Chicago Press. |
|
|
Okuyama LA, Federizzi LC, Barbosa NJF (2004). Correlation and path analysis of yield and its components and plant traits in wheat. Ciência Rural 34(6):1701-1708. |
|
|
Malik R, Sharma H, Sharma I, Kundu S, Verma A, Sheoran S, Chatrath R (2014). Genetic diversity of agro-morphological characters in Indian wheat varieties using GT biplot. Australian Journal of Crop Science 8(9):1266. |
|
|
Mocauley H, Ramadjita T (2015). Cereal crops: Rice, Maize, Millet, Sorghum, Wheat. pp. 1-36. |
|
|
Mohammadi SA, Prasanna BM (2003). Analysis of genetic diversity in crop plants-salient statistical tools and considerations. Crop Science 43(4):1235-1248. |
|
|
Monneveux P, Reynolds MP, González?Santoyo H, Pena RJ, Mayr L, Zapata F (2004). Relationships between grain yield, flag leaf morphology, carbon isotope discrimination and ash content in irrigated wheat. Journal of Agronomy and Crop Science 190(6):395- 401. |
|
|
Mponda OK, Morse S, Gibbon D, Arthur AE (1997). Genetic studies on seedling vigour in sesame. Annals of Applied Biology 131(1):161- 170. |
|
|
Nassir A (2002). Studies on Genotype X Environment Interactions Variability and Plant Character Correlation in Rice (Doctoral dissertation, PhD Thesis, University of agriculture, Abeokuta, Nigeria). |
|
|
Negassa A, Shiferaw B, Koo J, Sonder K, Smale M, Braun HJ, Payne TS (2013). The potential for wheat production in Africa: analysis of biophysical suitability and economic profitability. |
|
|
Ngo Ngom KA (2017). Évaluation du potentiel génétique des accessions de ble (Triticum aestivum L.) en zone forestière humide a pluviométrie bimodale du Cameroun. Master. UYI. |
|
|
Liu K, Xu H, Liu G, Guan P, Zhou X, Peng H, Du J (2018). QTL mapping of flag leaf-related traits in wheat (Triticum aestivum L.). Theoretical and Applied Genetics 131(4):839-849. |
|
|
Omokhafe KO, Alika JE (1999). Multivariate of agronomic data on Hevea brasiliensis. In Proceeding of SUSANIBS Meeting (pp. 168- 173). |
|
|
PAM, Situation de la securite alimentaire et des marches au Cameroun: Analyse globale de la securite alimentaire et de la vulnerabiliter (CFSVA) Avril-Mai, 2011. |
|
|
Peeters JP, Martinelli JA (1989). Hierarchical cluster analysis as a tool to manage variation in germplasm collections. Theoretical and Applied Genetics 78(1):42-48. |
|
|
Rachovska G, Dimova D, Bojinov B (2002). Application of cluster analysis and principal component analysis for evaluation of common winter wheat genotypes. Proceedings of the Scientific Session of Jubilee pp 68-72. |
|
|
Siahbidi MMP, Aboughadareh AP, Tahmasebi GR, Seyedi A, Jasemi M (2012). Factor analysis of agro-morphological characters in durum wheat (Triticum durum Desf.) lines. International Journal of Agriculture and Crop Sciences 4(23):1758-1762. |
|
|
Singh RK, Chaudhary BK (1979). Biometrical methods in quantitative genetic analysis (P 304). New Delhi: Kalyani Pub. |
|
|
Špani? V, Buerstmayr H, Drezner G (2012). Assessment of genetic diversity of wheat genotypes using microsatellite markers. Periodicum Biologorum, p. 114. |
|
|
Tékeu H, Ngonkeu EM, Djocgoué FP, Ellis A, Lendzemo V, Springfield L, Béna G (2017). Genetic diversity of Cameroonian bread wheat (Triticum aestivum L.) cultivars revealed by microsatellite markers. African Journal of Biotechnology 16(36):1832-1839. |
|
|
Uddin MS, Boerner A (2008). Genetic diversity in hexaploid and tetraploid wheat genotypes using microsatellite markers. Plant Tissue Culture and Biotechnology 18(1):65-73. |
|
|
Wu Li-Li, Liu Zhong-Li, Wang J-M, Zhou C-Y, Chen K-M (2011). Morphological, anatomical, and physiological characteristics involved in development of the large culm trait in rice. Australian Journal of Crop Science 5(11):1356. |
|
|
Yamdjeu A (2012). Données statistiques sur importation exportation des produits de bases. |
|
Copyright © 2024 Author(s) retain the copyright of this article.
This article is published under the terms of the Creative Commons Attribution License 4.0


