Full Length Research Paper

ABSTRACT
The study of genetic diversity of any germplasm helps to facilitate its use and management. This experiment was carried out to determine the genetic diversity among 87 rice accessions from six countries. Seventeen quantitative traits were recorded based on the internationally accepted standard evaluation system for rice from IRRI. Analysis of variance, principal component analysis (PCA) and correlation amongst quantitative traits were carried out. Highly significant (P<0.001) differences were observed among the accessions for all the quantitative traits. The first five principal components accounted for 75.01% of the total genetic variance among the accessions. Some of the morphological traits had significant positive correlations with grain yield. At 21% similarity coefficient, the 87 accessions from six countries were grouped into seven clusters based on the morpho-agronomic traits. Accessions from these seven clusters have tiller number of 10-20, erect culm angle, no awn, 90-120 days to 50% flowering, semi erect flag leaf, well exserted panicle and grain width of 2-3.5 mm respectively. This experiment has proven that morphological markers are effective in assessing genetic diversity in rice. The genetic diversity revealed by the morpho-agronomic traits in this study would be very important in selecting appropriate genotypes for rice improvement in Africa and elsewhere.
Key words: Genetic diversity, morpho-agronomic traits, principal component analysis, rice.
INTRODUCTION
Rice (Oryza sativa) is the third highest produced cereal after wheat and maize (FAOSTAT, 2012). It is the main staple food for about 50% of the world’s population, especially in developing countries (FAO, 2017).
By the year 2025, global demand for rice will be 880 million tonnes compared to the current world production of 470 million tonnes of milled rice (IRRI, 2010). The average growth rate of rice yield was 3.68% annually in the 1980s, but it decreased to 0.75% per year in the late 1990s and rice productions are still low in the world (FAO, 2017). In years to come, expanding the areas of rice cultivation will be limited because of land and water resource scarcity due to climate changes, urbanization and population growth. Pressure from biotic and abiotic factors, declining productivity in intensive rice production systems, increasing the cost of production and low yielding varieties are some of the factors responsible for the low yield of rice obtained by farmers.
Breeding for rice varieties that produces higher yields of grain per unit land area is crucial to achieving increased rice production especially because of reduction in the land available for rice cultivation (Paterson et al., 2005).
The effectiveness of any rice improvement programme depends on the utilization of different germplasm from around the world (Susan et al., 2012). These germplasm can only be utilised optimally by breeders if it is well characterized. Therefore, the objective of this study was to characterize a set of rice germplasm collected from Africa and Asia using agro-morphological traits.
MATERIALS AND METHODS
Plant materials
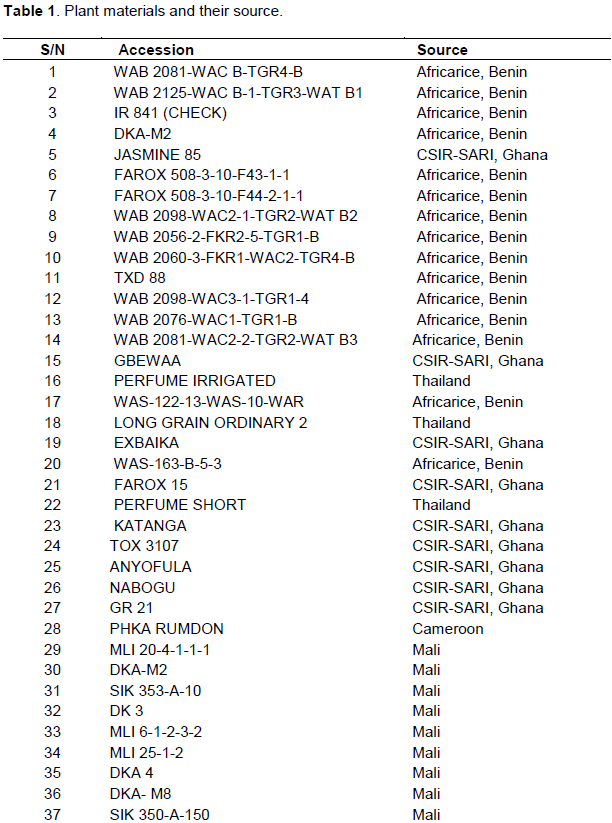
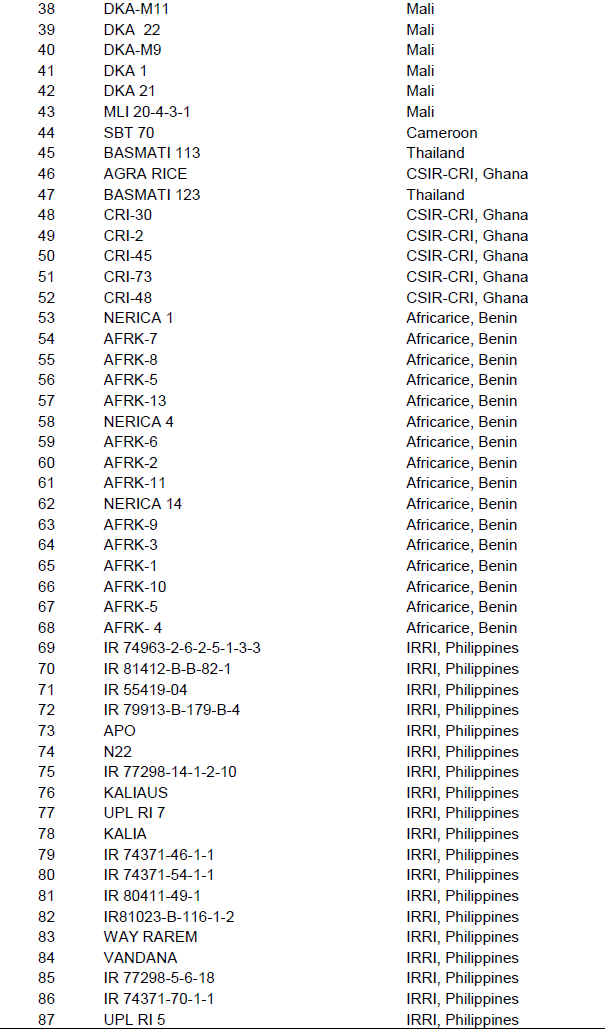
A total of 87 accessions of rice germplasm from Ghana (Crops Research Institute and Savannah Agricultural Research Institute), Thailand, Mali, Benin (Africarice), Cameroon and Philippines (IRRI) were used in this study (Table 1).
METHODOLOGY
Complete randomised design (CRD) with three replications was used. Plastic pots with top and bottom diameters of 30 cm and 18.5cm respectively and also with height of 28 cm were filled with top soil. Twenty one days old seedlings were then transplanted. Five plants per replication of each of the 87 rice accessions were transplanted singly into the plastic pots. Two gram (2 g) of NPK (15:15:15) was applied to each pot three days after transplanting. Urea was applied at tillering and panicle initiation at rate of 1.5 g per pot. Other routine operations like irrigation, application of insecticides and hand weeding in and around the buckets were employed whenever necessary.
Agro-morphological data collection
The standard descriptors developed for rice were used as guide for the data collection. Data on morphological and agronomic traits were collected for the 87 rice accessions studied. The following data were collected during the different growth stages and after harvest. At the early reproductive stage, days to 50% flowering was collected, while, days to 80% grain maturity, leaf length, leaf width, ligule length, flag leaf length, flag leaf width, culm length, culm diameter, tiller number, panicle number, plant height and panicle length were collected at late reproductive stage. After harvest, grain yield per plant, grain length, grain width and 100-grain weight were also collected.
Data analysis
The data collected on 17 quantitative traits were subjected to analysis using GenStat 12th edition package. The package was used to calculate mean, standard error, standard deviation, coefficient of variation (CV), least significant difference (LSD) test at 5% probability and correlation analysis with grain yield as described by Steel and Torrie (1980). NTSYS-pc version 2.21q was used to construct un-weighted pair group method with arithmetic averages (UPGMA) dendrogram to show the distance based relationship among the rice accessions based on the morphological traits (Rohlf, 2002). It was also used to for principal component analysis (PCA) to examine the percentage contribution of each quantitative trait to total genetic variation.
RESULTS
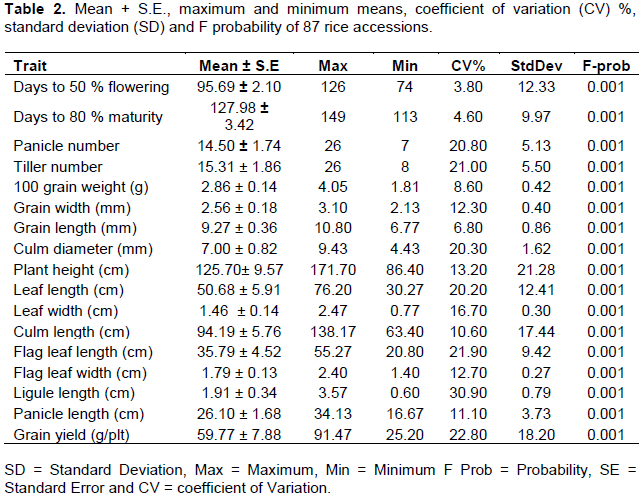
Highly significant (P<0.001) differences were observed among the various quantitative traits analysed (Table 2), indicating that based on morpho-agronomic traits, variation exists among the 87 accessions of rice. The coefficient of variation and standard deviation for days to 50% flowering (heading) were 3.80% and 12.33 respectively. Days to 50% flowering in this study ranged from 74 to 126 days. The minimum days was observed in genotype AFRK-13, while the maximum value was recorded in SIK 353-A10. Coefficient of variation (CV) and standard deviation for days to 80% grain maturity were 4.60% and 9.97 respectively. The minimum days to 80% grain maturity was observed in genotype AFRK-3 (113 days), while SBT 70 had the highest (149 days). Minimum tiller number (8) was produced by genotypes CRI-45 and CRI-2 from the same research institute, while N22 produced the maximum tiller (26) per plant. The standard deviation and coefficient of variation for panicle number were 5.13 and 20.80% respectively. Panicle number per plant among these accessions ranged from 7 to 26. The minimum panicle number per plant (7) was observed with rice genotype CRI-30, FAROX 508-3-10-F43-1-1 produced the maximum panicle per plant (26) followed by EX BAIKA and DKA 21 with 24 each. Standard deviation and CV for panicle length were 3.73 and 11.10% respectively. The maximum panicle length was in DKA-M2 (34.13 cm) followed by CRI-73, while KALIA (16.67 cm) recorded the minimum. The analysis revealed plant height of 125.70 cm as grand mean with a standard error of 9.57, coefficient of variation of 13.20% and standard deviation of 21.28. The minimum plant height was associated with accession AFRK-10 (86.40cm) and AGRA RICE (171.70cm) had the maximum. Grand mean of 2.86g was obtained for 100 grain weight for the genotypes with means which ranging from 1.80-14.50g. CRI-2 had the maximum 100 grain weight and N22 the minimum. The CV for grain length and width were, 6.80% and 12.30% respectively. The CV and standard deviation for flag leaf length were recorded as 21.90% and 9.42 respectively with a mean of 35.79cm (Table 2).
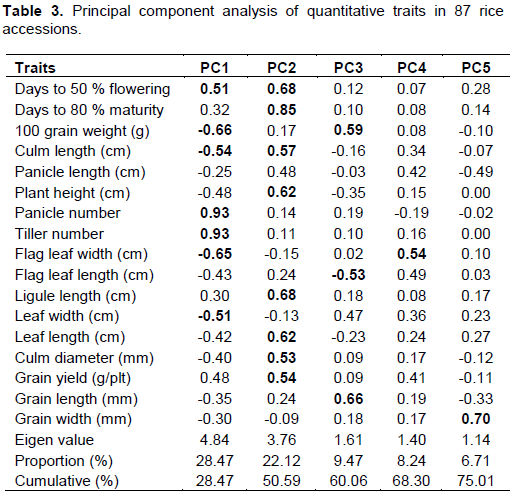
Principal component analysis grouped the 17 quantitative traits collected into 10 components. The first five components, with eigen values higher than 1.0, accounted for 75.01% of the total variance with PC1 explaining 28.47% (Table 3) of the total variation. Based on eigen vectors with values greater than or equal to 0.50, traits such as days to 50% flowering, 100 grain weight, culm length, panicle number, tiller number, flag leaf width and leaf width were the major discriminatory characters associated with the first PC while days to 50% flowering, days to 80% maturity, culm length, plant height, ligule length, leaf length, culm diameter and grain yield were associated with the second PC, which accounted for 22.12% of the total variation. The third PC which explained 9.47% of the total variation was dominated by 100 grain weight, flag leaf length and grain length while flag leaf width dominated the forth PC. Grain width dominated the fifth PC that accounted for 6.71% of the total variation (Table 3).
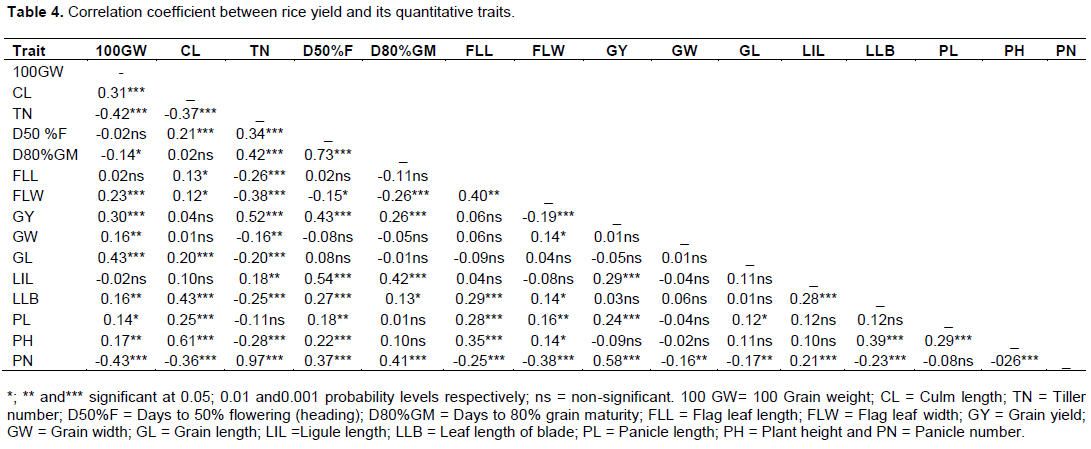
Correlation analyses of 15 quantitative traits collected during this study are presented in Table 4. Seven (panicle number, days to 50% flowering, days to 80% grain maturity, tiller number, panicle length, ligule length and 100 grain weight) of these quantitative traits showed significant positive relationship with rice grain yield per plant, one (flag leaf width) showed significant negative correlation with grain yield per plant, while four (leaf length of blade, grain width, flag leaf length and culm length) had non-significant positive association with grain yield per plant and two (grain length and plant height) showed non-significant negative correlation with rice grain yield per plant. For quantitative traits with significant and positive correlation with grain yield per plant, it means that any increase in these quantitative traits resulted into increase in grain yield. Increase in tiller number resulted into increase in the grain yield as significant and positive correlation existed between the two traits (Table 4).
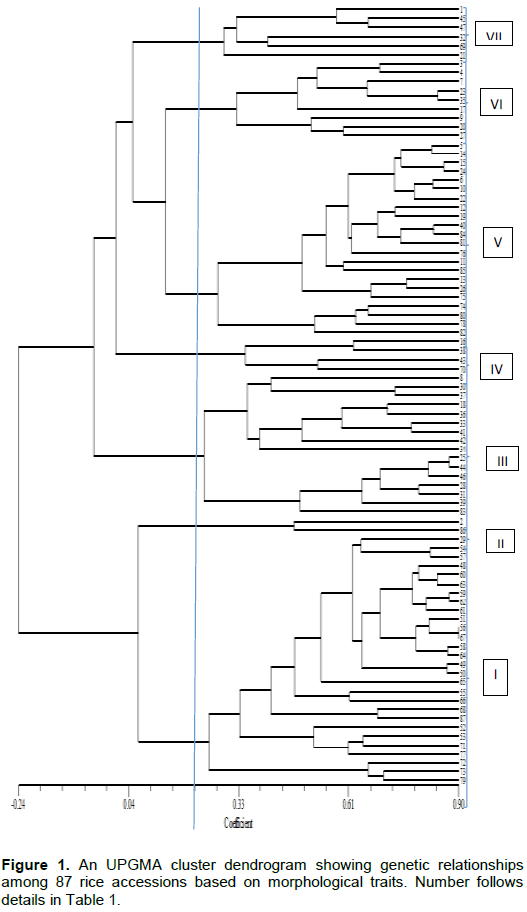
Genetic relationship revealed by morpho-agronomic traits using similarity coefficients based on unweighted pair group method with arithmetic mean (UPGMA) is shown in Figure 1. The 87 rice accessions were clustered into seven major groups at 21% similarity coefficient. Cluster I contained 28 accessions from Ghana, Philippines, Benin and Mali. These accessions have tiller number that ranged from 10-20 and their days to 80% grain maturity also ranged from 100-130 days in this study. For Cluster II, two accessions (WAB 2125-WAC B-1-TGR3-WAT B1) and (IR 74371-70-1-1) from Benin and Philippines respectively and WAB 2125-WAC B-1-TGR3-WAT B1 and IR 74371-70-1-1 are accessions that have green basal leaf sheath colour, erect culm angle, medium green leaf blade; intensity of green colour, just exserted panicle and absence of awns. Cluster III contained sixteen accessions from all the six countries. These 16 accessions have characteristics such as no awn on their grains, tiller number of 10-23, height of 130-160 cm and panicle number of 10-20. Cluster IV contained four accessions from Mali, Thailand and Philippines. These four accessions included DKA-M11, MLI 20-4-3-1, PERFUME IRRIGATED and IR 81412-B-B-82-1; they are accessions with also no awn, green basal leaf sheath colour, 90-120 days to 50% flowering. Cluster V contained 22 accessions which have erect and semi erect flag leaf. The sixth cluster contains nine accessions from Mali, Ghana and Benin. These nine accessions are characterised by erect flag leaf, moderately well exserted panicle and whitish ligule colour. Cluster seven contains six accessions that have no awn and their grain width ranged from 2.00-3.50mm. Furthermore, at 39% similarity coefficient, the seven major clusters, except cluster II were divided into sub-clusters. Cluster I (IA, IB and IC), cluster III (IIIA, IIIB, IIIC and IIID), cluster IV (IVA and IVB), cluster V (VA and VB), cluster VI (VIA and VIB) and cluster VII (VIIA, VIIB and VIIC). At 90% similarity coefficient, only accession 56 (AFRK-5) and 67 (AFRK-5) both from Benin (AfricaRice) showed similarity as suggested by their same name (Figure 1).
DISCUSSION
The major goals of rice breeding programmes around the world is to breed for high yield potential, preferred grain quality, and tolerance to abiotic and biotic stresses. These goals can only be achieved when there is sufficient genetic variability within the germplasm available to the Breeder. In order to achieve their breeding goals, Breeders commonly exchange germplasm within and outside their countries. In this study, a set rice germplasm from various countries, which are being kept by the Council for Scientific and Industrial Research, Ghana were characterized in order to be able to make effective use of them.
Analysis of variance
Differences among the accessions were highly significant (P<0.001) for tiller number. This finding is supported by Pachauri et al. (2017). Tiller number per plant is an important component of yield in rice and mostly attracts breeders for selection as it correlates positively with grain yield (Table 4). Too few tillers result into too few panicles as they are directly related. In rice, the genetic manipulation of tiller number is important to obtain high grain yield, but the physiological basis of the regulation of tiller growth remains unclear (Efisue et al., 2014).
Variability among the accessions was also highly significant (P<0.001) for panicle number based on the data analysis (Table 2). This result is in agreement with earlier findings of Efendi et al. (2015); they studied genotypes of rice and reported highly significant variation for various morphological traits including number of panicles per plant. Similar findings were also reported by Ahmed et al. (2016); they concluded that genetic variation was responsible for the significant differences. This trait is an important yield component in rice and correlates positively with grain yield (Khan et al., 2009). The panicle number with filled grain determines the yield outcome of the crop. Thus, effective panicles should be once with high ripening percentage and high grain to straw ratio (Harvest Index) for selection by breeders (Efisue et al., 2014).
Analysis of variance for plant height was found to be highly significant (P<0.001) among the various accessions studied. This result is in conformity with those of Sarawgi et al. (2013). Hussain et al. (2005) found that planting and sowing methods, transplanting date and soil condition affect plant height in rice. Pachauri et al. (2017) studied genotypes of rice and reported high heritability and genetic advance for this trait. Reduction of plant height in rice may improve its resistance to lodging and eventually reduces yield loses due to this condition (lodging).
Highly significant genetic variation (P<0.001) observed among the accessions for days to 50% flowering in this study and is similar to those previously reported by Solis et al. (2015), they observed variation in days to flowering of several genotypes and identified a regulatory gene responsible for variation in this physiological trait among rice genotypes. Variation among accessions for this quantitative trait might be due to the genetic makeup of the accession or interaction with the environment. The availability of early flowering and maturing genotypes are important for the avoidance of drought condition.
A highly significant variation was also found among the studied genotypes for days to maturity. Umarani et al. (2017) studying genotypes of rice for variability and genetic parameter analysis reported that, the variation within the genotypes for days to maturity was due to genetic makeup rather than environmental conditions. Short duration crops are important to breeders for use as parents in crop improvement.
Principle component analysis
In genetic diversity studies using morphological traits, the most important variables describing phenotypic variation are defined by principal component (PC) analysis. Diversity studies using principal component analysis have been carried out in rice by several authors to understand and prioritize the most essential traits that explain much of the variability among the studied accessions (Solis et al., 2015). The PC analysis in this study showed that 75.01% of the total genetic variance was accounted for by the first five principal components taking into account all the 17 quantitative traits studied. The total genetic variance of 75.01% by the first five components in this study was higher than what previously reported by Bozokalfa et al. (2009) who accessed genetic variation among 434 landraces. In the present study, it can be deduced that days to 50% flowering, 100 grain weight, culm length, panicle number, tiller number, leaf width, days to 80% maturity, plant height, ligule length, leaf length, culm diameter, grain yield, grain length, flag leaf width and grain width were the most important traits which accounted for much of the variability among the rice genotypes. These findings agree with Ahmed et al. (2016).
Correlation analysis
Correlation analyses revealed that, out of the 14 morphological and agronomic characters only 100 grain weight, tiller number, days to 50% flowering, panicle number, days to 80% grain maturity, ligule length and panicle length showed significant positive association with grain yield. This suggests that they could be used to predict grain yield. Karine et al. (2014) in studying lines of rice genotypes reported similar significant positive correlation of panicle length and total tiller number with grain yield. The significant positive correlation of 100 grain weight with grain yield is in agreement with the earlier findings of Efendi et al. (2015). Also, the significant positive relation between grain yield and panicle number are in conformity with the findings of Sarawgi et al. (2013). The results obtained in this study regarding significant positive relationship of grain yield with days to 50% flowering and 80% grain maturity are contrary to the findings of Ashfaq et al. (2012), they revealed non-significant positive relation for these two traits with rice grain yield, while Maji and Shaibu (2012) also reported non-significant positive correlation between ligule length and grain yield. The contrary result obtained in this study may be due to the variation in genotype or genotype by environment interaction. Traits that had significant positive correlation with grain yield would be ideal for selection to improve rice grain yield. Regarding plant height, non-significant negative association was obtained with grain yield. Sarawgi et al. (2013) reported similar results. Hairmansis et al. (2010) studying agronomic characters and grain yield also reported similar results. Mohaddesi et al. (2010) obtained significant positive correlation of plant height with grain yield. These differences in result might be due to the genotypes or interaction with environment. According to Karine et al. (2014), high yielding types of rice should be of short stature. The non-significant positive association between grain yield and grain width in this study are in conformity with earlier findings of Mirhoseini et al. (2013).
Cluster analysis
Cluster analysis is very useful in revealing complex relationships among populations of diverse origins in a more simplified manner. It is also effective in indicating accessions with useful traits belonging to different clusters for hybridization. The 87 accessions from six countries in the study were classified into seven main clusters at a similarity coefficient of 0.21 based on morphological traits, which is an indication of genetic variation among the accessions. The variation observed among the accessions suggested that morphological traits can reveal diversity existing among rice accessions. This is in agreement with earlier findings of Efisue et al. (2014), they reported that morphological traits can discriminate between rice accessions.
Results obtained in this study indicate that highly significant variation exist among the accessions based on the various morphological and agronomic traits. The germplasm would therefore be a useful source of genes for development of improved rice varieties.
CONFLICT OF INTERESTS
The authors have not declared any conflict of interests.
REFERENCES
|
Ahmed MSU, Bashari M, Wazuddin M, Shamsuddin (2016). Agro-morphological characterization of Jesso-Balam rice (Oryza sativa L.) accessions in Bangladesh. International Journal of Agronomy and Agricultural Research 8(1):50-58. |
|
|
Ashfaq M, Khan AS, Khan SHU, Ahmad R (2012). Association of various morphological traits with yield and genetic divergence in rice (Oryza sativa L.). International Journal of Agriculture and Biology 14(1):201-231. |
|
|
Bozokalfa MK, EÅŸiyok D, Turhan K (2009). Patterns of phenotypic variation in a germplasm collection of rice (Capsicum annuum) from Turkey. Spanish Journal of Agricultural Research 7(1):83-95. |
|
|
Efendi, Kesumawaty E, Zakaria S, Bakhtiar, Syafruddin (2015). Morph-agronomic performance of rice (Oryza sativa L.) landraces under organic cultivation of SRI methods. International Journal of Agricultural Research 10(2):74-82. |
|
|
Efisue AA, Umunna BC, Orluchukwu JA (2014). Effect of yield components on yield potential of some lowland rice (Oryza sativa L.) in coastal region of Southern Nigeria. Journal of plant Breeding and Crop Science 6(9):119-127. |
|
|
Food and Agricultural Organisation (FAO) (2017). Rice information. Food and Agricultural Organisation of the United Nations, Rome, Italy 19(2):20-27. |
|
|
FAOSTAT (2012). Food and Agricultural Organization of the United Nations, Rome Italy, Statistical Data Base. |
|
|
Hairmansis A, Kustianto B, Supartopo F, Suwarno S (2010). Correlation analysis of agronomic characters and grain yield of rice for tidal swamp areas. Indonessian Journal of Agricultural Science 11(1):11-15. |
|
|
Hussain SM, Ramzan M, Aslam ZM, Ehsan SM (2005). Effect of various stand establishment method on yield and yield components of rice. Proceeding of the International seminar on rice crop, Rice Research Institute, 2-3 October, 2005, Kala Shah Kau Pakistan. |
|
|
IRRI (2010). Annual Report for 2009. International Rice Research Institute, Los Banos, Laguna, Philippines pp 179-181. |
|
|
Karine M, Champlain DL, Noel MFM, Zephirin T, Alain NP, Zephyrin F, Genevieve B, Noe W (2014). Agro-morphological characterization of two rice (Oryza sativa L.) varieties from Japan and four NERICA varieties in an agro-ecological zone of the town of Younde (Cameroon), comparative study of their performance. International Journal of Current Research 6(11):9941-9946. |
|
|
Khan AS, Imran M, Ashfaq M (2009). Estimation of genetic variability and correlation for grain yield components in rice (Oryza sativa L.). Amercian-Eurasian Journal of Agriculture and Environmental Science 6(5):585-590. |
|
|
Maji AT, Shaibu AA (2012). Application of principal component analysis for rice germplasm characterization and evaluation. Journal of Plant Breed of Crop Science 4(6):87-93. |
|
|
Mirhoseini SM, Daliri MS, Moghaddam MN, Mohaddesi A, Abbasian A (2013). Study of agronomic traits in a number of promising rice lines by multivariate statistical methods. International Journal of Bioscience 3(7):119-125. |
|
|
Mohaddesi A, Abbasian A, Bakhshipoor S, Mohammad SM (2010). Study of effects of nitrogen fertilizer and planting distance on yield and yield components of promising rice line. Journal of Crop Ecophysiology 2(3):198-203. |
|
|
Pachauri AK, Sarawgi AK, Bhandarkar S, Ojha GC (2017). Agro-morphological characterization and morphological based genetic diversity of rice (Oryza sativa L.) germplasm. Journal of Pharmacognosy and Phytochemistry 6(6):75-80. |
|
|
Paterson AH, Freeling M, Sasaki T (2005). Grains of knowledge: Genomics of model cereals. Genome Research 15:1643-1650. |
|
|
Rohlf FJ (2002). NTSYS-pc: Numerical taxonomy and multivariate analysis system. Exeter Software, Setaukes, New York, USA. |
|
|
Sarawgi AK, Subba RLV, Parikh M, Sharma B, Ojha GC (2013). Assessment of variability of rice (Oryza sativa L.) germplasm using morphological characters. Journal of Rice Research 6(1):14-28. |
|
|
Solis SHD, Rivera RM, David DL, Alvarez (2015). Morpho-agronomic evaluation of traditional rice cultivars (Oryza sativa L.) collected in growers farm from Pinar Del Rio province. Cuitivos Tropical 36(2):131-141 |
|
|
Steel RGD, Torrie JH (1980). Principles and procedure of statistics. McGraw Hill Book Inc. New York 137-167. |
|
|
Susan RM, Kenneth LM, Wen W, Ruaraidh SH (2012). Genomics of gene banks: A case study in rice. American Journal of Botany 99(2):407-423. |
|
|
Umarani E, Radhika K, Padma V, Subbarao LV (2017). Agro-morphological characterization of rice (Oryza sativa L.) landraces based on DUS descriptors. International Journal of Pure and Applied Biosciences 5(4):466-475. |
|
Copyright © 2024 Author(s) retain the copyright of this article.
This article is published under the terms of the Creative Commons Attribution License 4.0


