Full Length Research Paper

ABSTRACT
The biennial bearing and the long productive nature of coffee makes it difficult to release coffee variety within a short time span. This study aimed at evaluating the yield performance of the Arabusta hybrids and its backcrosses developed by Coffee Research Institute of the Kenya Agricultural and Livestock Research Organization (KALRO-CRI) using the morphological traits. Nineteen coffee genotypes were evaluated at Siaya ATC and KALRO-Alupe using randomized complete block design with three replications and the morphological data for growth and yield was recorded during the year 2018. The results indicated that there was significant difference in yield among the coffee genotypes and between the sites. Yield had positive significant associations with parentage berries per node (r= 0.61), berries on the longest primary (r= 0.58) and berries per node on the longest primary(r=0.60). The genotypic coefficient of variation (GCV) values for the morphological traits varied from 6.50 to 31.01%. Broad sense heritability ranged from 0.15 to 0.61 with bean yield recording heritability of 0.31. The number of berries on the longest primary had high broad sense heritability and high genetic advance indicating the presence of additive genes that can be used in coffee improvement through selection.
Key words: Environment, Genetic advance, Robusta, Response, Selection, Variation
INTRODUCTION
The world coffee production increased in the year 2018/2019 to 168.77 million bags which is 1.6% higher higher than the year 2017/2018. From the coffee produced, 109.41 million bags were exported and these exports also were higher by 10.2% when compared to the year 2017/2018. Both Robusta and Arabica coffee exports increased during the year 2018/2019 and from the total exports, 64% was Arabica coffee while 36% was Robusta coffee (ICO, 2019b). Coffee in Kenya is the fourth most important source of foreign earnings of US$230 million, after horticulture, tourism and tea supporting livelihoods of about 800,000 farmers. An estimate of 80% of Kenya’s workforce are being engaged in agriculture either directly or indirectly with about 30% employed in the coffee industry (ICO, 2019a). Over 90% of the total Kenyan coffee acreage is under Arabica coffee (Coffea arabica L.), while the rest is occupied by Robusta coffee (Coffea canephora Pierri) (Omondi et al., 2001). However, the performance of coffee in Kenya has been declining since the 1980’s where the total production was about 1.7 million bags to the current annual production of 900,000 bags (Karanja and Nyoro, 2002, ICO, 2019a) This has been due to increased cost of production, pests and diseases as well as increased population within urban centers which has paved way of agricultural land under coffee for housing.
Kenya has developed interspecific hybrids between tetraploid Robusta and Arabica coffee termed as Arabusta hybrids. The expectation is to generate a high yielding coffee variety that is disease resistant and with good cup quality coffee that outperforms Robusta coffee and also adapted to low altitude zones which include areas around the Lake Victoria region and lower coastal regions. The backcrosses were carried out for introgression of diseases resistant genes to Arabica coffee which is susceptible to coffee berry disease. Coffee is a biennial crop and because of its productive nature, one generational cycle takes 8 years. This makes it difficult to breed for a variety within a short time span since it may take up to 30 years for release. It is therefore important to identify genotypes with good growth characters that relate positively to increased yield during the early years of production in order to reduce the time span during selection and minimize resources. Growth and yield characters have been shown to have an influence on yield stability in coffee as it has been in a number of other crops (Gichimu and Omondi, 2010).
Assessing the variation of quantitative traits during selection is important to ensure a successful breeding program since it is key to determining the response to selection due to genetic diversity. The genotypic and phenotypic coefficients of variation have been used in breeding in identifying variation found within genotypes (Solomon et al., 2009). Heritability indicates the effectiveness in selection based on phenotypic performances of genotypes. The usefulness of heritability therefore increases when it is combined together with high genetic advance which indicates the degree of gain of a trait during selection (Dyulgerova and Valcheva, 2014). This will provide an indication on the genetic improvement required in maximizing the potential of a specific genotype (Weldemichael et al., 2017). Measuring heritability guides in predicting the breeding value of a phenotype (Tazeen et al., 2009).
Various studies on Ethiopian coffee by Yigzaw (2005) and Atinafu et al. (2017) have shown high heritability on morphological traits including hundred bean weight, number of secondary branches, plant height, internode length and number of primary branches. The genetic correlation, which is the proportion of variance that two traits share due to genetic causes, is useful in studying the genetic relationships among traits under selection (Anim-Kwapong and Adomako, 2010). The study is aimed at identifying growth and yield traits that correlate highly with yield having genetic variation in terms of high heritability and genetic advance for selection of best performing genotypes.
MATERIALS AND METHODS
Experimental materials
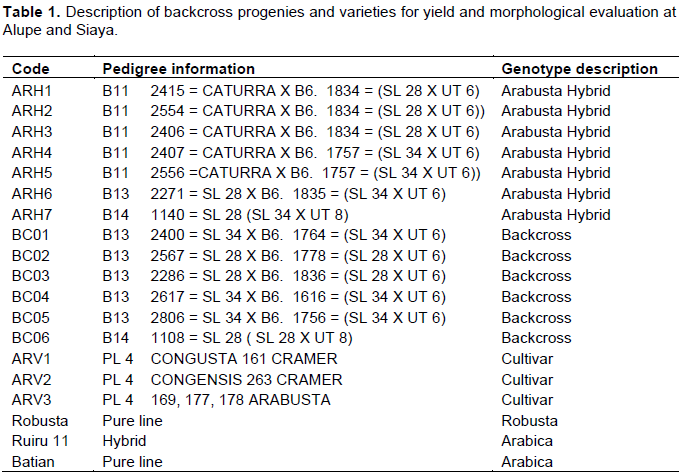
Nineteen materials including seven Arabusta hybrids, and six different backcross derivatives of Arabica to Arabusta hybrids were evaluated together with the three Arabusta varieties, Robusta, C. arabica (Batian) and C. arabica (Ruiru 11) as shown in Table 1.
Description of the experimental site and design
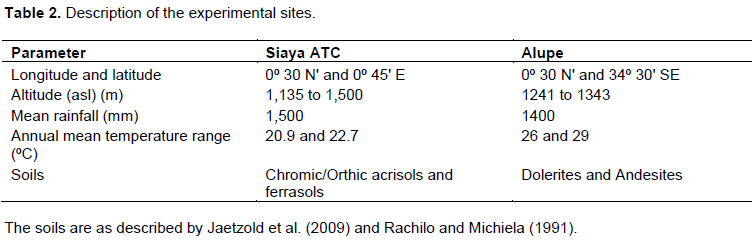
The trials were laid down in Siaya ATC (Siaya County) and Alupe (Busia County) in the year 2015 (Table 2). The experiment was laid out in a Randomized Complete Block Design (RCBD) with three replications in KALRO-Alupe and Siaya ATC. Five coffee trees were planted per genotype with a spacing of 3 m × 3 m per plot measuring 855 m2 and all recommended agricultural practices were applied. Data on growth and yield parameters were collected and recorded during the third year after establishment.
Growth parameter measurements
The growth and yield parameters were recorded as described by Walyaro (1983). They include:
(i) Percentage of berries per node. The bearing nodes with berries, flowers or flower buds were counted and expressed as percentage of the total number of nodes on the same tree and this was collected from five trees per plot.
(ii) Total number of berries on the three longest primaries and the mean was derived.
iii) Number of bearing primaries, recorded as the total number of primaries carrying berries, flowers or flower buds from five trees per plot.
(iv) Number of berries per node, was obtained as the mean number of berries per node on the selected four primaries from five trees per plot.
(v) Tree height was recorded as length from base to the tip of the tree (cm) from five trees per plot and mean calculated.
(vi) Total number of laterals (number of secondary branches). This was derived by counting all lateral per tree from the five trees per plot and the mean calculated.
(vii) Length of the longest primary was measured from the five trees per plot and mean calculated.
(viii) Number of berries on the highest bearing node from the longest primaries derived from the five trees per plot.
(ix) Number of bearing nodes on the longest primaries from five trees per plot.
x) Mean of number of primaries from five trees per plot.
(xi) Mean of 100 berry weight (g) from five trees per plot.
(xii) The red ripe cherry was harvested during peak harvesting period of May to July and from September to November in 2017 and 2018. The cherry from five trees of each genotype per replication bulked weighed and yield data, which is the weight of the cherry in grams, was recorded and expressed in grams per tree.
Statistical analysis
The yield and growth characters’ data was subjected to Analysis of Variance (ANOVA) using GENSTAT statistical software and effects declared at 5% significant level General Linear Model (GLM) was used (Jansen, 1993). Least significance difference (LSD) was used to separate the means (Martin et al., 1978). Separate as well as combined analysis of variance was performed on data from the two sites. The correlation was calculated to show the relationship between growth and yield characters using the Pearson’s Correlation Coefficient. Genotypic and phenotypic variances were calculated using the formula by Baye (2002) as follows
(i) Genotypic variance, GV = (MSg – MSe) / r, where MSg = mean square of genotypes, MSe = mean square of error, and r = number of replications.
(ii) Phenotypic variance, PV = GV + MSe, where GV = genotypic variance and MSe = mean square of error.
Phenotypic and genotypic coefficient of variation as suggested by Singh and Chaudhary (1985) can be calculated as
(i) Phenotypic coefficient of variation, PCV = (PV/X) × 100, where PV = phenotypic variance and X = mean of the character.
(ii) Genotypic coefficient of variation, GCV = (GV/X) × 100, where GV = genotypic variance and X = mean of the character.
Heritability (broad sense heritability) was calculated as suggested by Falconer (1989) using H = GV/PV, where GV = genotypic variance and PV = phenotypic variance; also, Genetic advance (GA) expected and GA as percent of the mean assuming selection of the superior 5% of the genotypes was estimated as per Assefa et al. (1999)
GA = K × (PV/X) × H
GA (as % of the mean) = (GA/X) × 100, where K is a constant (which varies depending upon the selection intensity and, if the latter is 20%, stands at 1.40), PV/X is phenotypic standard deviation, H is heritability and X refers to mean of the character being evaluated. Expected response to selection (Re) was estimated as (2)  where i = 1.40 at 20% selection intensity, Vp = phenotypic variance for a trait, and h2 = broad-sense heritability for a specific trait (Singh and Chaudhary, 1985).
RESULTS
Growth and yield traits
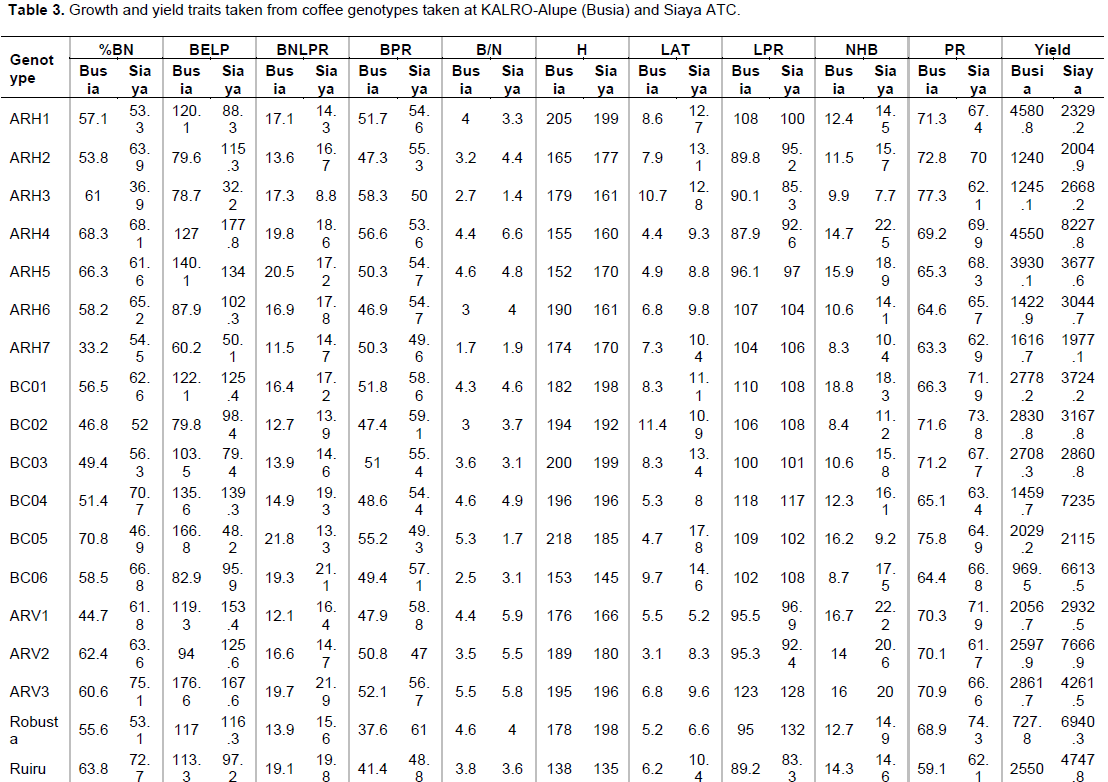
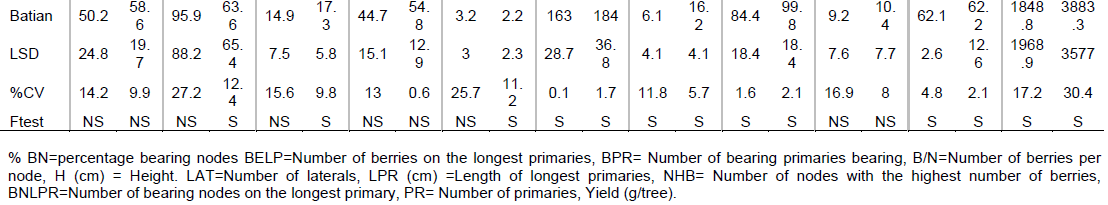
There was variation amongst the coffee genotypes with regard to the growth and yield traits recorded at Busia and Siaya over the two-year period. The berries on the longest primary were significantly (P≤0.05) different amongst the genotypes at Siaya where genotype BC05 recorded 22 berries while genotype ARV1 recorded 12 berries (Table 3). There was significant (P≤0.05) difference on berries per node on the longest primary where in Siaya ARV3 recorded the highest number (22) while genotype ARH3 recorded the least (9). In Siaya, berries per node was significantly (P≤0.05) different amongst the genotypes varying from one to six berries where genotype AVR1 recorded largest number and genotype ARH3 recorded the least. The height ranged from 135 to 217.7 cm in both sites where the genotype Ruiru 11 recorded the shortest plants at both sites while BC05 recorded high values at Busia compared to other genotypes (Table 3). The yield varied in the two sites ranging from 728 to 4580 g/tree in Busia, while in Siaya it ranged from 2005 to 8227 g/tree.
Correlation
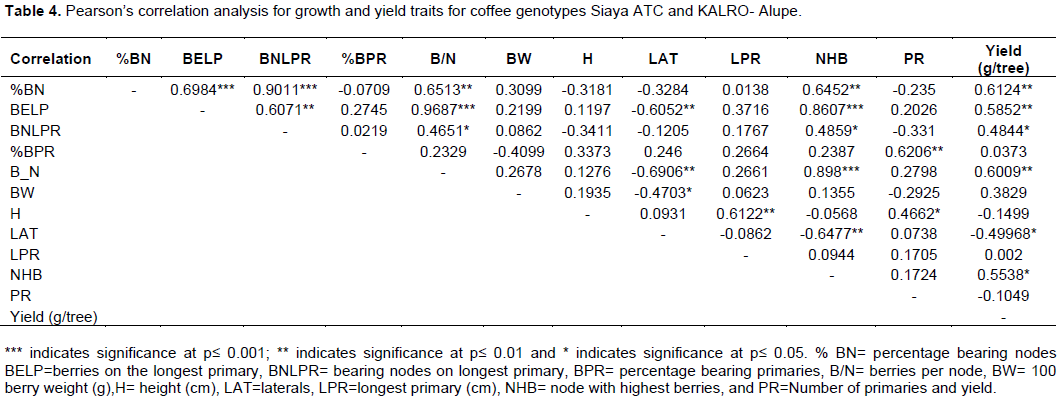
The correlation coefficients amongst the twelve different traits were measured for both sites from combined mean analysis. The percentage berries per node had significant positive correlations with berries on the longest primary=0.69), berries per node on the longest primary (r=0.90), berries per node (r=0.65), nodes with highest number of berries (r=0.64) and yield (r=0.61) (Table 4). Berries on the longest primary had positive significant associations with berries per node (r=0.46), nodes with highest number of berries (r=0.48) and yield (r=0.48) (Table 4). All traits except 100 berry weight, berries per node, longest primary, and total number of primaries showed significant positive correlations with yield. Longest primaries showed positive associations to nodes with highest number of berries, total number of primaries and yield although they were not significant.
Yield performance
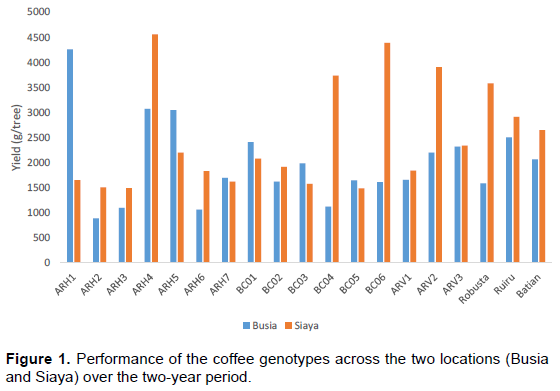
The genotypes performed significantly (P≤0.05) different from each other. ARH1 was the best performing genotype in Busia followed closely by ARH4 and ARH5. In Siaya, the best performing genotypes were genotype ARH4, followed closely by genotypes BC06, ARV2 and BC04. Production in Siaya was high when compared to Busia. (Figure 1) and genotypes ARH2 and ARH3 performed poorly in Busia and Siaya respectively.
Genotypic and phenotypic parameters
Estimation of the genotypic and phenotypic variances was calculated and this showed that the coffee genotypes evaluated expressed different level of variations in the morphological traits measured. Genotypic coefficient of variation (GCV) varied between the morphological traits the values scored varying from 6.50 to 31.01%. The trait with high GCV value was berries on the longest primary with 31.01%, followed closely by total number of laterals with 30.58% and berries per node scoring 29.79%. The values scored for the phenotypic coefficient of variation (PCV) ranged between 11.03 to 70.51% with yield scoring the highest value (Table 5)
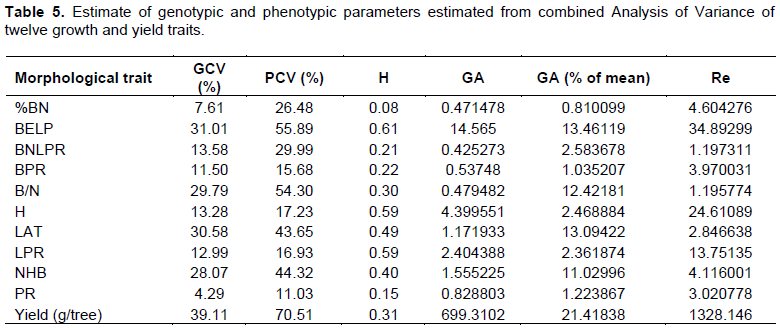
On genetic advance (GA), yield scored a higher value of 699.3 and berries per node on the longest primary recorded the least with 0.42. The percentage mean of GA varied from 0.8 to 21.42%, yield (g/tree) scoring the highest percentage while the percentage berries per node scored the least. The broad sense heritability (H) was calculated for the morphological traits measured in the experiment. The values for the broad sense heritability ranged from 0.15 to 0.61 within the traits. The morphological traits that showed a higher broad sense heritability (>0.50) were berries on the longest primary, length of longest primary and height which scored 0.61, 0.59 and 0.59 respectively (Table 5). The percentage berries per node scored a low broad sense heritability of 0.008, yield had the highest value on response to selection of 1328.14 while berries per node was the least with 1.196.
DISCUSSION
ANOVA showed that there was significant (p<0.05) differences amongst the growth and yield traits for the 19 coffee genotypes assessed except for percentage berries per node, number of bearing primaries and total number of primaries. The variability within the genotypes in terms of the growth traits is important for an efficient selection of coffee genotypes thus the possibility of improvement through selection and crossing. The selection efficiency for yield can be enhanced by considering various growth parameters and components of yield, such as, percentage of bearing nodes, number of berries per node and percentage of bearing primaries as reported by Van der Vossen (1985). This can be confirmed by the results of this study whereby the site where higher number of bearing primaries, berries on the longest primaries,berries per node on the longest primary, berries per node and laterals lead to increased yield. Arabusta hybrids ARH4 were the best performing genotype across the two locations. The result of the study is in agreement with those of Gichimu and Omondi (2010), who reported significant phenotypic variations with the use of the different quantitative characters in coffee and Olika et al. (2011) who also observed variations amongst the longest primaries, bearing nodes, height, number of laterals, yield (g/tree), bearing nodes, berries per node among other traits.
There was a significant positive correlation between yield and percentage berries per node, berries on the longest primary, berries per node on the longest primary, berries per node and nodes with highest number of berries. The traits that associated positively and significantly with that associated positively and significantly with yield can be used in indirect selection for yield, thus allowing efficiency in selection. The selection of potentially superior genotypes can be done by disregarding the undesirable genotypes early during evaluation reducing the time and resources in breeding. The traits that showed negative associations can impede the indirect selection gains for yield. The results agree with those of Gichimu and Omondi (2010) who reported a highly significant correlation between the number of berries and bearing primaries, nodes on bearing primaries and bearing nodes. The significant and negative correlation observed in the study between yield and laterals was also reported by Olika et al. (2011), however Dessalegn (2005) reported that except for the number of primary branches almost all the characters measured showed positive phenotypic correlations.
The traits with a higher GCV and PCV value (>20%) were, berries on the longest primary, berries per node, total number of laterals, nodes with high number of berries, and yield (g/tree). These values indicate that there exists a wide genetic variation within the genotypes that affects their phenotypic performance. The traits with medium GCV and PCV value (10-20%) were, number of berries on the longest primary, height and the length of the longest primary. There were high GCV and PCV values for yield indicating that there was a high environmental variation. The low GCV values for most traits could have resulted from the varying environmental conditions. Berries on the longest primary, total number of lateral, nodes with high number of berries and yield had a higher mean percentage of GA, the same observation as reported by Olika et al. (2011) and Bayetta (2007). Malau and Pandiagan (2018) also reported low to moderate GA for most of the plant vigor and yield traits
The quantitative traits with high heritability (>50%) were height, berries on the longest primary and number of longest primary while the rest had heritability values less than 50%. High heritability and low genetic advance observed implies that apart from the environmental effects, the additive and non-additive genes also contributed to trait expression (Abate et al., 2015). There was narrow gap between the GCV and PCV values for traits with high heritability, implying that the influence by the environment was minimal thus the high heritability expressed (Getachew et al, 2017). Traits with lower heritability are controlled by more genes, which in turn complicate the selection process by slowing it down (Sousa et al., 2019). The results indicate that the berries on the longest primary and the total number of longest primaries which also correlated highly with yield can be used in selection for yield. Similar findings on heritability were reported by Bayetta (2001) and Dessalegn (2005) who found the high heritability on height (0.59), however, Beksisa and Ayono (2016) reported low heritability on plant height. Kebede and Bellachew (2005) reported high broad sense heritability and Getachew et al. (2013) reported moderate heritability for all the traits respectively.
CONCLUSION
For an effective selection, the use of heritability and genetic advance is key to determining the degree of genetic gain from selection of a trait. The selection efficiency for yield can be obtained by identifying traits that exhibit high GA and heritability and also show positive correlations with yield. The variation within the traits means that there is possibility of maximizing on gains during crop improvement. Total number of berries on the longest primary, number of bearing primaries, berries per node and laterals can be utilized well during early selection for yield.
CONFLICT OF INTERESTS
The authors have not declared any conflict of interests.
ACKNOWLEDGMENTS
The authors appreciate the director general- KALRO for sponsoring the researcher’s studies at the University of Nairobi as well as staff at the Coffee Breeding Unit for support during establishment of trials and data collection.
REFERENCES
|
Abate TB, Shiferaw A, Menkir D, Wegary Y, Kebede K, Tesfaye M, Kassie G, Bogale BT, Keno T (2015). Factors that transformed maize productivity in Ethiopia. Food Security 7(5):965-981. |
|
|
Anim-Kwapong E, Adomako B (2010). Genetic and environmental correlations between bean yield and agronomic traits in Coffea canephora. Journal of Plant Breeding Crop Science 2(4):64-72. |
|
|
Assefa K, Ketema S, Tefera H, Nguyen HT, Blum A, Ayele M, Bai G, Simane B, Kefyalew T (1999). Diversity among germplasm lines of the Ethiopian cereal tef (Eragrostis tef (Zucc.) Trotter). Euphytica 106:87-97. |
|
|
Atinafu G, Hussien M, Kufa T (2017). Genetic Variability of Sidama Coffee (Coffea Arabica L.) Landrace for Agro-morphological Traits at Awada, Southern Ethiopia 5(4):263-275. |
|
|
Baye T (2002). Genotypic and phenotypic variability in Vernonia galamensis germplasm collected from eastern Ethiopia. Journal of American Science 139(2):161-168. |
|
|
Bayetta B (2001). Arabica coffee breeding for yield and resistance to coffee berry disease (Colletotrichum kahawae sp. nov.). Ph.D. Thesis, Imperial College Wye, University of London, UK 56:816-821. |
|
|
Bayetta B, Behailu A, Fikadu T, Ashenafi A, Tadesse B (2007). Genetic diversity and heterosis in Arabica coffee. In: Girma A, Bayetta B, Tesfaye S, Endale T and Taye K (eds.). Coffee Diversity and Knowledge, Four Decades of Coffee Research and Development in Ethiopia. Proceedings of National Workshop, 14-17 August 2007, Addis Ababa (Ghion Hotel) Ethiopia. pp. 328-334 |
|
|
Beksisa L, Ayano A (2016). Genetic variability, heritability and genetic advance for yield and yield components of Limmu coffee (Coffea arabica L.) accessions in South Western Ethiopia. Middle-East Journal of Scientific Research 24:1913-1919. |
|
|
Dessalegn YB (2005). Assessment of cup quality, morphological, biochemical and molecular diversity of Coffea arabica L. genotypes of Ethiopia. PhD Thesis, University of Free State, South Africa. |
|
|
Dyulgerova B, Valcheva D (2014). Heritability, Variance Components and Genetic Advance of Yield and Some Yield Related Traits in Barley Doubled Haploid Lines. Turkish Journal of Agricultural and Natural Sciences. Special Issue: 1 (Özel Sayı-1):614-617. |
|
|
Falconer DS (1989). Introduction to Quantitative Genetics. Longman Scientific and Technical.Jhony Wiley and Sons, Inc. New York P 438. |
|
|
Getachew W, Sentayehu Al, Taye K (2017). Genetic variability, heritability and genetic advance for quantitative traits in coffee (Coffea arabica L.) accessions in Ethiopia. African Journal of Agricultural Research 12:1824-1831. |
|
|
Getachew W, Sentayehu AL, Taye K, Tadesse B (2013). Genetic Diversity Analysis of Some Ethiopian Specialty Coffee (Coffea arabica L.) Germplasm Accessions Based on Morphological Traits Time Journals of Agriculture and Veterinary Sciences 1(4):47-54. |
|
|
Gichimu BM, Omondi CO (2010). Morphological Characterization of Five Newly Developed Lines of Arabica Coffee as Compared to Commercial Cultivars in Kenya. International Journal of Plant Breeding and Genetics 4:238-246. |
|
|
International Coffee Organization (ICO) (2019a). International Coffee Organization, International coffee Council, 124th Session, country coffee profile, Kenya. |
|
|
International Coffee Organization (ICO) (2019b). International Coffee Organization Coffee market report August. |
|
|
Jansen J (1993). Generalized linear mixed models & their application in plant breeding research Eindhoven: Technische Universiteit Eindhoven. |
|
|
Jaetzold R, Schmidt H, Hornetz B, Shisanya D (2009). Farm management handbook of Kenya, Natural conditions and farm management information, West Kenya. Ministry of Agriculture, Kenya. |
|
|
Karanja AM, Nyoro JK (2002). Coffee Prices and Regulation and their Impact on Livelihoods of Rural Community in Kenya. Tegemeo Institute of Agricultural Policy and Development, Egerton University, Kenya. |
|
|
Kebede MB, Bellachew B (2005). Genetic divergence of Harare coffee (Coffee arabica L.) germplasm accessions at pre-bearing stage. Proceedings of the 20th International Conference on Coffee Science, Oct. 11-15, Bangalore, India pp. 1107-1112. |
|
|
Malau S, Pandiangan S (2018). Morphological Variation in Arabica Coffee (Coffea arabica L.) Growing in North Sumatra Indonesia. Journal of Agronomy Indonesia 46(3):314-321. |
|
|
Martin RP, Donald FB, Stanley W, Vincent AU (1978). A comparison of mean separation techniques. Journal of Statistical Computation and Simulation 7(1): 33-54. |
|
|
Meaza D, Girma T, Mesfin K (2011). Additive Main Effects and Multiplicative Interaction Analysis of Coffee Germplasms from Southern Ethiopia. SINET: Ethiopian Journal of Science 34(1):63-70. |
|
|
Olika K, Sentayehu A, Taye K, Weyessa G (2011). Variability of Quantitative Traits in Limmu Coffee (Coffea arabica L.) in Ethiopia. International Journal of Agricultural Research 6:482-493. |
|
|
Omondi CO, Ayiecho PO, Mwang'ombe AW, Hindorf H (2001). Resistance of Coffea arabica cv. Ruiru 11 tested with different isolates of Colletotrichum kahawae, the causal agent of coffee berry disease. Euphytica 121:19-24 |
|
|
Rachilo JR, Michieka DO (1991). Reconnaissance soil survey of the Busia area. Reconnaissance Soil Survey Report. No. R8. KARI/NARL. Kenya Soil Survey. Nairobi. Kenya. |
|
|
Singh RK, Chaudhary BD (1985). Biometrical Methods in Quantitative Genetic Analysis. Kalyani Publishers, New Delhi 300 p. |
|
|
Solomon C, Hailu T, Singh H (2009). Genetic variability, heritability and trait relationships in recombinant inbred lines of tef [Eragrostis tef (Zucc.) Trotter]. Research Journal of Agriculture and Biological Science 5(4):474-479. |
|
|
Tazeen M, Nadia K, Farzana NN (2009). Heritability, phenotypic correlation and path coefficient studies for some agronomic characters in synthetic elite lines of wheat. Journal of Food, Agriculture and Environment 7(3&4):278 -282. |
|
|
Van der Vossen HAM (1985). Coffee Selection and Breeding. In: Clifford MN, Willson KC (Eds.) Coffee Botany, Biochemistry and Production of Beans and Beverage, Croom Helm, London. pp. 49-96. |
|
|
Walyaro DJA (1983). Considerations in breeding for improved yield and quality in Arabica coffee (Coffea arabica L.). A PhD thesis, Wageningen Agricultural University. |
|
|
Yigzaw D (2005). Assessment of cup quality, morphological, biochemical and molecular diversity of C. arabica L. genotypes of Ethiopia. PhD thesis, University Free State P 97. |
|
Copyright © 2024 Author(s) retain the copyright of this article.
This article is published under the terms of the Creative Commons Attribution License 4.0


