Grain sorgum (Sorghum bicolor L. Moench) ranks fourth in important as a cereal crop after wheat, rice and maize with a total cultivated area of 150 thousand hectare (Ezzat et al., 2010). In Ethiopia, sorghum is one of the most important cereal crops planted as food insurance, especially in the lowlands of eastern and in the north and north-eastern parts of the country where the climate is characterized by unpredictable drought and erratic rainfall (Degu et al., 2009). Improvement in sorghum yield depends on the nature and extent of genetic variability, heritability and genetic advance in the base population. Besides, the information on the nature of association between yield and its components helps in simultaneous selection for many characters associated with yield improvements (Mahajan et al., 2011). Being an indigenous crop, tremendous amount of variability exists in Ethiopia. In addition, a number of varieties are released by Melkasa agricultural research center and Sirinka agricultural research center (MoARD, 2008).
However, the existence of variation alone in the population is not sufficient for improving desirable characters and little study has been conducted on the genetic variability of the released early maturing sorghum varieties. Hence, estimation of the extent and pattern of genetic variability existing in the available germplasm is essential to breeders. Breeders are also interested in the relationship that may exist between or among characters. When more characters are involved in correlation study, it becomes difficult to ascertain the characters that really contribute to yield because of the existence of some amount of interdependence. Under such complex situations, path coefficient analysis provides more effective means of separating direct and indirect factors; permitting a critical examination of the specific forces acting to produce a given correlation and measuring the relative importance of the causal factors. The path coefficient analysis under such situations helps to determine the direct contribution of these characters and their indirect contributions via other characters (Tesfaye et al., 2014).
Therefore, this study was conducted: to determine the degree of genetic variability among early to medium maturing released sorghum varieties; to investigate associations among yield and yield related traits and to determine the major yield related traits causing direct and indirect effect on grain yield.
The study was conducted during the 2010 main season at Sirinka Agricultural Research Center (Altitude 1850 m above sea level, average annual rainfall 1023 mm and average maximum and minimum temperature is 26 and 13°C) and Kobo sub center (Altitude 1468 m above sea level, average annual rainfall 310.5 mm and average maximum and minimum temperature is 14.86 and 29.30°C). The data for rainfall and temperature of the locations are obtained from their respective meteorological stations. Sixteen early to medium maturing sorghum varieties were grown in a randomized complete block design (RCBD) with three replications. The experimental unit was a four-row plot of 3 m long, spaced at 0.75 m apart and plant-to-plant distance of 0.15 m. Data were taken from the two central rows of the plot. Urea (50 kg/ha) and phosphorus (100 kg/ha) were applied to the entire plot.
Data collected from the two locations were subjected to combined ANOVA and Duncan’s Multiple Range Test was used for mean comparison. The phenotypic and genotypic variance were estimated according to the methods suggested by Burton and de Vane (1953) and these components of variance
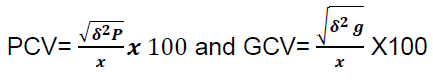
were used for the estimation of coefficients of variation (PCV, GCV) as described by Singh and Chaudhary (1977) as follows:
Heritability and expected genetic advance (K=2.06 at 5% selection intensity) were computed for each character based on the formula developed by Allard (1960). Phenotypic and genotypic correlation coefficients were estimated using the method described by Miller et al. (1958) from corresponding variance and covariance. The direct and indirect effects were determined through path coefficient analysis using the phenotypic as well as genotypic correlation coefficients following the method suggested by Dewey and Lu (1959).
From the analysis of variance for the combined ANOVA, significant differences among the varieties were observed for all the traits under investigation due to variety indicating the existence of genotypic differences among the varieties. Except plant height and 1000 seed weight, significant variations were obtained due to location for all the rest traits. This indicates that the conditions in the two locations were not similar in many aspects and the phenotypic performance of those traits of the varieties was different across the two locations.
Significant effect due to variety × location (interaction) was also obtained for all the traits, except days to emergence and leaf area index. This significant interaction effect of the traits suggested that the environmental conditions in the two locations influenced the performance of the varieties which resulted in the inconsistency in performance of these sorghum varieties across the two locations. This indicates the importance of testing the varieties across locations and over years to check their stability for use as reliable genetic materials for crop improvement in a specific location. The reader expects comparisons between this study and related work in discussion. Similar results for significant effect due to variety × location (interaction effect) is reported by Ezzat et al. (2010), for days to 50% flowering, plant height, 1000 grain weight and grain yield. Significant influence of genotype by location interaction on plant height and leaf area index is also obtained from late research by Abubakar and Bubuche (2013).
Range, mean, estimates of variance components and coefficients of variation
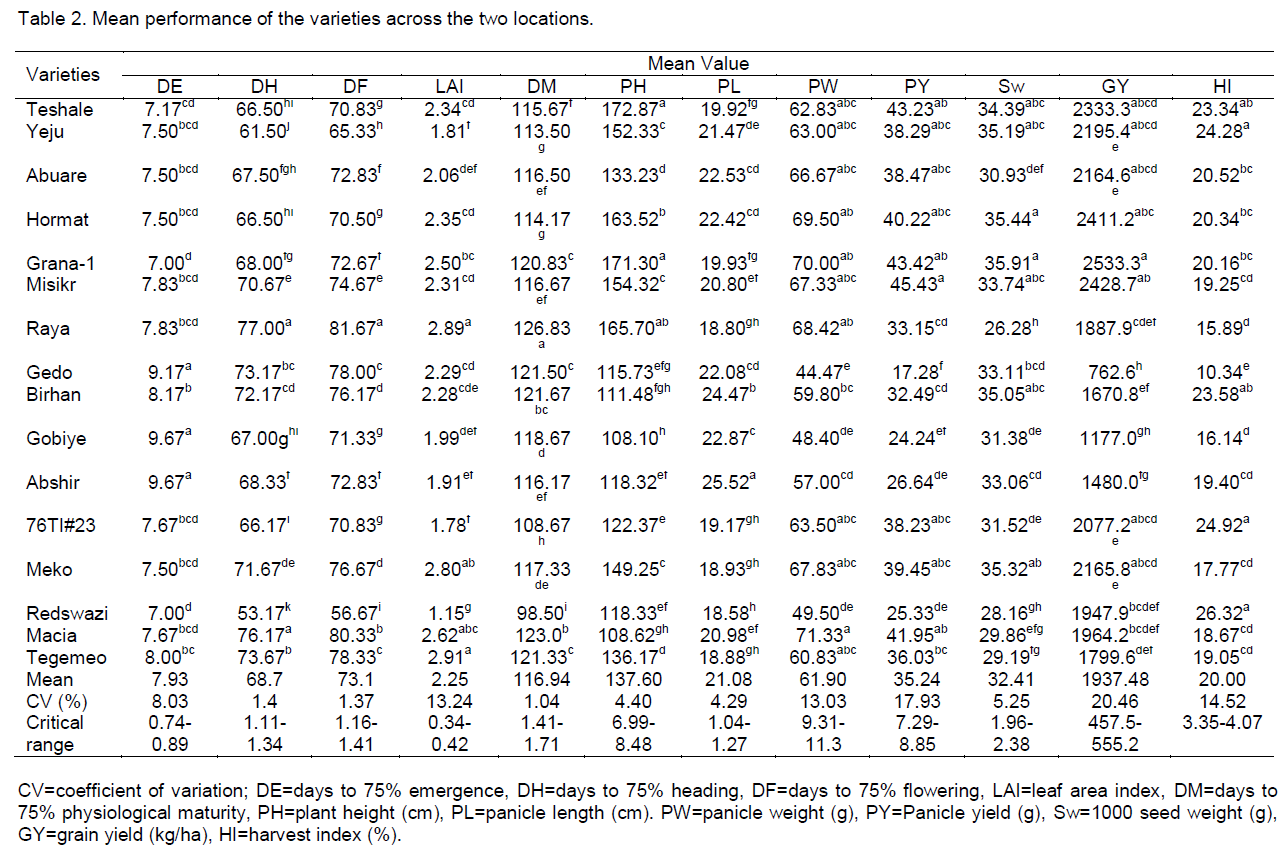
From the combined analysis, most of the traits showed wide range of variability for days to heading; days to flowering; panicle length; 1000 seed weight and panicle weight per plant and days to maturity (Table 1). Panicle yield per plant showed very wide variability ranging from 17.28-45.43 g/plant with a mean of 35.24 g. The highest mean value of panicle yield per plant across locations was obtained from Misikr followed by Grana-1, Teshale, Macia and Hormat (Table 2). Harvest index ranged from 10.34-26.32%. In the present study, Red Swazi followed by 76T1#23 and Yeju showed high value of harvest index indicating the efficiency of the varieties in converting biological yield into economic yield.
Grain yield, which is the primary interest in most breeding programs, showed a wide range of variation (762.6-2533.30 kg/ha) among the varieties across locations with a mean value of 1937 kg/ha. The highest grain yield per hectare was obtained from Grana-1 (2533.30 kg/ha) followed by Misikr (2428.70 kg/ha), Hormat (2411.20 kg/ha) and Teshale (2333.30 kg/ha) (Table 3). Therefore, the presence of such range of variations of the traits indicated that the presence of large amount of genetic variation among the released varieties which is the source of variable genetic material.
As compared to its corresponding environmental variance, combined analysis of variance showed that all the traits exhibited larger genotypic variance than environmental variance (Table 2). Higher genotypic variance estimates than the environmental variance estimates indicated that the variation in phenotypic expression of the varieties across locations is more of due to genetic constituent and the contribution of environment is fairly small. High values of phenotypic and genotypic variance of the present study for plant height and 1000 seed weight is in agreement with the findings of Can and Yoshida (1999).
Tariq et al. (2007) also reported higher phenotypic and genotypic variance for grain yield among the varieties which supported the present study. Similarly, Bello et al. (2007) reported higher genotypic variance than environmental variance for panicle length, plant height, grain weight per panicle, days to flowering, days to maturity and grain yield per hectare, which is supported by the present study, and also for number of leaves per plant and number of grain per panicle. In general, the variance components across locations showed that all of the traits had higher genotypic variance estimates than the environmental variance estimates suggesting that expressions of the traits were more of due to genetic which can be exploited by breeding.
Phenotypic coefficient of variation (PCV) ranged from 7.98-38.69% and genotypic coefficient of variation (GCV) ranged from 6.71-32.84%. With these ranges, high value for PCV was obtained by grain yield/ha (38.69%) followed by panicle yield per plant (35.57%), leaf area index (31.11%), harvest index (30.70%), plant height (24.50%) and panicle weight per plant (21.61%) (Table 2).
Similarly, the maximum value of GCV also obtained from grain yield per hectare followed by panicle yield per plant, leaf area index, harvest index and plant height with a value of 32.84, 30.73, 28.11, 27.05 and 24.10%, respectively. These high values of PCV and GCV revealed that the varieties have a broad base genetic background so that they can respond positively to selection. The high values of PCV and GCV across locations for certain traits like plant height, panicle yield per plant and grain yield per hectare were obtained by Bello et al. (2007) which are supported by the present study.
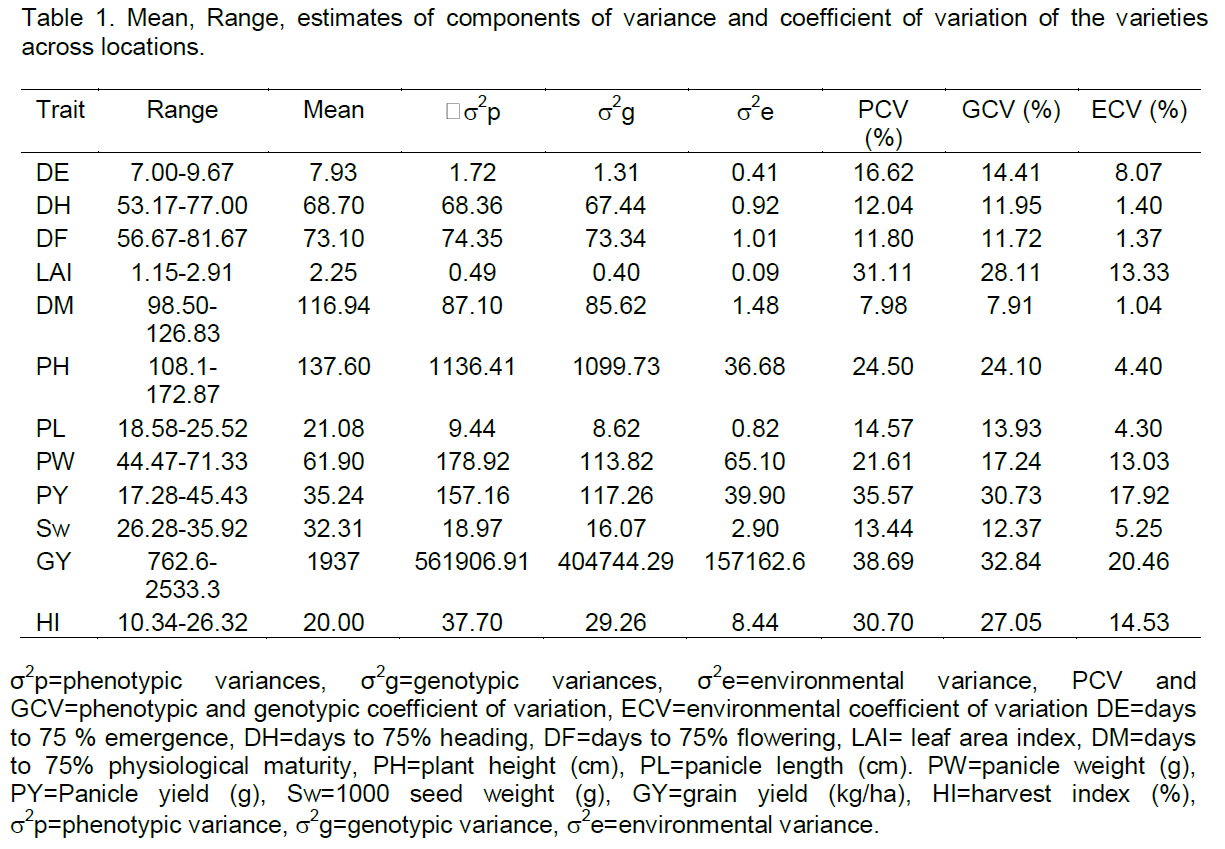
Bello et al. (2007) also reported high value of PCV and GCV for panicle length per plant, 1000 seed weight, days to flowering and days to maturity in contrary to the present study. In another case, low GCV was observed for days to maturity (7.91%) which indicated that improvement of this traits through selection is less effective due to lack of genetic variability among the varieties which is the basic prerequisite in which positive response due to selection depends on. In general, GCV value was generally smaller than their corresponding PCV values for all the traits considered indicating the contribution of environmental variance for the expression of phenotypic variance of the traits.
Heritability and expected genetic advance
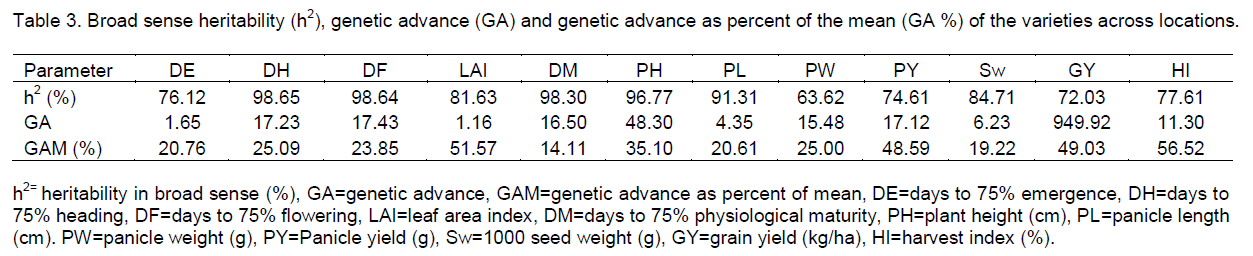
Heritability estimates for traits under study for combined over locations is depicted in Table 3. The estimated values of broad sense heritability ranged from 23.76-98.65% over locations. According to Singh (2001), high heritability of a trait (≥ 80%) provides selection for such traits could be fairly easy due to a close correspondence between the variety and the phenotype due to the relative small contribution of the environment to the phenotype. In other words, if environmental variability is small in relation to genotypic differences, selection will be efficient because the selected character will be transmitted to its progeny. But selection may be considerably difficult or virtually impractical for traits with low heritability (≤ 40%) due to the masking effect of the environment so that the greater the proportion of the total variability is due to environment.
Based on this benchmark, high broad sense heritability was estimated for days to heading (98.65%), days to flowering (98.64%), leaf area index (81.63%), days to maturity (98.3%), plant height (96.77%), panicle length (91.31%) and 1000 seed weight (84.71%) across locations.
Mahajan et al. (2011) also reported similar results of high heritability for days to flowering, panicle length per plant and plant height at a location. High estimated heritability values of the present study for panicle length per plant, plant height, days to maturity and days to flowering agreed with the findings of Bello et al. (2007). In general, high broad sense heritability of the traits indicated their potential to respond positively to selection at different locations.
Grain yield also showed moderate heritability value (72.03%) across locations. On the other hand, high heritability value of grain yield was reported by Mahajan et al. (2011) and Tariq et al. (2007) (95.18%). Bello et al. (2007) also found low heritability of grain yield (10%). This highly variable result of heritability of grain yield indicated that it is a typical example of quantitative trait in which its phenotypic expression is highly influenced by environmental variations. Harvest index showed moderate estimated value of heritability. But Tariq et al. (2007) and Mahajan et al. (2011) found high heritability value which is not in agreement with the present study.
High heritability with low genotypic coefficient of variation may hinder easy to selection and improvement of these traits through selection. Genetic progress expected from selection increases with an increase in genotypic variance. In line with this statement, leaf area index and plant height showed high heritability coupled with high genotypic coefficient of variation across locations which indicated that these traits may respond effectively to phenotypic selection. Bello et al. (2007) found high heritability coupled with high genotypic coefficient of variation for traits such as panicle length per plant, plant height, days to flowering and days to maturity across locations. From these traits only plant height is in agreement with the present study. Mahajan et al. (2011) also reported high heritability coupled with high genotypic coefficient of variation for panicle yield per plant and harvest index which is not in agreement with the findings of the present study due to the fact that these traits have medium heritability but high genotypic coefficient of variation.
The estimated value of expected genetic advance expressed as percentage of mean ranged from 9.32-56.52% across locations. Leaf area index, plant height, grain yield per hectare, harvest index and panicle yield per plant, which have better genotypic coefficient of variation, showed a relatively high expected genetic advance. Mahajan et al. (2011) also reported high value of expected genetic advance expressed as percent of mean for harvest index, plant height and panicle yield per plant. Selection based on those traits with a relatively high genetic advance as percent of mean will result in the improvement of the performance of the varieties for the traits. Therefore, from this study, traits such as leaf area index, plant height, panicle yield per plant, grain yield per hectare and harvest index have the potential to respond positively to selection across different environments because of their better broad sense heritability coupled with relatively high genetic advance across locations.
Correlation studies
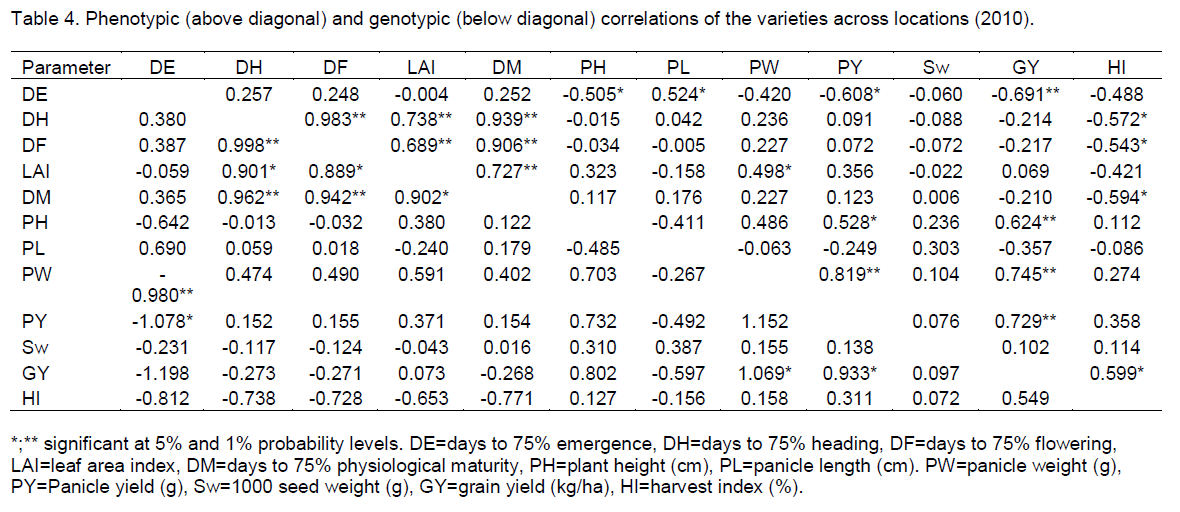
Traits of crop plants are generally correlated and correlations between characters are frequent features in plant breeding which can be either negative or positive. The phenotypic and genotypic correlation coefficients worked out among yield and yield related traits across locations are presented in Table 4.
Phenotypic correlations
From the combined analysis, grain yield showed significant (p=0.01) high positive phenotypic correlations with plant height (r=0.624) and panicle weight per plant (r=0.745) (Table 5). This is in conformity with Ezeaku and Mohammed (2006) who found high positive phenotypic correlation coefficients of grain yield with head weight and plant height across two locations. Grain yield also showed significant (p=0.01) high positive phenotypic correlations with panicle yield per plant (r=0.729) and harvest index (r=0.599).
The correlation of grain yield with harvest index is in agreement with the findings of Tariq et al. (2007). Generally, grain yield showed positive phenotypic associations with leaf area index, plant height, panicle weight per plant, panicle yield per plant, 1000 seed weight and harvest index and negative association with all the rest traits across locations. Therefore, the positive association of grain yield with these traits suggested that the possibility of simultaneous improvement of grain yield through indirect selection of these positively correlated traits.
Days to heading showed significant (p=0.01) strong positive phenotypic correlations with days to flowering (r=0.983), leaf area index (r=0.738) and days to maturity (r=0.939). Days to flowering also showed significant (p=0.01) high positive phenotypic correlations with leaf area index (r=0.689) and days to maturity (r=0.906). Significant (p=0.01) strong positive phenotypic correlation was also obtained between leaf area index and days to maturity (r=0.727) and panicle weight per plant and panicle yield per plant (r=0.819). Significant (p=0.05) negative phenotypic correlation was obtained from plant height (r=-0.505) and panicle yield per plant (=-0.608) with days to emergence. Similarly, harvest index also showed significant (p=0.05) negative phenotypic correlations with days to heading (r=-0.572), days to flowering (r=-0.543) and days to maturity (r=-0.594). Generally, positive correlation of any pairs of traits of the present sorghum population indicated the possibility of correlated response to selection. In contrary to this, the negative correlation prevents the simultaneous improvement of those traits along with each other.
Genotypic correlations
The results obtained from the combined analysis showed significant (p=0.05) strong positive genotypic correlations of grain yield with panicle weight per plant (r=1.069) (Table 5). This is in accordance with the result obtained by Ezeaku and Mohammed (2006). Grain yield also showed significant (p=0.05) and high positive genotypic correlation with panicle yield per plant (r=0.933). Ezeaku and Mohammed (2006) also found significant high positive genotypic correlations of grain yield with plant height and 1000 seed weight across locations which were positive but non-significant in the present study. Significant (p=0.01) strong positive genotypic correlations were also obtained for days to heading with days to flowering (r=0.998) and days to maturity (r=0.962). Significant (p=0.01) positive genotypic correlation was also obtained between days to flowering and days to maturity (r=0.942). Leaf area index showed significant (p=0.05) positive genotypic correlation with days to heading, days to flowering and days to maturity with a correlation coefficient of 0.901, 0.889 and 0.902, respectively.
On the other hand, significant (p=0.01) but negative correlation existed between days to emergence and panicle weight per plant (r=-0.980).
Generally, the values of genotypic correlation coefficients were higher than the corresponding phenotypic correlation coefficients for most of the traits suggesting that there was inherent relationship between these traits. This is in accordance with the findings of Mahajan et al. (2011) and Ezeaku and Mohammed (2006). The positive association between all possible pair of traits suggested that the possibility of correlated response to selection so that with the improvement of one trait, there will be an improvement in the other positively correlated trait. The positive genotypic association allows simultaneous genetic improvement for grain yield. This is because a positive genetic correlation between two desirable traits makes the job of plant breeder easy for improving both traits simultaneously. Unlike positive correlation, negative correlation between two desirable traits may impede or makes it impossible to achieve the simultaneous improvement of those traits along with each other.
Generally, the existence of strong positive correlation between grain yield and other traits helps in identifying traits that could be used for indirect selection for the improvement of grain yield. Therefore, to facilitate selection in breeding for high yield and other desirable traits, it is logical to examine various components and give more attention to those having the greatest influence on grain yield.
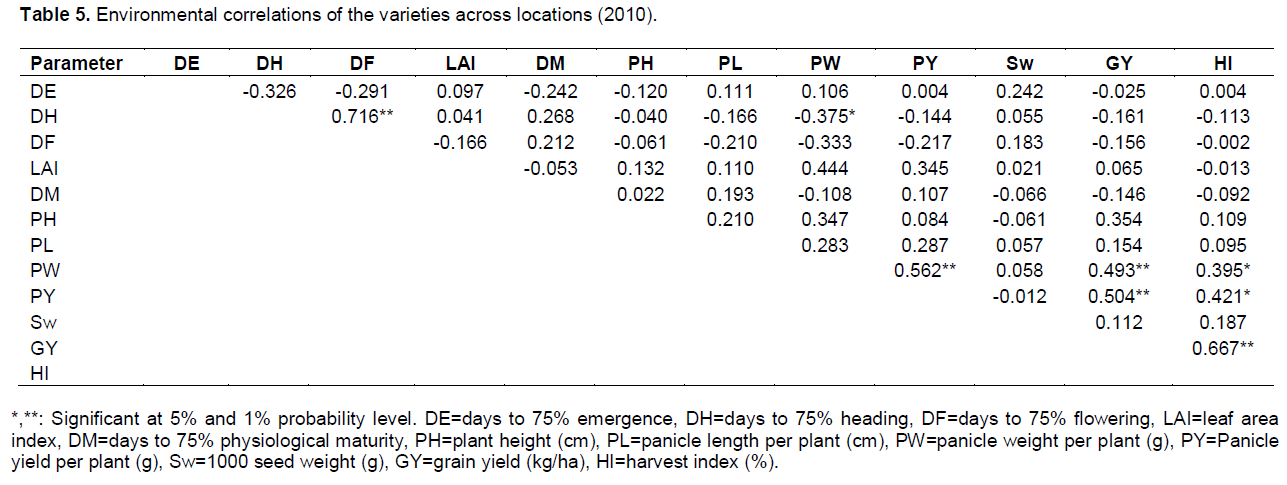
Environmental correlations
From the combined analysis, grain yield per hectare showed significant (P=0.01) and positive environmental correlations with panicle weight per plant (r=0.493) (Table 5). This is in agreement with the finding of Ezeaku and Mohammed (2006). It also showed significant (P=0.01) and positive environmental correlations with panicle yield per plant (r=0.504) and harvest index (r=0.667). Significantly (P=0.01) high positive environmental correlations were obtained between days to heading and days to flowering (r=0.716) and panicle weight per plant and panicle yield per plant (r=0.562). Harvest index showed significant (p=0.05) positive correlations with panicle weight per plant (r=0.395) and panicle yield per plant (r=0.421).
In general, the positive environmental correlation between pairs of traits justified that any environment that favors/disfavors the expression of one trait will also favors/disfavors the expression of other positively correlated trait. However, the negative correlation indicated that some environmental variables that are favorable for the increment of the value of one trait might have caused a value decrement of negatively correlated trait.
Path coefficient analysis
By using grain yield as a dependent variable, the phenotypic and genotypic correlations were partitioned into direct and indirect effects for only four traits that are believed to have a direct relationship with grain yield from the data obtained from across locations.
Phenotypic path analysis
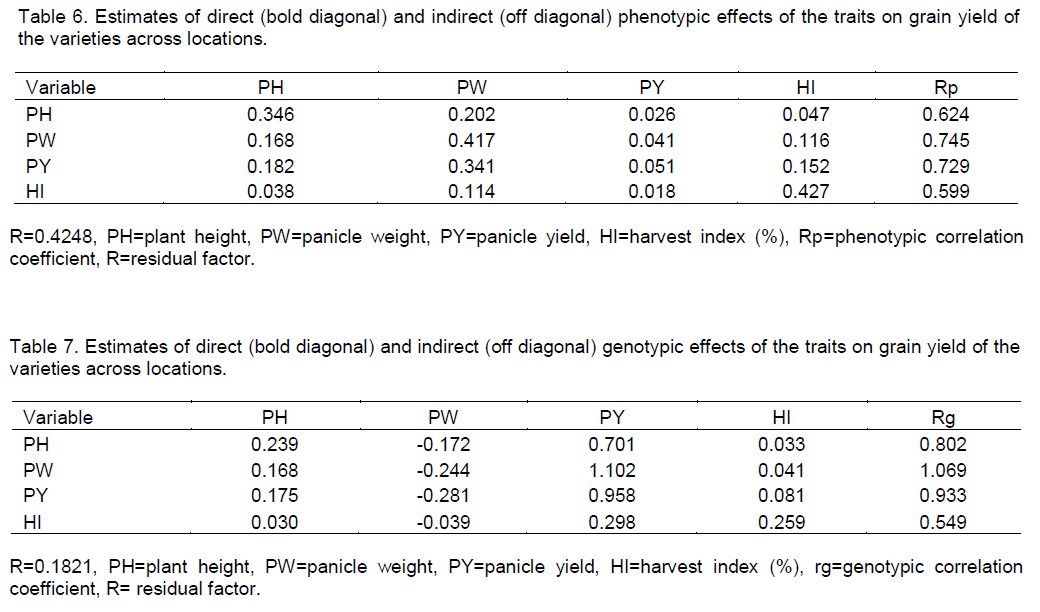
Partitioning of phenotypic correlations into direct and indirect effects on grain yield revealed that all the traits included in the path analysis showed positive direct effects (Table 6). The positive phenotypic direct effect of plant height and harvest index on grain yield is in agreement with Mahajan et al. (2011). Ezeaku and Mohammed (2006) also found positive direct effect of panicle weight on grain yield which is supported by the present study. Harvest index showed the highest direct effect on grain yield (0.427) followed by panicle weight (0.417) and plant height (0.346) while panicle yield showed negligible positive phenotypic direct effect (0.051) and contributed indirectly to grain yield via panicle weight (0.341). The synchronization of significant high positive correlation and considerable direct effects of plant height, panicle weight and harvest index on grain yield justified that the need to identify the nature of relationships between yield and yield related traits by using path analysis. Significant high positive correlation of panicle yield and its negligible direct effect revealed that indirect effect of panicle yield was cause of correlation. Therefore, such considerable indirect effects should be considered simultaneously for selection. The phenotypic residual value (0.4248) indicated that the traits which are included in the phenotypic path analysis explained 57.52% of the variation in grain yield.
Genotypic path analysis
Genotypic path analysis showed that plant height, panicle yield and harvest index showed positive direct effect (Table 7). The positive genotypic direct effect of plant height is in conformity with the results obtained by Mahajan et al. (2011) in their study on variability, correlation and path coefficient analysis in sorghum. The same authors also found negative direct effect of harvest index which is positive in the present study. Panicle yield which had significant high positive correlation with grain yield exerted considerable high positive direct effect (0.958). The correlation coefficient (0.933) of this trait is equivalent to its direct effect. This indicated that the correlation of this trait with grain yield was found to be mainly due to its direct effect. Therefore, there existed a true relationship and a direct selection, though this trait will be effective.
Panicle weight had negative direct effect (-0.244) and considerable indirect effect (1.102) via panicle yield. But its correlation was significantly high and positive. Matching of significantly high positive correlation and negative direct effect of this trait indicated that the indirect effect of this trait seem to be the cause of correlation. Therefore, the indirect causal factor should be considered simultaneously.
Plant height was another trait which had positive direct effect which is small as compared to its correlation coefficient. But it also contributed high positive indirect effect to grain yield via panicle yield. Therefore, high positive correlation of plant height with grain yield was due to both its positive direct effect and indirect effect via panicle yield. Harvest index which have positive genotypic correlation with grain yield showed considerable positive direct effect. Beside its direct effect, it also showed relatively large positive indirect effect via panicle yield. This indicated that the correlation was the result of both direct and indirect effects. Therefore, such considerable indirect effects should be considered for selection. The genotypic residual value (R=0.1821) indicated that the traits which are included in the genotypic path analysis explained 81.79% of the variation in grain yield.
Twelve characters were involved in the combined analysis of variance across the two locations. The study revealed the existence of significant genetic variability among the tested varieties for different traits. The presence of significant genetic variability among the varieties suggested the possibility of improving the traits through direct and indirect selection. Traits with high heritability and genetic advance are important traits which should be given attention in order to bring an effective response of grain improvement of the concerned varieties. The study of relationships is also important for assessing the feasibility of joint selection of two or more traits and hence for evaluating the effect of selection for secondary traits on genetic gain for the primary trait under consideration.
The path coefficient analysis revealed that all the traits included in the path analysis showed positive phenotypic direct effect. As a result of this, traits that exerted positive direct effect and positive and significant correlation with grain yield needs much attention in selection program. Traits that also showed considerable positive indirect effects via other traits should be considered simultaneously as indirect selection criteria for grain yield improvement. Therefore, in order to bring an effective improvement of grain yield, more attention should be given for traits such as plant height, panicle weight, panicle yield and harvest index which showed high positive phenotypic and genotypic correlation coefficients with a considerable direct and indirect effect on grain yield.