Full Length Research Paper

ABSTRACT
Modern Rate Transient Analysis (RTA) is the hottest technology in recent years in reservoir engineering. Its main working principle is combining production data with bottom-hole pressure data based on the assuming reservoir model and well model. It will evaluate the reserves (Oil Drainage Radius and STOIIP), reservoir properties (permeability), wellbore condition (skin) and forecast production performance for single well based on matching Blasingame and Log-Log type-curve. The RTA was found to be extremely powerful and popular particularly with high resolution to obtain equivalent results with PTA rather than limited shutting well. With benefit of continued monitoring of production and FBHP or FWHP, it is possible to evaluate the wells’ interference and boundary in distance besides conventional reservoir properties. In this paper, taking a carbonate reservoir in the Middle East as an example, this technology was applied to diagnose and analyze the abnormal production of pilot horizontal wells. Based on the analysis results, combining with the understanding of geological study, material balance analysis, numerical simulation and adjacent vertical well’s performance, it is clear that the distribution of mudstone interlayer and reservoir poor connectivity in member-A are the main interior factors of the abnormal production of pilot horizontal wells. According to the research, this paper put forwards optimization of development strategy for subsequent producing subzones, well location and well type of new well in interest area.
Key words: Rate transient analysis, type-curve, reservoir properties, carbonate reservoir, Middle East
Abbreviation: h = net-pay, ft; Φ = porosity, %; k = reservoir permeability, md; Pi = initial reservoir pressure, psi; Pwf = flowing bottom-hole pressure, MPa; q(t) = liquid rate, bbl/d; Q(t) = cumulative liquid rate, bbls; rw = well bore radius, m; Re = drainage radius, m; So = oil saturation; t = time; tcr = material balance time; µ = viscosity, cp; B = formation volume factor, bbl/STB; Ct = total reservoir compressibility, 1/MPa; S = Skin; STOIIP = reserves in drainage area, MMSTB.
INTRODUCTION
The Asmari Formation of M oilfield in the Middle East is a set of mixed dolomite, limestone and sandstone reservoirs with a strata thickness of about 150-380 m. For Asmari Formation, member A and B segments are the main production layers (He et al., 2018; Hongqiang et al., 2018; Adnan and Ole, 2007). Member A is mainly dominated with dolomite, and few mudstones is distributed in an unstable manner to form the interlayers in carbonate sedimentary environment. The sedimentary setting of the member B is distributary channel microfacies of the deltaic front, and tidal flat and lagoon subfacies of the restricted platform. In the member B of the Asmari Formation, its lithologies is very complex, including sandstone, limestone and dolomite. Due to the complex lithology of the Asmari Formation, the reservoir space and petrophysical properties are greatly different, and the heterogeneity is extremely strong. Especially, the permeability of different lithologies varies by 10-100 times, which leads to the great difference in well productivity vertically and horizontally. In early development phase of M oilfield, it mainly adopts commingle development mode with the vertical wells in interest area. After nearly 40 years producing history, the water encroachment mode of member B is greatly complexity. Meanwhile, in order to increase producing degree and improve development effect of member A separately, the first batch of two pilot horizontal wells (M-49H/M-50H) have been implemented in interest area; however, they can only produce 4-7 months then shut down.
Considering lack of enough test data, such as core sampling, imaging logs, PLT and pressure test in target well, and to find out the cause of the abnormal producing status of pilot horizontal well, this paper tries to apply the hottest technology (Rate Transient Analysis) to do some deep studies. Based on the theory of transient rate and pressure in porous media, this paper integrates the production history data and bottom-hole flowing pressure to do quantitative analysis in diagnosis of reservoir properties for the target well_M-50H. On the basis of the above mentioned studies, it will combine geological understanding, material balance analysis with numerical simulation to make clear the cause of the abnormal production for pilot horizontal wells; thereafter, some optimization and adjustment would be done for the next step of work.
GEOLOGICAL INFORMATION ABOUT THE ANALYZED FORMATION
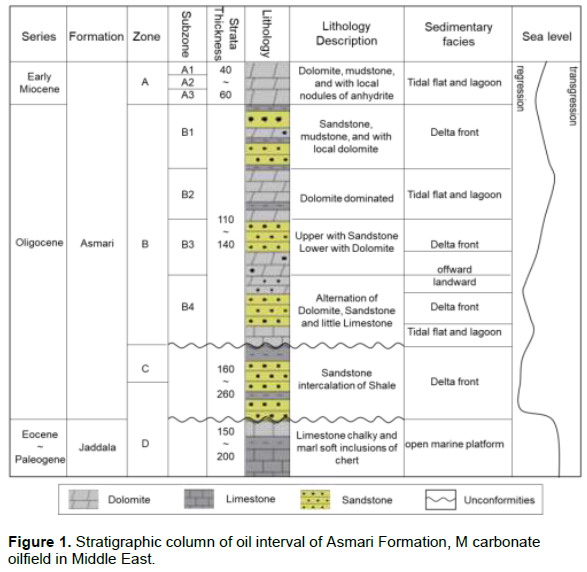
The M field is located on the southeastern border of Iraq and Iran, which is a part of the Zagros tectonic belt. In Middle East, the Asmari Formation (Oligocene-Miocene) is the most important reservoir in Mesopotamia Basin. For M oilfield, the Asmari deposited in the sedimentary environment of transition from the terrestrial facies clastic rock to marine carbonate rocks. The buried depth of Asmari Formation is about 2,800-3,200 m, with a strata thickness of about 150-380 m (He et al., 2018; Hongqiang et al., 2018; Adnan and Ole, 2007). The Asmari Formation consists of four segments of member A, B, C and D (Figure 1), in which segments A and B are the main oil-bearing zones. For member A, it is dominated with dolomite, which also can be furtherly subdivided into subzones A1, A2 and A3. Member B is dominated with sandstone, and interbedded with dolomite and limestone, which is subdivided into subzone B1, B2, B3 and B4. The obvious character of Asmari Formation is its complexity of lithology, with a rapid change of lithofacies in the plane and strong heterogeneity of reservoir properties (Figure 2), all these factors leading to great difference in well productivity and water encroachment rules. Totally, the carbonate reservoir of the Asmari Formation is characterized by low matrix permeability, and effective drainage is dependent on the occurrence of pure sandstone and open micro-fractures.

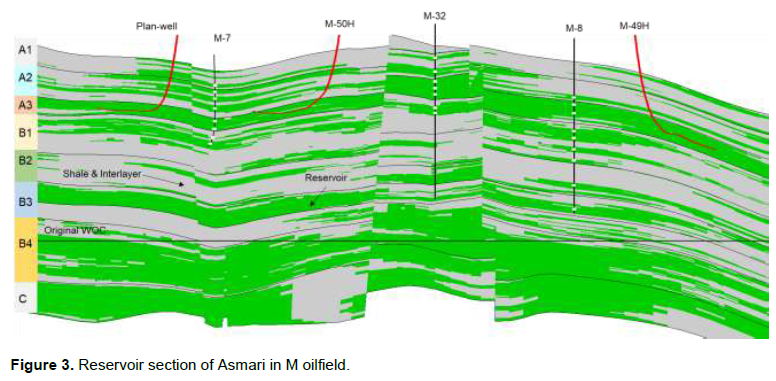
In early development phase of M oilfield, it deployed a set of well pattern by using vertical well with commingle to producing member A and B in Asmari. However, the production-log-tools (PLT) showed that the oil mainly produced from subzones B1 and B3, which are sandstone-dominated sublayers. In contrast, the oil from member A is very small or nearly nothing. Moreover, after more than 40 years of intermittent producing in Asmari, the water encroachment degree in member B is high and the waterflood situation is very complicated. In view of these, in order to achieve balanced exploitation in member A and B, the first batch of pilot horizontal wells have been deployed in member A separately in 2019 (well M-50H/M-49H), and it deployed the horizontal section (400-600 m) within sublayer A3 (Figure 3). However, the well performance after completion and production shows that the horizontal wells have poor development effect with intermittent producing period within 4-7 months then shut down.
RATE TRANSIENT ANALYSIS
Blasingame type-curve analysis plot
Rate Transient analysis (RTA) and Pressure Transient Analysis (PTA) are both getting pressure and rate data and do some kind of analysis. They converged recently but do not share the same history. RTA started with the empirical observation of rate decline. In the 1940’s, Arps published a formulation of constant pressure production including exponential, hyperbolic and harmonic decline responses (Arps, 1945). In 1980’s, Fetkovich introduced a type-curve combining the theoretical response of a well in a closed reservoir and the standard Arps decline curves (Fetkovich, 1980). The most benefit for this work was to come up with a log-log matching technique applicable to both the transient part of the data and the boundary dominated flow period. The main limitation in the Fetkovich type-curve is the assumption of constant flowing pressure but the actual is the changing rate and flowing pressure mode. Therefore, in 1990’s, Blasingame introduced a concept-material balance equivalent time (Blasingame et al., 1991; Palacio and Blasingame, 1993), tcr, which is defined as the ratio of the cumulative and flow rate and is a superposition time function, but it can convert variable rate data into an equivalent constant rate solution. By using tcr, it can build a relationship between changing rate and constant rate. On this basis, Blasingame used a pressure normalized flow rate to reduce the influence of noise in production data and introduced new Log-Log type-curve plots, plotting the flow rate, rate integral, and rate integral derivative functions as function of material balance time. The Blasingame type-curve can be divided into two segments (Figure 4). The first segment is the production transient flow; through analysis of this segment, parameters such as permeability and skin can be obtained. The second segment is the boundary-dominated flow period, usage of flow rate integral derivative allow boundary dominated flow to be represented by harmonic stem only, regardless of flowing conditions. Blasingame harmonic stem offers an analytical oil-in-place solution, but this oil-in-place is the moving oil that happened within well drainage radius.

Log-Log normalized pressure integral plot
In order to furtherly mitigate the noise inherent to the production data, NPI analysis plots a normalized pressure rather than a normalized rate (Song, 2011; Li et al., 2009, 2016; Ishkin et al., 2016; Basayir, 2018; Ataei et al., 2018; Wei, 2018; Han et al., 2016; Sunday et al., 2014; Wang et al., 2018). If we plot  vs.
vs.  on a Log-Log scale, the boundary-dominated flow will exhibit a unit slope line, similar to pseudo-steady state in Pressure Transient Analysis. Furthermore, if we take the integral normalized pressure derivative with respect to the logarithm of tcr, the transient part will exhibit stabilization at a level linked to the mobility. Such definitions provide a diagnostic tool where most of the usual well test methods can be used. Therefore, this method is similar with PTA completely. The Log-Log normalized pressure integral vs. material balance time plot suggests that there are two obvious flow regimes (Figure 5):

a) Infinite Acting Radial Flow (Transient flow) indicates by level line (L2), through analysis of this segment, that parameters such as Permeability and Skin can be obtained. For a specific case, the sensitivity analysis results show that the distance of L1 will constrain Skin value, which both have positive relationship, longer L1 will mean bigger Skin and vice versa. Moreover, we also found the location of L2 will affect kh value, while the location of L2 downwards will mean higher permeability (k) and vice versa.
b) Pseudo-Steady Boundary-Dominated Flow characterized by a unit-slope line, through analysis of this segment, parameters such as Oil Drainage Radius and Oil-in-Place (STOIIP) can be obtained. For a specific case, when the kh is known, one can then get a first estimation of the well flowing area and drainage radius. The sensitivity analysis results show that the location of L3 will constrain STOIIP value, the location of L3 towards right will mean bigger STOIIP and vice versa.
Workflow of rate transient analysis
In theory, the difference between RTA and PTA is ultimately attributed to the actual data quality difference, in which RTA belong to "low monitoring frequency and low resolution", while PTA belongs to "high monitoring frequency and high resolution".
Collecting basic data and information: including well history, petrophysics properties (porosity, net thickness), initial pressure on interest data segment, rock compressibility and lab PVT .
Daily rate and bottom-hole pressure: If there is no Permanent Downhole Gauge, VFP models were used to convert the THP data into BHP, and then the actual test data will be used to calibrate the BHP calculation.
Data consistency checking: This requires collecting daily rate and bottom-hole flowing pressure data, making q-t, p-t and q-p relation graph, and checking the data consistency, filtering out the unreliable data and then removing data with lack of correlation in rate and pressure.
Identifying the transient flow and boundary-dominated flow region: This is similar to pressure derivative curve in PTA, drawing Blasingame and Log-Log type-curves, finding out the transient flow and boundary-dominated flow region and then matching the actual data with type-curves.
Production and pressure history matching: This will help realize the modeling and dynamic data (q and Pwf) mutual historical fitting to verify the correctness of analysis results, especially for complex cases and noisy data where no specific behavior is seen on these diagnostic plots.
Reservoir parameter calculation: Relevant reservoir properties will be calculated from the fitting results, including permeability, skin, oil drainage radius and STOIIP.
Dynamic performance forecasting: According to the fitting results, the dynamic performance prediction under fixed pressure or fixed production mode is carried out to guide well future optimization.
CARBONATE RESERVOIR CASE STUDY
Well history
M-50H is the first batch of pilot horizontal well deployed in Asmari Formation in M field, with adjacent vertical well of M-7 and M-32. Its actual horizontal section length is 460 m within A3. Considering long-term development and strong water encroachment degree in unit B1-B4, the aim of deploying horizontal well in unit A3 is to achieve balance producing in member A and B and to improve the low-permeability reserves producing degree in member A. The other reservoir properties for M-50H are as follows: Porosity 9.52%, net thickness of A3 10 m, oil saturation 70%, effective horizontal section length 345 m, formation pressure 28.96 MPa, and formation temperature 93ºC. PVT and fluid reports show: formation volume factor 1.275 B/STB, Viscosity 1.74cp, Oil compressibility 11.7E-4 MPa-1, Rock compressibility 7.25E-4 MPa-1, and Total compressibility 18.95E-4 MPa-1.
On 2019/3/26, M-50H was put into producing with initial oil rate of 1484BOPD, wellhead pressure 3.5 MPa with chock size 32/64’’. However, the later production shows that M-50H has very poor development performance with intermittent producing period which was thereafter shut down.
Rate transient analysis and identification of flowing region
Applying rate transient analysis mode, including Blasingame and Log-Log type-curve was based on the liquid rate and converted BHP from measured THP. In Figure 6, it can be seen clearly that the flowing of M-50H resulted to boundary flowing; Secondly, the transient flow character was also obvious, and it meant the kh and Skin can be calculated more confidently; Thirdly, applying horizontal well mode can help obtain good matching on both Blasingame and Log-Log type-curve plot.
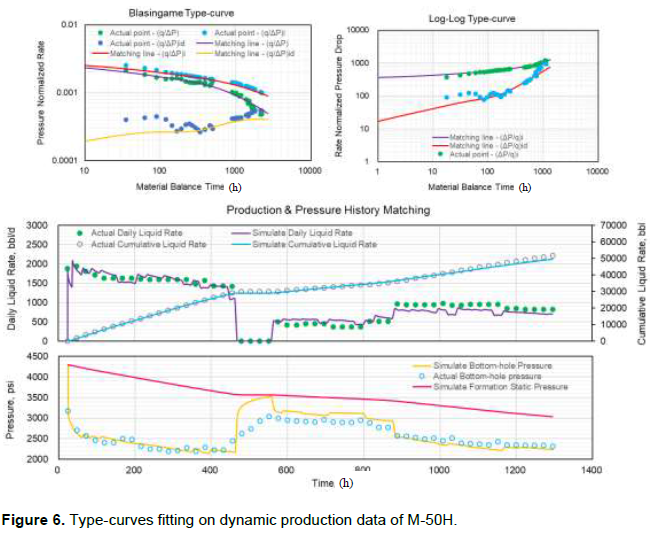
Subsequently, the reservoir properties are calculated as follows: Permeability 23.4 md, Skin 1.26, Oil drainage radius 478 m, STOIIP 3.5 MMSTB and well productivity index 148 bbl/d/MPa. Combined with the reservoir parameters, a zero-dimension reservoir numerical model for a single well was built to make production and pressure history matching to reduce the multiplicity of solution and to verify the accuracy of Blasingame and Log-Log type-curve.
INTEGRATING WITH MBM METHOD AND GEOLOGICAL UNDERSTANDING
Material balance method
Prerequisites: 1- Circle closed reservoir; 2- Fluid with weak compressibility; 3- Cumulative oil rate with 0.88×10⁴ m3; 4- Net thickness 10 m of oil zone, Porosity 9.52%, Oil saturation 70%; 5- Initial formation pressure with 29.6 Mpa; 6- Current formation pressure with 20.6 Mpa. The calculation details can be seen in Figure 7. According to the above prerequisites and parameters, the simplest material balance mode is built to diagnose the well oil drainage radius with 496 m and to calculate the STOIIP requires 2.6 MMSTB.

Geological understanding
The Asmari Formation sedimentary facies are composed of a deltaic system and carbonate platform. The changes of sea level result in two kinds of very different sediments mixed. As the seawater gradually gets deeper, member A becomes restricted platform facies, and the sediments are mainly micritic and bioclastic dolomite, representing dolomite lagoon and intra-platform shoal microfacies respectively. To make well correlation of Asmari Formation in M oilfield, it is clear that mudstone interlayers developed within member A, especially within inner of A3 (Figure 8). Due to the lateral interlayer with unstable distribution in A3, it will restrict the oil moving at vertical direction while using horizontal well. Correspondingly, it will avoid this weakness while using vertical well by penetrating all subzones. After updating interlayers’ distribution in geo-modeling, the simulation results also show that the production of M-50H occurs quickly decreasing in short time due to poor reservoir connectivity and low STOIIP (Figure 9).


Adjacent vertical well performance comparison
Table1 shows the well performance comparison between horizontal well and adjacent vertical well, due to the vertical well penetration of member A (dolomite, low permeability) and member B (sandstone, high permeability) with commingle production, can overcome the negative effect of mudstone interlayers. However, for horizontal well, limiting with poor petrophysics properties and mudstone interlayer’s interference in member A simultaneously, will restrain oil flowing to the horizontal section from each sublayer in vertical direction.

Development strategy optimization
Considering huge negative effect of mudstone interlayer to horizontal well application in member A separately, it will optimize well type with high-deviation well to produce member A or member A and B. For abnormal well of M-50H and M-49H, it will try to use “Acid and Fracturing” technology to help them improve well performance. Meanwhile, it is also very important to engage in deeper research and study mudstone interlayer’s distribution and waterflood distribution in Asmari Formation.
CONCLUSIONS
This paper mainly focused on Rate Transient Analysis (RTA) technique application in well abnormal producing status’s diagnosis, taking a Middle East carbonate reservoir as an example, and conclusions are drawn as follows:
1) Research and application in M-50H show that RTA is a powerful tool for analyzing historical production and flowing pressure data to estimate reservoir properties and STOIIP without shutting well. The studies show that the poor petrophysics properties and mudstone interlayer existing in A3 are the main reasons for a short-time producing period for well M-50H.
2) According to comprehensive analysis results, it is suggested that the well type and well location of new well be optimized in future work along with plan on using “Acid and Fracturing” technology to support normal producing for well M-50H and M-49H in future.
3) In theory, Rate Transient Analysis (RTA) technique is formed on the basis of Well Test (PTA), and the main difference between both is reflected in the access and accuracy of the used data. From this point of view, the method in this paper is a good supplement to Well Test interpretation in practical application, rather than a replacement.
CONFLICT OF INTERESTS
The authors have not declared any conflict of interests.
REFERENCES
|
Adnan AM, Ole PW (2007). The Control of Fracturing and Dolomitisation on 3D Reservoir Property Distribution of the Asmari Formation (Oligocene-Lower Miocene), Dezful Embayment, SW Iran. SPE 11191. |
|
|
Arps JJ (1945). Analysis of Decline Curve. AIME 160(01):228-247. |
|
|
Ataei A, Motaei E, Yazdi ME (2018). Rate Transient Analysis RTA and Its Application for Well Connectivity Analysis: An Integrated Production Driven Reservoir Characterization and a Case Study. SPE 192046. |
|
|
Basayir AL (2018). Use of Rate Transient Analysis to Evaluate Hydraulically Fracture Well Performance in a Mature Gas Field. SPE 191427. |
|
|
Blasingame TA, McCray TL, Lee WJ (1991). Decline Curve Analysis for Variable Pressure Drop/Variable Flowrate System. SPE 21513. |
|
|
Fetkovich MJ (1980). Decline Curve Analysis using Type Curve. JPT. |
|
|
Han J, Cheng H, Shi Y (2016). Connectivity Analysis and Application of Fracture Cave Carbonate Reservoir in Tazhong. Science Technology and Engineering 16(5):147-152. |
|
|
He J, Sun Li Ni J (2018). Characteristics and Heterogeneity of the Diamictite Reservoir in B Member of Asmari Formation in M Oilfield, Iraq and Their Impacts on Development. China Offshore Oil and Gas 30(4):127-134. |
|
|
Hongqiang W, Mingming Q, Futing S (2018). The Study of Characteristic and Genetic Model for the Anhydrite in Asmari Formation in A Oilfield, Iraq. Advances in Geosciences 8(4):748-755. |
|
|
Ishkin DZ, Nuriev RI, Davletbaev AY (2016), Decline Analysis/Short Build-up Welltest Analysis of Low Permeability Gas Reservoir. SPE 181974. |
|
|
Li Y, Li B, Hu Y (2009). The Application of Modern Production Decline Analysis in the Dynamic Analysis of Gas Condensate Reservoirs. Natural Gas Geoscience 20(2):304-308. |
|
|
Li Y, Wang Q, Li B, Deng X, She Z, Liu Z (2016). Fracturing Evaluation for Fractured-caved Carbonate Reservoir through Pressure Transient Analysis and Rate Transient Analysis. SPE 181850. |
|
|
Palacio JC, Blasingame TA (1993). Decline Curve Analysis using Type-Curves: Analysis of Gas Well Production Data. SPE 25909. |
|
|
Song B (2011). Rate Normalized Pressure Analysis for Determination of Shale Gas well Performance. SPE 144031. |
|
|
Sunday OI, Sunday BI, Oluwatoyin OA (2014). Pressure transient analysis of multiple leakages in a natural gas pipeline. Journal of Petroleum and Gas Engineering 5(1):1-8. |
|
|
Wang M, Yang D, Chen X (2018). Pressure dynamic analysis of low permeability reservoirs with deformed media. Journal of Petroleum and Gas Engineering 9(1):1-10. |
|
|
Wei P (2018). An Improved Production Data Analysis Method for Shale Gas Wells. SPE 192139. |
|
Copyright © 2024 Author(s) retain the copyright of this article.
This article is published under the terms of the Creative Commons Attribution License 4.0


