ABSTRACT
Fundamentally, all mathematical models employed in analysis of water-flooding performance implied assumptions to exclude one or more forces to cope with the reservoir heterogeneity. In the beginning of the survey, a series of sensitivity investigations were undertaken to examine the parameters that affect the water-flooding performance in stratified reservoirs. The factors were designed to measure the impact of each force that contributed in water-flooding process. The forces are: viscous force, the force of gravity and capillary forces. Additionally, the cross flow phenomena which result from the viscosity and gravity segregation are investigated. The parameters that affected performance to a high degree were sampled randomly to create a knowledge domain with specific inputs and target outputs. In this case, it was the final oil recovery factor by reservoir simulator tool. This domain is used as input (supplied solved problems) to the proxy model (artificial neural network) for adjusting the magnitude of the connections between the neurons during training process to generate a model that can predict the performance of the water-flooding in such reservoirs within a limited range with very minor percentage of error. This model can anticipate the performance of the water-flooding process in heterogeneous reservoir when supplied with 12 key parameters (mobility ratio, density of fluids, dipping angle, permeability ordering, heterogeneity degree, injection rate, reservoir thickness, porosity, and permeability in 3D and reservoir depth). The average absolute percentage of error is about 4.6% particularly and error standard deviation about 8.7% with correlation coefficient between result collected from simulation and ANN is about 99.1%, when the system parameters are within the range of data that was used during the training.
Key words: Secondary recovery techniques, water flooding, Neural Network, Stratified reservoirs.
Water-flooding is a popular secondary recovery method which is responsible for most oil produced beyond the primary recovery mechanisms (Willhite, 1986). It is widely used because it is highly effective and water is readily available in huge quantities and is inexpensive. For this reason, water-flooding has commanded considerable attention from the petroleum industry in attempts to improvise the process of oil extraction from the subsurface. Water flooding is used in oil reservoirs to increase the rate of oil production and oil recovery.
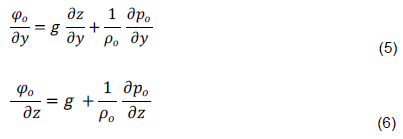
Modelling this process, especially in heterogeneous reservoirs such as the ones experience vertical stratification, is very tedious and cannot be done analytically since all governing forces cannot be included. In order to anticipate the performance of such process, we need a very good understanding of the subsurface in addition to accurately capture fluid behaviour under the reservoir conditions and rock fluid interaction properties.
With these has been said, huge cost of subsurface sampling (fluid and rock), well testing, 4D seismic acquisition, permeant downhole gauges for real time reservoir management, sophisticated data assimilation algorithms and powerful processors needed to develop good picture of reservoir and construct updated representative model which utilized to make decision of implementing such process as perfect secondary recovery techniques for system and manage it throughout the project.
The aim of this review is to predicate water flooding performance in stratified reservoirs using cheap qualitative correlation derived from data driven proxy model. While there are other predication techniques, data-driven proxy model is relatively modern and incorporates numerous parameters governing such techniques and leading to achievement of close and precise estimations of ultimate recovery factor. It also implicitly includes relevant theories and their applicability.
Since the discovery of water flooding technology in Pennsylvania in the early days of oil mining, several theories have been developed to explain the phenomenon. Each of the theories has their particular assumptions, limitations and drawbacks which need to be taken into account when used to predict the performance. In 1941, Leverett had presented in his paper the concept of fractional flow which became very important concept that has been used widely to estimate the performance of water-flooding. Buckley and Leverett (1942) were the first to develop a theory that was published 1942. Basically, Buckley and Leverett’s theory is considered to be one dimension displacement model. To cope with the reservoir heterogeneity, Stiles (1949) published the first technique to predict the performance of the water flooding in stratified reservoirs. His method is solely valid for reservoirs with unity mobility ratio or very close to unity. The main assumption in his method is that the absolute permeability for each layer is the only parameter control for the velocity (the velocity is solely proportional to layers’ absolute permeability) and the system is non- communicating. Dykstra and Parson (1950) extended Stiles' work in 1951 in attempts at estimating the flood sweep efficiency for non-communicating stratified reservoirs for different mobility ratios.
This was the first work that published to explain the vertical stratification reservoirs with mobility ratio larger or lower than unity. Additionally, they provided basic equations which were used to predict the performance and a method to handle stratification. Besides, they introduced their coefficient (VDP) to characterise the degree of permeability variation in the vertical direction.
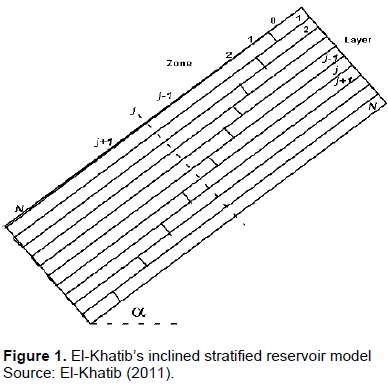
In reality, it is rare to find such stratified reservoirs consisting of discrete layers that are completely isolated. Even though in most circumstances there is a thin impermeable layer which lies between the outer layers due to depositional process, it is usually discontinuous and there is spatial communication between layers. Such reservoirs are called communicating stratified reservoirs. Ignoring cross flow between layers is also assumed in the all models presented above. Hiatt (1958) was the author of the first paper predicting of water-flooding performance in the stratified reservoirs with complete cross flow. El-Khatib (1985) presented an extension to Hiatt’s work by publishing a model which takes into account the variation in the other rock parameters other than the variation in permeability. He investigated the difference between the communicating and the non-communicating system and compared their impacts on the water-flooding performance. All the above mentioned theories deal with the horizontal reservoirs. Naturally, due to tectonic movements and depositional environments the oil traps, reservoirs usually exhibit an inclination from the horizontal. The reservoirs which dip from the horizontal with an angle cause the water to be injected in an up or down dip direction. El-Khatib (2010) presented a mathematical model to account for the effects of the gravitational forces in terms of dipping angle and the density difference between the driving and the driven fluids. El-Khatib’s model (the model is demonstrated in the Figure 1) includes equations to predict the performance of the inclined reservoirs and their permeability variation and relies on log-normal distribution. He accounted for the inclination by including the effect of the density difference and the dipping in form of dimensionless number. All aforementioned models and other mathematical models failed to incorporate all the forces that are responsible for immiscibly of displaced hydrocarbons by water in production wells. Conventionally, the geological properties are not uniformly spatially distributed. For this reason, the models ignore either one or more forces to simplify the mathematical approach towards solving this mechanism. The only available tool that can model all the main forces is the reservoir simulation tool.The construction of the full model to simulate behaviour of the reservoir can be done by coupling laws of mass conservation, momentum and energy. Fundamentally, the two phase continuity flow equations for the oil and water, Equations 2 and 3 can be solved to evaluate pressure distribution in a typical reservoir as function of time. The results can be coupled with Darcy laws to calculate phase flows and time relationship. Since there are four unknowns in the equations (So, Sw, Po and Pw), the simulator needs two more equations to couple them with flow equations for oil and water and solve those equations simultaneously for predicting the performance.
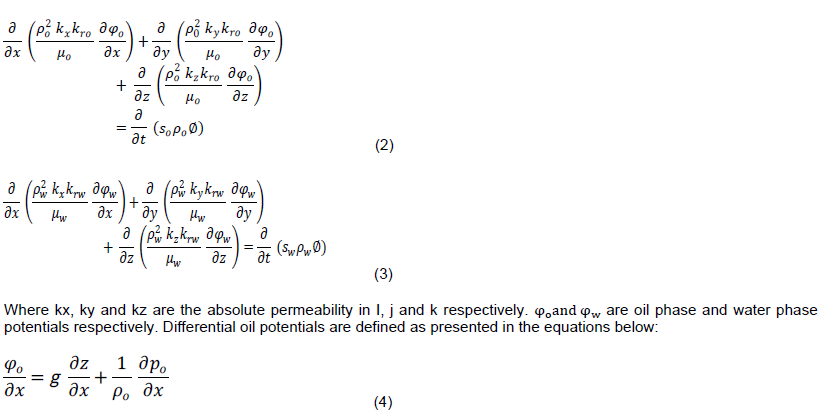
From the above equations, oil pressure, water pressure and the saturations for water and oil need to be involved in the equations. Capillary pressure, (pc=po-pw) and total saturation (so+sw=1) are also included in solving two phase differential equations (Hebb, 1949).
The simulator is used daily by reservoir engineers since it yields good estimations that simulate the dynamic behaviour of the reservoir. However, despite its prominence and importance the reservoir simulator still contains considerable degree of uncertainty due to geological heterogeneity and the parameters are not accurately measured. Moreover, reservoir parameters are not static and keep changing throughout life of the reservoir. As a result, this leads to ill model that has to be updated with respect to time by using data assimilation for tuning the model to reproduce the past (history matching process). Due to the large number of parameters in model, a huge number of combinations are included to tune the model which may accurately match the past but at same time forecast totally wrong future. Clearly the reservoir simulation model parameters are definitely not well defined or inexact as measured at the initial conditions. This parameterization issue is continuous with time as the physical properties of the system change with time not to mention the complex ill-posed inverse problem of the reservoir simulation (El-Khatib, 2010).
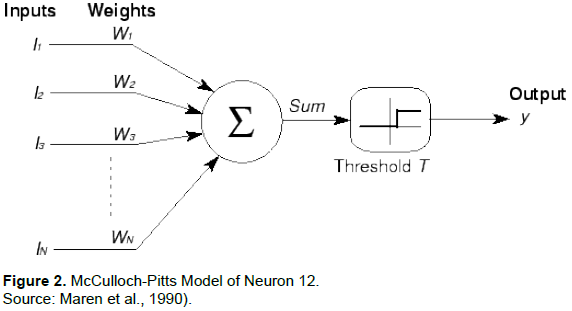
There are newer techniques applied to solve these problems like downscales or full data-driven black box models. Lately, they yield very promising result. Nowadays, neural network technique is increasingly implemented to handle reservoir behaviour complexity and nonlinearity. Data-driven proxy model is a neuro-computing technique of regression that was introduced by McCulloch and Pitts (1943). They replicated the way of processing information by human brain to perform some arithmetic operations. They presented the loosely-connected processors ability of sufficiently performing any logic operation with minimal percentage of error. The implementation of the modern neuro-computing can be traced back to 1960s. The neural network consists of the following (Braunschweig and Day, 1995):
1) Multiple processors of either independent or connected computers each possessing local memory or being implemented in software to process data independently
2) Unidirectional connections to connect the processors for transferring information either by physical wire or simulated by software.
3) Each processor has many inputs. As such, information from other processors is summed up to evaluate the mathematical equation that is used as a transformational function. The result of the transformation function is the only single output from the processor.
4) Lastly, the learning rule to train the network either by adjusting the local memory of physical processor or modifying the connections strength to optimise it and find the best solution for the problem.
This model is also known as the linear threshold gate. As such, it consists of a set of inputs of a given output, say y. The inputs have the following order I1, I2, I3, I4,…,Im.. This model classifies the set of inputs into two different categories and in so doing render the output y binary. It can be illustrated in Figure 2 as follows:
The artificial neural network (ANN)-based models are applied widely in industry to model nonlinearity such as the identification of injector-producer relationship identification and flow units characterization between injection-production wells (Lee et al., 2008). In the light of production optimization field, the ANN has been widely implementing in anticipating and optimizing the well performances in different kind of reservoirs with wide range of heterogeneity degrees (Bansal and Ertekin 2013). It is also used in correlating the reservoir fluid properties without physically relating to the independent variables to lower the cost of field sampling and expensive laboratory experimental procedures. Naseri et al. (2012) published ANN-based correlation to predict the viscosity of crude oil at different operation conditions and isothermal subsurface temperatures and it gave a promising result in estimating the viscosity of the large set of Iranian crudes. Nada et al. (2012) conducted a survey by collecting 104 real data sets to validate propagation of neural network to derive correlation that predicts bubble point pressure for Iraqi fields with average error percentage about 6.5%. This data processing techniques has recently been used as a hybrid with other artificial intelligent techniques such as fuzzy logic (FL) and genetic algorithm (GA) to enhance neuro-computing technique. Abdelrigeeb et al. (2014) have presented novel comprehensive study derived from hybrid system of a genetically optimized neural network (GA-ANN) and Neuro-Fuzzy (NF) modelling techniques to estimate bubble point pressure parameters and eventually they introduced an expert system.
AI techniques are used widely in improving oil recovery (IOR) as well. Ghoodjani and Bolouri (2011) correlated the final oil recovery factor as function of porosity, pore throat size, viscosity ratio for stratified reservoir at constant injection rate for pore scale water-flooding process. EOR processes have drawn too much attention from the industry lately due to costly and time consuming experiments to investigate fluid and rock behaviour under wide range of operating conditions. As a result, the minimum miscible pressure (MMP) is considered as the main parameter that governs the efficiency of miscible gas projects, there are many predictive MMP correlations presented for miscible CO2 flooding based on regression of laboratory data. Amin et al. (2013) used modern neuro-computing techniques called Least-Squares Support Vector Machine (LSSVM) for impure and pure CO2 systems and their MMP result showed near perfect match
with slim tube displacements and rising bubble apparatus (RBA) experiments result.
For the reservoir management and surveillance topic, a complex simulation model with acceptable level of representation is the cornerstone. The uncertainty associated with developing geological models, fluid behaviour and reservoir conditions affect the output significantly. In addition to data dimensionality and model complexity, the manner of processing the data leads to huge computational costs. The artificial intelligent techniques coupled with data mining are lately utilized to reduce the reservoir simulation’s problems without causing under-modelling issues. They are collectively known as surrogates for full reservoir simulation model either on well level by reproducing only production and injection data or mimic the model dynamic parameters by allocation the pressure and saturation in all spatial discretization grids for every time step (Mohaghegh et al., 2012, 2014). The novelty is in the implementation of such techniques to systematically model the flooding mechanisms by correlating the properties affecting the main governing forces coupled with reservoir physical characterizations for rapidly and accurately predicting its feasibility.
Prologue
In this study, objectives were accomplished using CMG (WINPROP, IMEX and CMOST) which is a black oil three-dimension reservoir simulator. Firstly all massive simulation studies were run and presented here were designed to investigate the impact of the vertical heterogeneity, mobility ratio, dipping angle, layers permeability ordering, injection rate and density difference between the displacing and displaced fluids. The cases are aimed at capturing the effects of these parameters on the main three forces which govern the performance of the water-flooding in stratified reservoirs. After all parameters allocated, they are used as input to neural network model and optimize it to accurately duplicate the final recovery factor anticipated.
Simulation model description
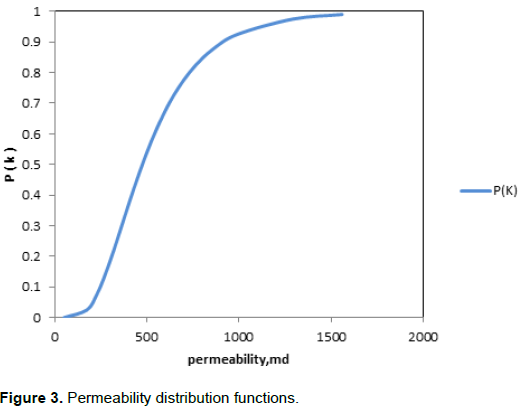
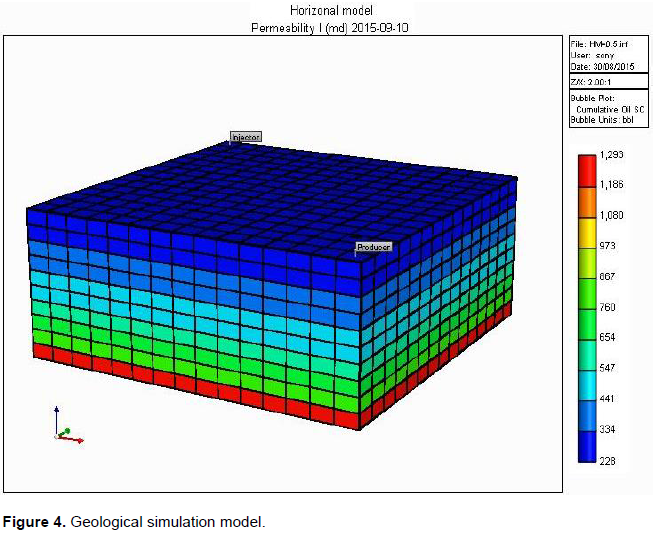
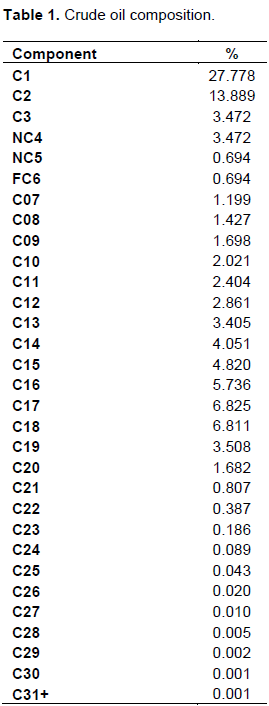
The geological model (Figure 4) of reservoir is described by a model with dimensions 1500*1500*300 in the X*Y*Z dimensions respectively. The model is divided in terms of grid cells (reservoir gridding) to generate 15 cells in x direction, 15 cells in Y direction and 10 simulation cells in Z direction in order to get rid of all numerical dispersion problems. The reservoir is constructed from discrete layers. Each layer has different horizontal and vertical permeability. The permeability variation in vertical direction is characterized by Log-Normal distribution with VDP=0.4 demonstrated in Figure 3 and the geometric permeability average is equal to 475 md. The reservoir model contains one well to inject the water and another one to produce the oil as shown in Figure 4. The injection well (I) was located in the cell (1,1) to inject the water up dip direction in the cases where the reservoir is inclined and the production well (P) was located at cell (15,15). The top of reservoir is located at 4300 ft in term of reservoir depth and the initial pressure at 4450 ft is set to be 4000 psi. The shallowest depth with 100% water saturation being at 5200 ft. The production was started simultaneously with the injection operation at (10 Sep 2015). The reservoir was depleted at maximum fluid production rate equal to 3500 bbl/day and the water was injected at 3900 bbl/day of water. These operation constrains were applied to keep depleting the reservoir above its saturation pressure. The model was running for 15 years. The reservoir porosity is set to be constant 0.3 throughout the reservoir. PVT properties for oil and the gas which used in the model are created using the winpop software and the hydrocarbon composition used are presented in Table 1. In term of interaction fluid- rock properties, the model of well sorted consolidated sandstone exponents=3 is used.
Sensitivity cases description
Seven simulation studies were conducted to examine the effects of vertical heterogeneity, the factors which control the gravity dimensionless number, cross flow between the adjacent layers, the layers permeability order and the mobility ratio on the performance of the water-flooding is such reservoirs which exhibited the stratification:
1) The first three cases were designed to examine the impact of reservoir dipping angles with including the effect of mobility ratio. All the rest of properties are set to be replica to the base case model. In addition to horizontal model, the water-flooding in 30, 45, -30 and -45 (Figure 5 demonstrate the inclination cases) inclined models were simulated for mobility ratios 5, 1 and 0.5.
2) The case 4 was solely designed to investigate the impact of density different between displacing and displaced fluids. The simulation study was conducted on horizontal communicating models with the density of the crude oils are (40, 55 and 60 lb/ft3). The mobility ratio set to be 0.5 for all studies.
3) The purpose of study number 5 is to examine the gravity cross flow which depend on the actual permeability ordering of the layers in the reservoir. The evaluation of the bouncy effect can be achieved by randomly assigning the layers permeability without any order. In addition to the base case and fining downward case models (all the cases are shown in Table 2).
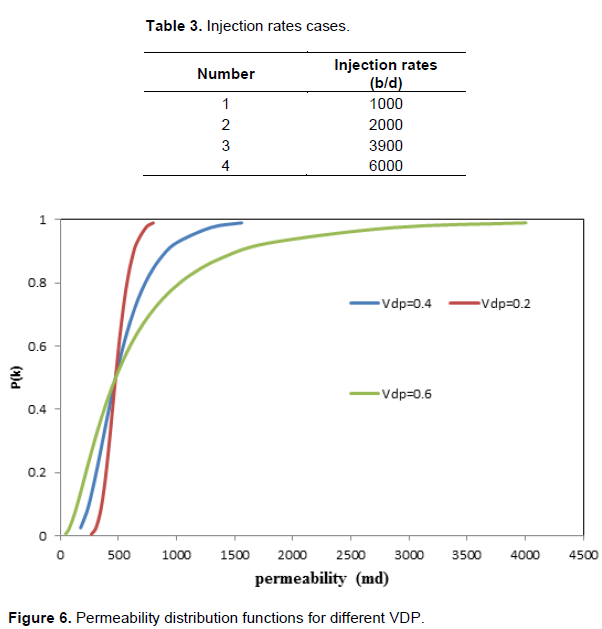
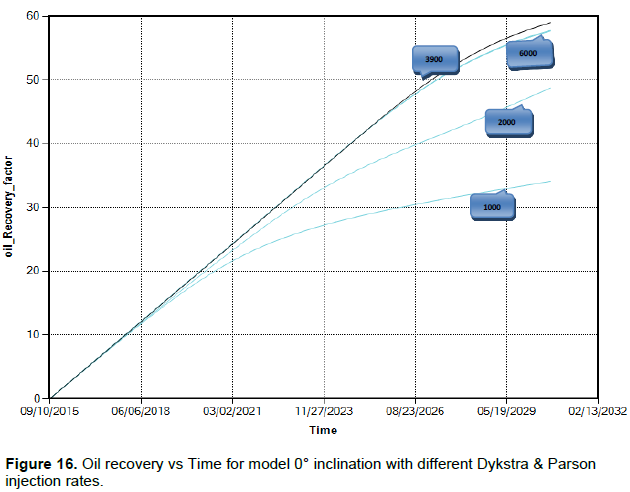
4) The injection rate considered to be one of the main control factors and have major effect on the gravity forces. However increasing of the injection rate normally leads oil recovery factor to get higher. Virtually injection rate should not exceed the critical value. The values of injection rates used in this study are shown in Table 3 and all the cases were carried in horizontal model with mobility ratio equal to 0.5.
5) The horizontal permeability variation in the vertical direction has significant effect on the performance of the water-flooding. To investigate the effect of the degree of the reservoir heterogeneity and since the permeability is represented by log-normal distribution. The layers permeability was generated using log-normal distribution with VDP equal to 0.2 and 0.6 in addition to the base case. The horizontal base case model was used to examine the effect of the permeability variation degree. The permeability distribution functions are demonstrated in Figure 6.
ANALYSIS OF SIMULATION RESULT
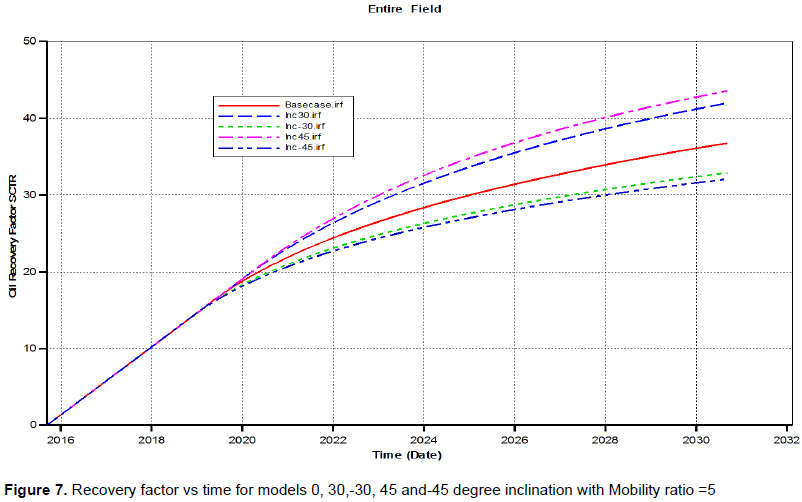
There was a positive correlation between the recovery factor and the reservoir dipping angle. It was observed that an increase in recovery factor was positively related to the dipping angle of reservoirs. Figure 7 is a plot of gas recovery factor against time with different reservoir inclinations and a mobility ratio of 0.5. The increased recovery factor is attributed to the gravity forces particularly in this permeability depth configuration by withdraw the water from the top layers to adjacent ones that led to reduction of the water velocity in those layers by (ρg sinα). Furthermore, reshaping the flood front by gravity cross flow eventually sharpened the flood front leading to delayed water breakthrough and displacement of more crude from the rocks to wells.
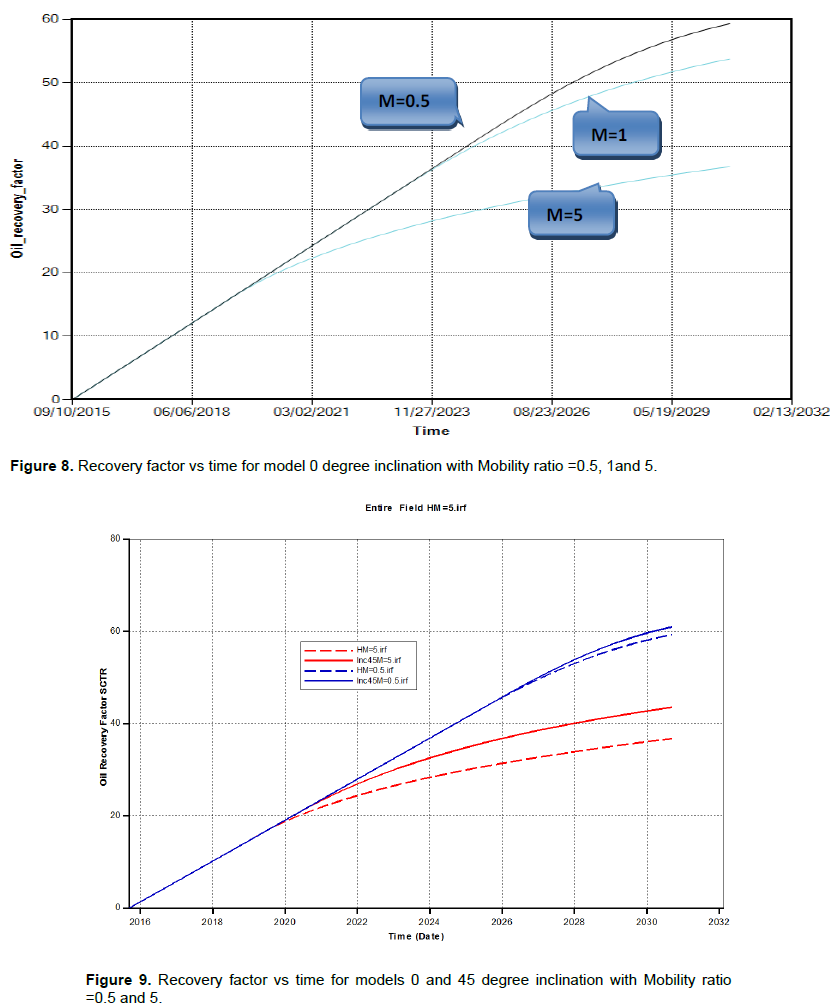
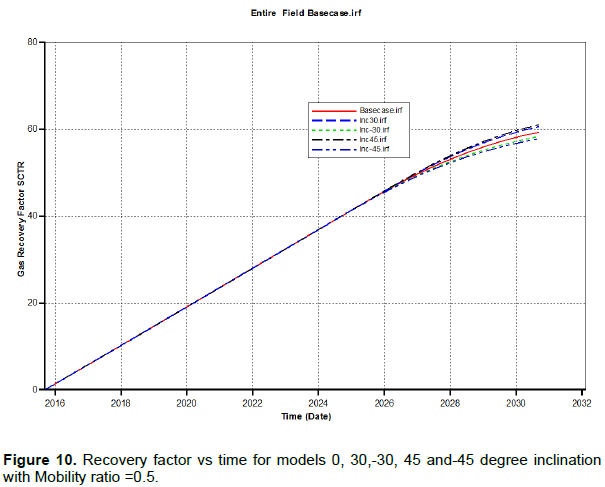
Oil recovery has an indirect proportional relationship with mobility ratio as can be noticed in Figure 8. As such, an increase in mobility ratio leads to a decrease in oil recovery and vice versa. Gravity decreases the water velocity since the up-dipping injection is more pronounced in the case with higher mobility ratio (M=5) than with a favourable mobility ratio (M=0.5). Figure 9 illustrates this argument. With higher mobility ratio, the gravity force sharpens the front and delays the water breakthrough. On the other hand, with lower mobility ratio, the gravity has minor impact since the flood front is already sharp and recovered oil is high. Typically, the oil recovery increases as the mobility ratio decreases as clearly demonstrated in Figure 10.
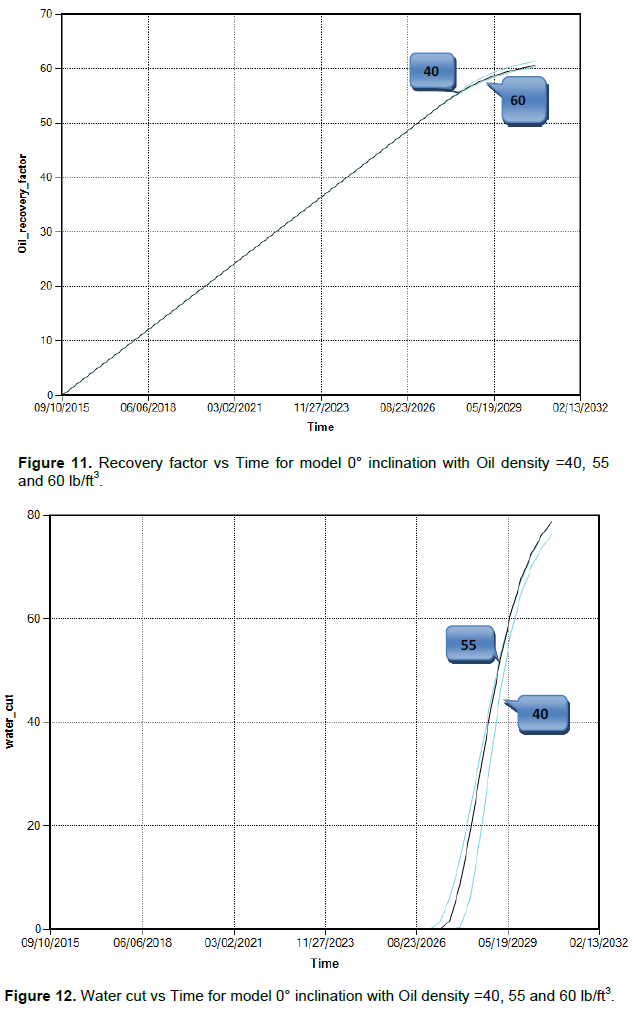
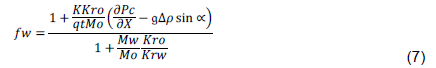
The increase in density difference between the displaced and displacing fluid enhances the oil recovery, Figure 11. The term which represents the density difference appears in the fractional flow equation for inclined reservoirs, Equation 7. As this difference increases, it lowers the water cut (Figure 12) and increases the oil recovery.
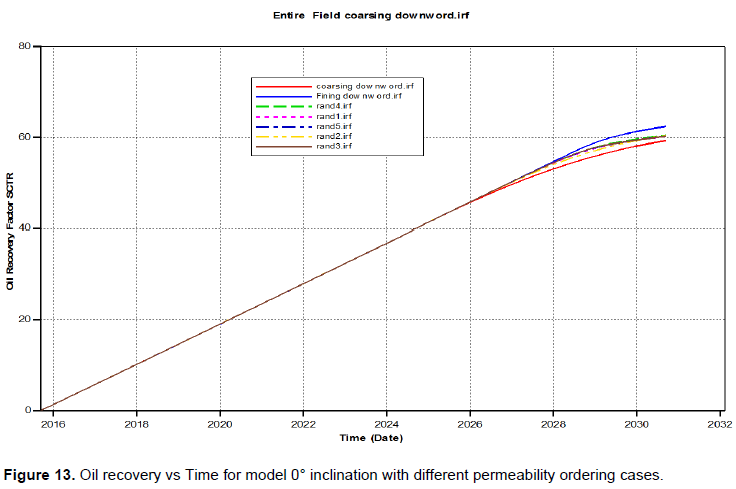
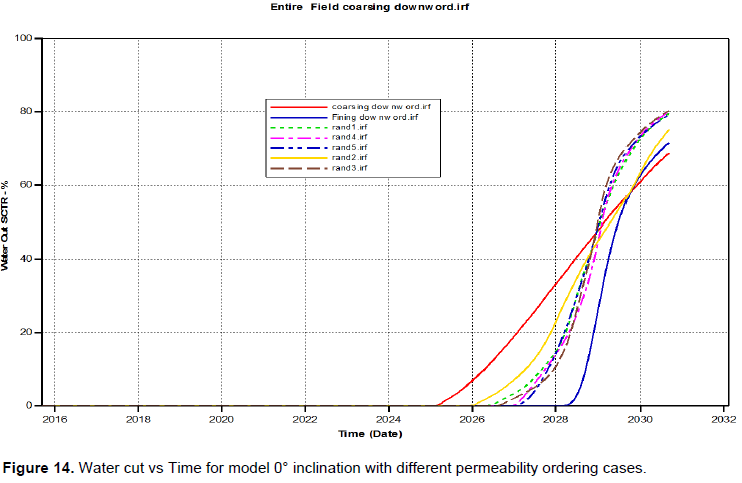
Basically, the force of gravity increases water saturation in the bottom layers through withdraws of water from the top layers towards the bottom. The domination of the gravity force is dependent on permeability-depth configuration and Kv/Kh ratio. In the case where the permeability decreases with depth, the front advances slower in the top layers due to downward drainage. This effect sharpens the front and enhances the performance as illustrated in Figure 13. Additionally, the cross flow between the layers due to the bouncy effect is the greatest in the fining downward case. The bouncy drives the oil to flow upward while the water segregates downward which delays the front advance. The magnitude of the bouncy effect on the performance significantly relies on the area which opens to the gravity segregation. The extension of this area depends on the permeability contrast between the adjacent layers. For the opposite permeability configuration, the performance gets worse since the gravity effect improves the water velocity in bottom layers which accelerates the water breakthrough. In principle, the gravity force improves the recovery as permeability decreases with depth and vies versa. In the case where the permeability is randomly distributed with depth (that is, permeability alternately increase and decrease with depth), the incremental oil recovery as permeability decreases with depth tends to be compensated with the reduction in the recovery brought about by the opposite permeability configuration. As the result of this compensation, the random permeability distribution tends to have minor effect on the performance. The fining upward case is the worst case since it accelerates the water breakthrough and increase the water cut (Figure 14).
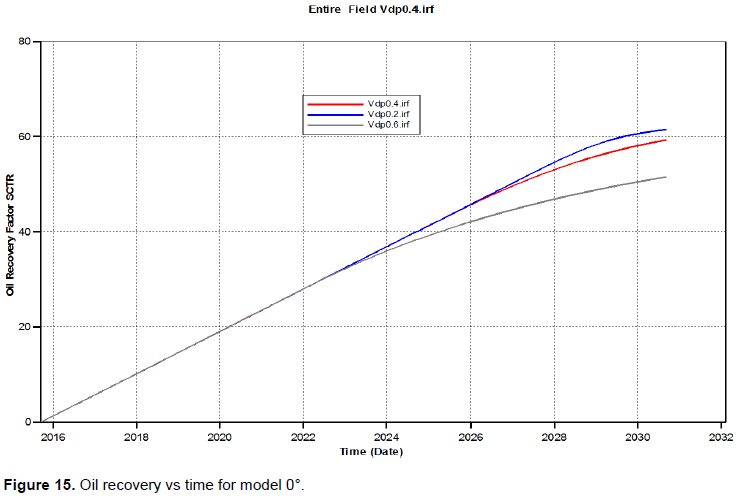
The performance of the flood worsens as the Dykstra-Parson coefficient increases because the reservoir became more heterogeneous as the permeability variation increases (Figure 15).
Lastly the, injection rate sensitivity, the recovery factors improve as the water injection rate increases and it is summarized in Table 3 and demonstrated in Figure 16. The optimum recovery factor is obtained at injection rate 10000 b/d. Principally, similar displacement processes depended on the viscous and gravity forces, the higher injection rates such 12000 and above, tend to accelerate the water velocity in layers with high absolute permeability. This rapid movement leads to reduction of the gravitational cross flow ending up with earlier breakthrough and poor performance. The critical value of surface rate for this system is (3200 b/d).
NEURAL NETWORK DESCRIPTION
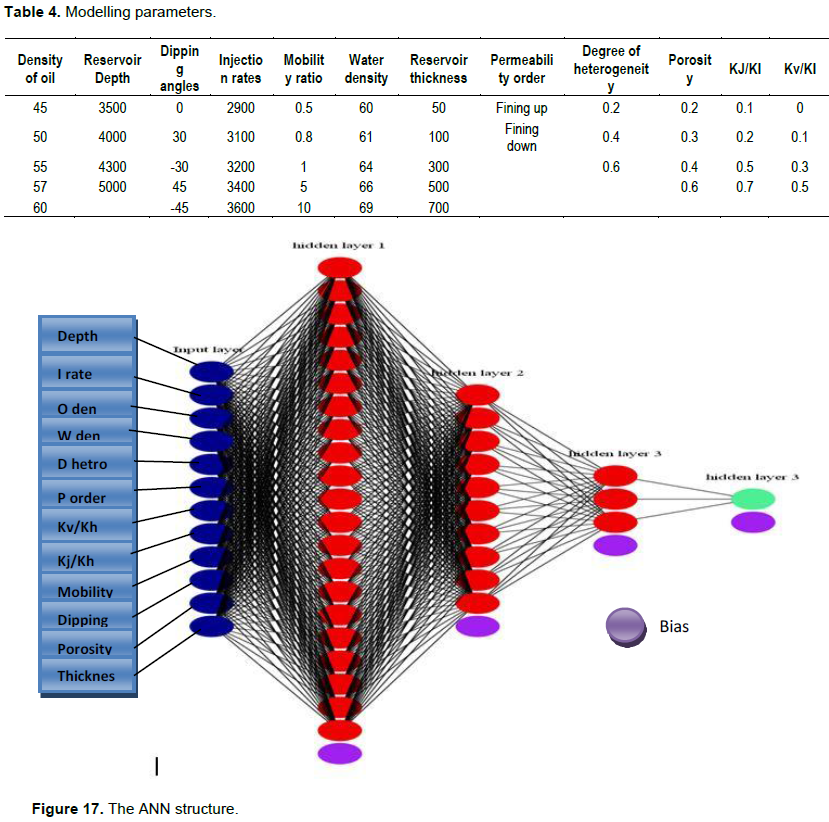
Based on the above sensitivity study, the physical properties that affect the cross flow due to viscous and gravity forces were randomly changed by CMOST software with Latin Hypercube method used as the sampling method to generate more than 3000 solved examples. Those solved cases were supplied to the network for training and being used the neural network input layer (Table 4). Regarding training algorithms, back propagation model was trained and used by Levenberge (1944) as the learning rule to distribute the strength of connections between the neurons. The LOGSIG function is used as the neuron activation function in all neurons in the network. More than 70% of the supplied data were set for training and 30% of the set used for validation. Normal trial and error procedure used to define the structure of network. The optimum network structure was constructed from input layer with twelve parameters. The network also consisted from three hidden layers each one contain 21, 10 and 3 neurons respectively and the output layer with the final oil recovery factor as the only result , see figure 16. Mainly the best network that anticipate the recovery factor with the deviation of predicated values from real supplied information characterized with R2=0.99543 which give the lowest variation domain of output data (Figure 17).
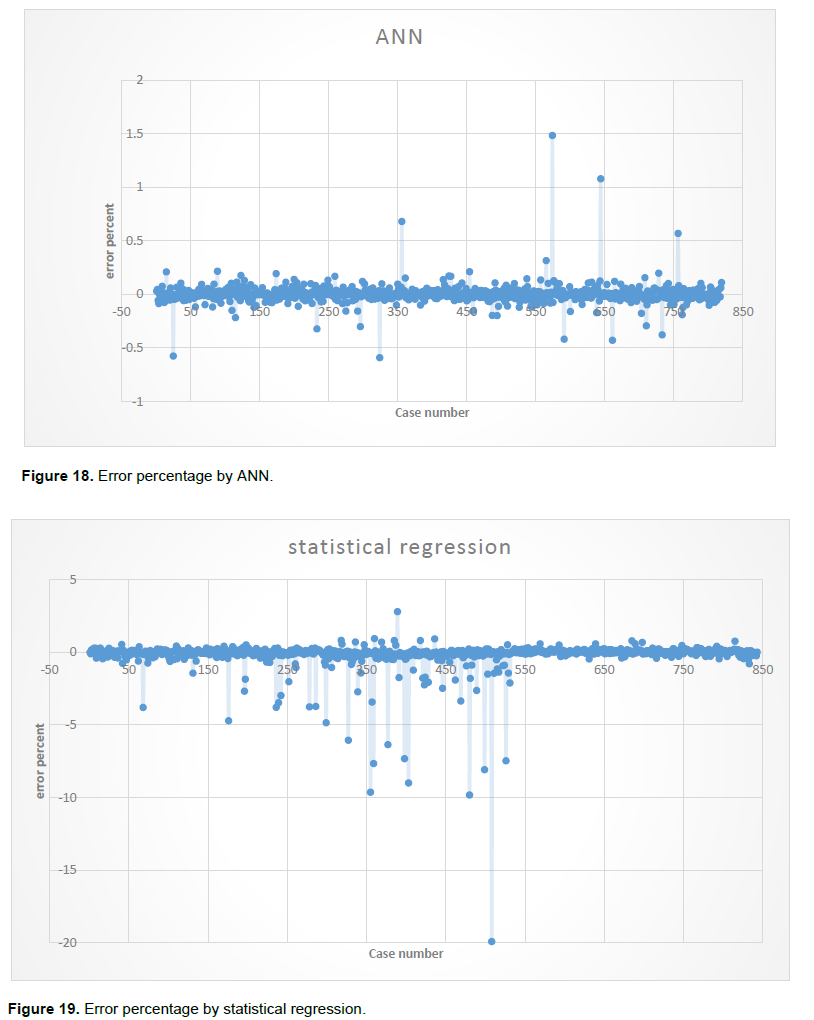
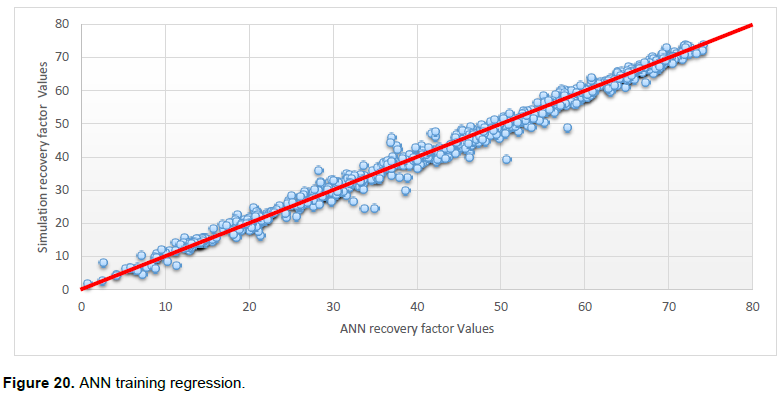
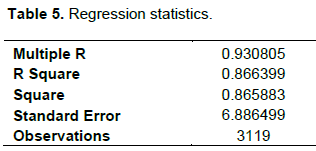
All the simulation runs results were used again to correlate the aforementioned parameters with ultimate recovery factor by using polynomial regression technique, the Equation 8 describe this relationship mathematically. Finally the two models, ANN and polynomial, were deployed to new 100 simulation runs cases to anticipate the ultimate recovery factory. Generally, the regression by neurocomputing technique yield to very less percentage of error than statically regression with arithmetic average of the absolute error over more than 3000 cases equal to 4.6% and 23.2% respectively (Figures 18 and 19). The correlation smoothness between simulation and ANN result is very strong with 99.1% correlation coefficient this can be clearly noticed from cross plot (Figure 20).
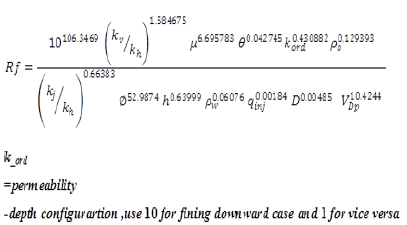
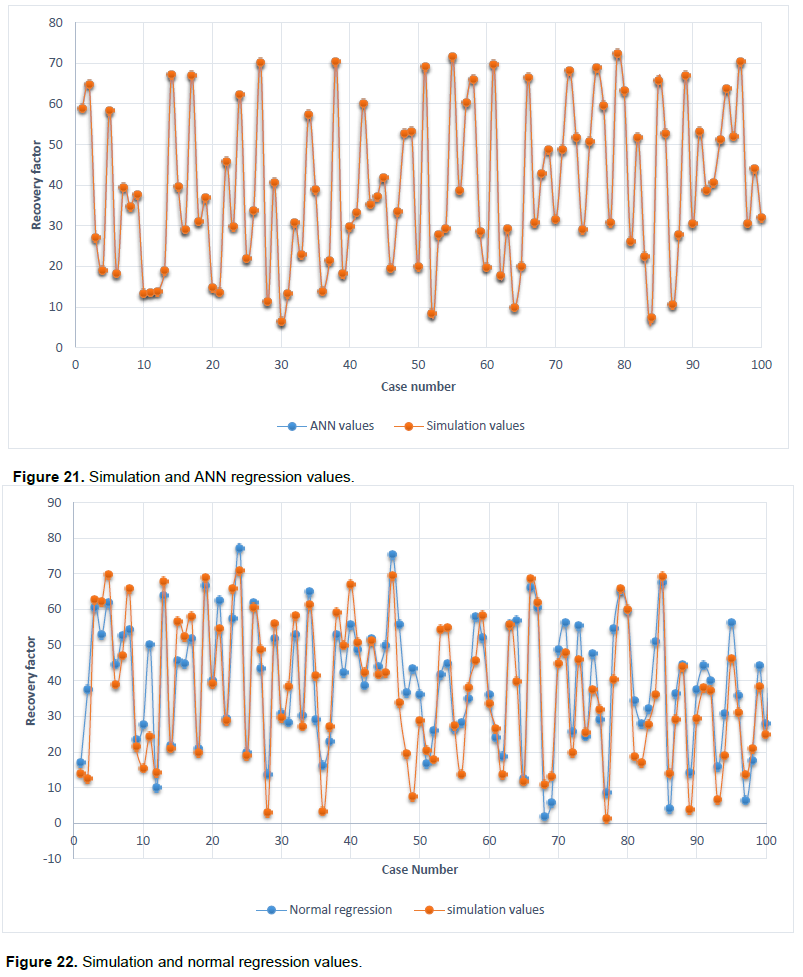
The statistical summary for polynomial regression is shown in Table 5. Even for the deployment data set, The anticipated values by artificial neural network agreed with the simulations results (Figure 21), on the other hand the polynomial regression result fluctuate with good modelling at some ranges to very bad matching at others with high variation domain (Figure 22). For this reason, it gives the proxy model a basis for predicting the oil recovery factor for reservoirs implementing water flooding as enhanced oil recovery method just by plugging in the reservoir model description and injection operations parameters.
Although this data driven model gives a good first estimation of the recovery factory it under-models all the reality in term of the physics of the reservoir and does not take into account any parameter outside the training data set or beyond its quality which is solely dependent on quality of the training. In the course of the accuracy, it cannot accurately estimate any physical phenomena especially complex unforeseen parameters such as water break through time. All the models’ parameters are meaningless from the physics point of view.
In summary, predicating water flooding performance using the data-driven proxy model provides more reliable results than the traditional models that were proposed earlier. The main disadvantage of the correlation is their failure to predict correctly spatial and temporal pressure and fluid saturations as well as other reservoir phenomena’s.
In this survey, artificial neural networks model was used and the main advantage is that it incorporates most of the affecting parameters that can be easily measured at the sites. In fact, regression by ANN has extremely low error margins as compared to statistical regression as shown in figure 18 and 19. From Figure 21, it can be seen that simulation results significantly agreed with those obtained via ANN. However, it does not take into account parameters not included in the training set which is a major shortcoming. Additionally, ANN cannot estimate particularly unanticipated reservoir parameters such as water breakthrough. In the light of the high degree of agreement between simulation results and ANN, it can be concluded that the precision, accuracy and capacity of ANN in predicating water flooding performance is reliably dependable.
Future studies
1. Including the effect of the cross flow between the strata due to capillary pressure forces which dominated in specific kind of the reservoirs where there is high capillary pressure contrast in the adjacent layers. In such reservoirs, the system tries to establish the capillary equilibrium by drawing the water from the loose layers to the tighten ones.
2. Enhancing the performance of the network by extending the training parameters to include others like (irregularity of the reservoir area, continuous heterogeneity in X,Y and Z directions, number of injections and producing wells and flood pattern).
The authors have not declared any conflict of interests.
ANN= artificial neural network
Bo = oil formation volume factor, RB/STB
Bw = water formation volume factor, RB/STB
C = flow capacity, fraction
cf =Rock compressibility, psi-1
Cn = total reservoir coverage or vertical sweep efficiency, fraction
Co =Oil compressibility, psi-1
Ct =Total reservoir compressibility, psi-1
Cw= Water compressibility, psi-1
D= reservoir depth,ft
fw = fractional flow, fraction
h =Total reservoir thickness, ft
K =Reservoir permeability, mD
Ø = porosity, fraction
θ= reservoir dipping angle, degree
qt , qinj = total water injection rate, bbl/day
ρo= Oil density, lb/ft3
ρg =Gas density, lb/ft3
ρw =Water density, lb/ft3
Rf= Oil recovery factor, fraction
S0= oil saturation, fraction
Sw = Water saturation, fraction
T =Reservoir temperature, °F
ð›o= oil viscosity, cp
ð›w = water viscosity, cp
VDP= Dykstra-Parson variation coefficient, dimensionless
Wc= water cut
Xf = the relative position of the flood front, dimensionless
Subscripts
i = x direction
j = y direction
k = z direction
REFERENCES
|
Abdelrigeeb A, Al-Gathe A, Abd-El F, El-Metwally A (2014). New artificial intelligent approach for bubble point pressure. Int. J. Innov. Sci. Res. 4(2):121-135.
|
|
|
|
Amin S, Milad A, Farhad G, Amir H (2013). Intelligent model for prediction of CO2 – Reservoir oil minimum miscibility pressure. Elsevier 2:375-384.
|
|
|
|
|
Braunschweig B, Day R (2010). Artificial Intelligence in The Petroleum Industry, Symbolic and Computational Applications handbook.
View
|
|
|
|
|
Bansal T, Ertekin Z, Karpyn L, Ayala1 A, Fnu S, Balogun D, Liebmann Q (2013). Forecasting Well Performance in a Discontinuous Tight Oil Reservoir Using Artificial Neural Networks. SPE Unconventional Resources Conference - Woodlands.
Crossref
|
|
|
|
|
Buckley S, Leverett MC (1942). Mechanism of Fluid Displacement in Sands. Trans., AIME. pp. 146-107.
Crossref
|
|
|
|
|
Dykstra S, Parsons R (1950). The prediction of oil recovery by waterflood. Secondary recovery of oil in the United States 2:160-174.
|
|
|
|
|
El-Khatib N (1985). The Effect of Crossflow on Waterflooding of Stratified Reservoirs (includes associated papers 14490 and 14692 and 15043 and 15191). Soc. Pet. Eng. J. 25(02):291-302.
Crossref
|
|
|
|
|
El-Khatib N (2010). Waterflooding Performance in Inclined Communicating Stratified Reservoirs. PAPER SPE 126344 at SPE North Africa conf held in Cairo Egypt.
Crossref
|
|
|
|
|
El-Khatib NAF (2011). Waterflooding performance in inclined communicating stratified reservoirs. PAPER SPE 126344 at SPE North Africa conf. Paper SPE 140960 at SPE Middle East oil and gas show, Manama Bahrain.
|
|
|
|
|
Ghoodjani E, Bolouri S (2011). Prediction of water-flooding performance in core scale: comparison of numerical simulator, neural network and correlation. Braz. J. Pet. Gas (5)209.
Crossref
|
|
|
|
|
Hiatt N (1958). Injected-Fluid Coverage of Multi-Well Reservoirs with Permeability Stratification. Drilling and Production Practices.
|
|
|
|
|
Lee K, Ortega H, Nejad A, Ershaghi I (2008). A method for characterisation of flow units between injection-production wells using performance data. SPE 11422.
|
|
|
|
|
Levenberg K (1944). A method for the solution of certain non-linear problems in least squares. Quart. Appl. Math. 2:164-168.
Crossref
|
|
|
|
|
Leverett M (1941). Capillary Behavior in Porous Solids. Trans., AIME. pp. 142-152.
Crossref
|
|
|
|
|
Maren A, Harston C, Pap R (1990). Handbook of Neural Computing Applications. Academic Press.
|
|
|
|
|
McCulloch S, Pitts W (1943). A Logical calculus of the ideas immanent in nervous activity. Bulletin Math. pp. 115-133.
Crossref
|
|
|
|
|
Mohaghegh SD, Amini S, Gholami V, Gaskari R, Bromhal G (2012). Grid-based surrogate reservoir modelling (SRM) for fast track analysis of numerical reservoir simulation models at the grid block level. SPE Western Regional, Bakersfield, California.
|
|
|
|
|
Mohaghegh SD, Amini S, Gholami V, Gaskari R, Bromhal G (2014). Pattern recognition and data-driven analytics for fast and accurate replication of complex numerical reservoir models at the grid block level. SPE Intelligent Energy Conference and Exhibition held in Utrecht, the Netherlands.
|
|
|
|
|
Nada S, Ahmedzeki IM, Ridha YM, Ali ZT, Abid A (2012). Development of PVT correlation for Iraqi crude oils using artificial neural network. Ir. J. Chem. Pet. Eng. 13(3):1997-4884.
|
|
|
|
|
Naseri A, Yousefi S, Sanaei A, Gharesheikhlou A (2012). A neural network model and an updated correlation for estimation of dead crude oil viscosity. Braz. J. Pet. Gas. 6(1):31-41.
Crossref
|
|
|
|
|
Stiles W (1949). Use of Permeability Distribution in Waterflood Calculations. Trans., AIME. 186:9-13.
|
|
|
|
|
Willhite G (1986). Waterflooding. SPE Textbook Series. 3:139-145.
|
|