Full Length Research Paper
ABSTRACT
Successful crop production requires the knowledge of soil variation and the evaluation of the agricultural potentials of the land. Detailed land resource survey of approximately 100 ha land in Abeokuta North Local Government Area of Ogun State was carried out. Identified soil mapping units were examined in modal profiles. The soils were classified using the USDA Soil Taxonomy, FAO/IUSS World Reference Base (WRB) system and local soil series methods. Five soil mapping units were identified and were classified as Ilaro Series (Kanhaplic Haplustalf), Ibeshe (Typic Kandiustalf), Kulfo (Udic Kandiustalf), Molo (Rhodic Kandiustalf) and Otteyi Series (Lithic Haplustept). The soils were classified as Alfisols (71.56%) and Inceptisols (28.44%). Land Capability Classification (LCC) revealed that Ilaro, Ibeshe and Molo series belong to Capability Class II while Kulfo series was Class III but Otteyi series is of non-arable Class VI. Otteyyi Series had severe limitations of very shallow soil depth, high slope gradient and high gravel content. The area has good potential for crop production if soil fertility can be managed with appropriate fertilizer application and seasonal water deficit ameliorated by supplemental irrigation. Otteyi Series that is non-arable could be used for farm buildings and other physical infrastructures or animal grazing.
Key words: Land evaluation, fertility capability class, soil series, limitations, arable cropping.
INTRODUCTION
Soils differ in their behavior due to differences in morphological, physical, chemical, biological and mineralogical properties (Msanya, 2018). These variations are due to differences in soil forming processes operating on different parent materials, under different climatic, topographic, and biological conditions over varying periods of time (Soil Survey Staff, 1993). In the past, decisions on land use are made indiscriminately based mainly on economic, cultural and political considerations, with little or no consideration for the biophysical status of the soils (Orimoloye et al., 2007; Nuga and Akinbola, 2011). The knowledge of the pattern of soil distribution and the characteristics of each unit of soil are very essential for a better understanding, use and manage-ment of soils (Ogunkunle, 2005; Lufega and Msanya, 2017). This will help maximize sustainable production and satisfy the diverse needs of society while at the same time conserving fragile ecosystems. A soil survey delineates the soil types in a given area, classifies soils according to a standard system of classification, plots boundaries of the soils on a map and makes predictions about the behaviour of the soils (Soil Survey Staff, 1993). The information is interpreted in land evaluation to assist the development of land use plans, evaluates and predicts the effects of land use on the environment (Shepande, 2002). The objectives of most soil survey investigations are to provide data for the rational planning and adjustment of land use patterns (Hubrechts et al., 2004).
Fasina et al. (2007) had observed an increasing demand for information on soils as a means to enhancing agricultural production in Nigeria. Soil characterization provides the information for our understanding of the physical, chemical, mineralogical and microbiological properties of the soils we depend on to grow crops, sustain forests and grasslands as well as support homes and society structures (Ogunkunle, 2005). Soil classification, on the other hand, helps to organize our knowledge, facilitates the transfer of experience and technology from one place to another and helps to compare soil properties. It is therefore pertinent that for the full potentials of an agricultural land to be maximized, there is need to have a good understanding of the different alternative uses that a land can be put as land use ought not to be based primarily on the needs and demands of users, but rather on the understanding of the suitability of each land for the intended use in order to achieve environmental sustainability (Nuga and Akinbola, 2015). There is therefore an urgent need for evaluation of agricultural lands and associated planning, owing to problems faced in recent years in the form of increasing pressure on agricultural lands from other uses, coupled with increasing demand for agricultural products due to population growth.
Soils of the Abeokuta North Local Government Area of Ogun State, Nigeria, are mainly of the sedimentary origin. Oral tradition from the locals indicates that the soils of the study area have been variously used at different times by peasants and institutions without any systematic soil study, leading to decline in yield and subsequent abandonment. A renewed interest in agricultural development by government and private investors has led to the allocation of large portions of this track of land to interested commercial farmers. A platform is thus created for a systematic soil study in this area to prevent seeds being sown on the proverbial ‘stony ground’. This study was carried out therefore to characterize the soils of the study area and assess the land for general arable cropping.
MATERIALS AND METHODS
Description of the study site
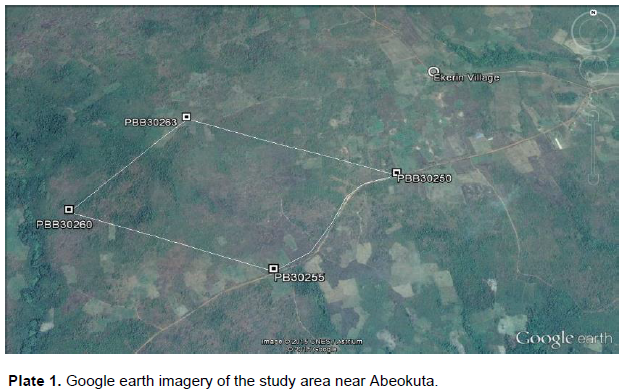
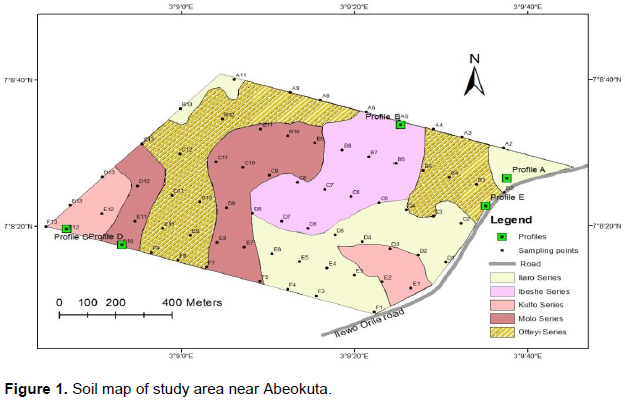
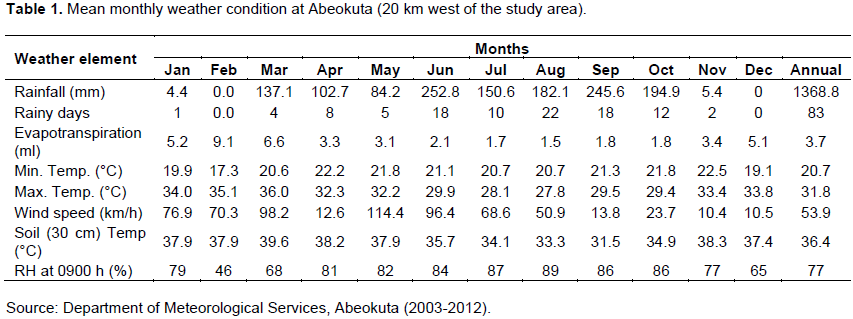
The study area by its geomorphic and landscape characteristics typifies a wide expanse of land covering over 200,000 ha of land spread across several local government areas including Egbado/Yewa North, Owode and Ewekoro LGAs. The detailed study was carried out on a rectangular shaped land area situated along JogaOrile and Ilewo-Orile earth road, west of Abeokuta town. It is defined between latitudes 7° 8'5.60"N and 7° 8'38.40"N and longitudes 3° 8'44.40"E and 3° 9'45.30"E. Plate 1 shows the satellite imagery of the study area and Figure 1 the location map of the study area. The study area is located within the Zone Q (Very humid Lagos-Benin-Asaba lowlands) of the Agro-ecological zones of Nigeria (Ojanuga, 2006). The mean annual rainfall of the area is about 1,368 mm (Abeokuta). Length of dry season ranges between 120 and 130 days. The mean daily maximum and minimum temperature of 32 and 21°C, respectively were recorded at Abeokuta (Table 1). The study area belongs to the sedimentary upland underlain by Tertiary and Cretaceous sedimentary rocks (mainly sands and clays, sandstone and shales) (Olabode and Mohammed, 2016). The land area is characterized by ironstone capped sandstones overlaying heavily mottled ferrugenized clay. The dominant land use type in the area is mainly cassava-based arable cropping.
Field studies
A rigid grid method of soil survey was adopted for the land resource survey in May, 2015. The extent of the area to be surveyed was determined with the help of a perimeter survey. Transects were laid out at 200 m apart and auger observations were taken at 100 m interval along the transects to ensure at least one observation in every 2 ha of land. Examination points were pre-determined in a GIS environment and the co-ordinates were pre-loaded into a Global Positioning System (GPS) devise with which the points were located on the field. With the aid of Dutch Soil Auger and Munsell Soil Colour Charts, the soils morphological properties were examined at soil depth intervals of 0 - 15, 15 - 30, 30 - 60 and 60 - 90 cm except where plinthite or hard pan did not permit augering to the depth of 90 cm. Thereafter, using the soil morphological and physical properties, similar examination points were grouped together at the series level to form mapping units. Five mapping units were identified. In each of the mapping units, modal profile pits were dug, described and sampled according to international standards of soil profile description (FAO, 1991). In addition, surface soil (0-30 cm depth) samples were collected at each auger examination point for soil fertility assessment. The soil samples were appropriately labeled and conveyed to the laboratory for processing and analysis for the physical and chemical properties of the soils. All necessary environmental information relating to the study area and the soil morphology were recorded on a proforma. A total of 84 soil samples made up of 26 profile and 58 surface soil samples were taken from the study area for analysis.
Laboratory analysis
The soil samples were air dried, crushed and sieved through a 2mm mesh. The gravel content (portion with particle size greater than 2 mm in diameter), was calculated as a percentage of the total air-dried soil. The particle size fractions were determined by the modified hydrometer method. The soil pH was determined in 1:1 soil: water ratio and potassium chloride (KCl) media using glass electrode pH meter. Organic carbon was estimated by Dichromate wet oxidation method of Walkley and Black (1934). Total nitrogen was determined by the micro-Kjeldahl method (Jackson, 1958). Available phosphorus was evaluated by Bray P1 method of Bray and Kurtz (1945), while exchangeable cations (Ca, Mg, K and Na) were extracted by neutral Ammonium acetate (NH4OAC). Calcium, Potassium and Sodium were measured through flame photometer, while Magnesium was determined by Atomic Absorption Spectrophotometer (Rhoades, 1982). Exchangeable acidity was determined by 1N KCl extraction and titrated with 0.05N NaOH solution (Black, 1975). Effective Cation Exchange Capacity (ECEC) was calculated by the summation of the values of exchangeable cations and exchangeable acidity. The micro-nutrients (Fe, Mn, Cu and Zn) were determined in normal hydrochloric acid (1N HCl) and evaluated using the Atomic Absorption Spectrophotometer (AAS) (Jackson, 1958). Base saturation was computed as the summation of the basic cations (Edmeades, 1982).
Soil classification
The soil types on the study site were identified, characterized and classified using two international systems (Keys to Soil Taxonomy by Soil Survey Staff, 2014; WRB System of FAO, 2014). The soils were also classified at the series level using the approach of Moss (1957) that described the soils of sedimentary deposits of Southern Nigeria. The modified Land Capability Classification (LCC) system of the USDA by Klingebiel and Montgomery (1961) was adopted for the evaluation of the study site for sustainable land management for arable crop production and general land use. Fertility Capability Classification (FCC) was carried out based on the results of laboratory analyses of the top soil samples, along with their morphological properties as outlined by Sanchez et al. (2003).
RESULTS
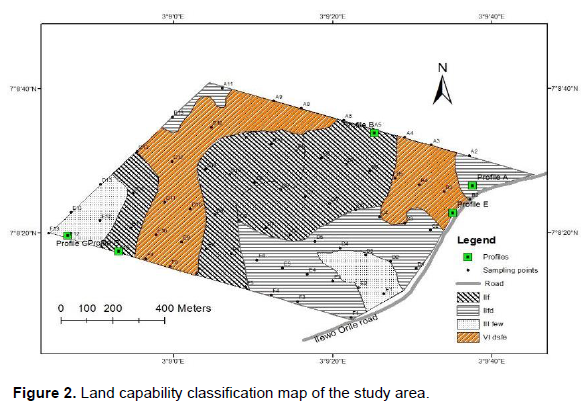
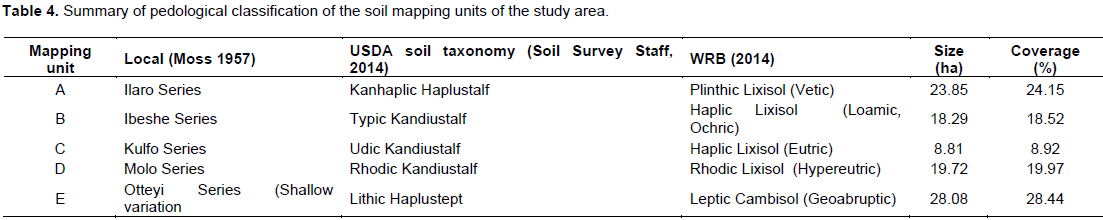
Five soil mapping units were delineated within the study area. The soils are generally sandy loam at the top with the clay content generally increasing with depth. The soil map of the study area is presented in Figure 2. The physical/morphological and chemical properties are presented in Tables 2 and 3, respectively while the pedological classifications of the soil are shown in Table 4.
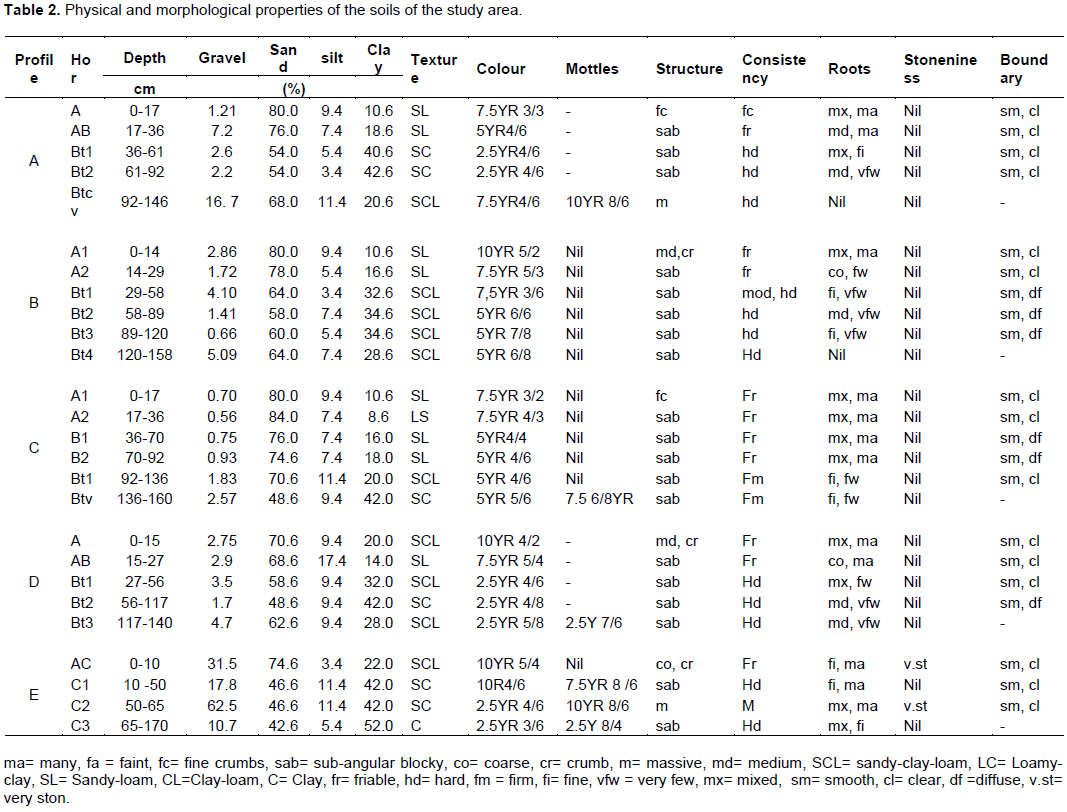
Soil physical and morphological characteristics
The soils Mapping Unit A was classified as Ilaro Series. The soils are well drained, friable to firm consistence with sub-angular blocky structure at depths from 17 cm. Theyare very dark brown (7.5YR 3/3 moist) at the top and become dark red (2.5YR 4/6 moist) at the subsoil. These are underlain by variegated yellow (10YR 8/6 moist) and strong brown (7.5YR 4/6 moist) mottled sandy clay loam plinthic layer that is not indurated but soft.
They possess appreciable amount of loose ferruginous and Fe/Mn concretions at depth from 92 cm. The soils of Mapping Unit B was classified as Ibeshe series. This mapping unit occupy about 18.5% of the total land area and is found on a gently sloping (4 - 6% slope) terrain underlain by ferruginous sandstone parent materials of the Eocene age and is located at the middle slopes of disintegrating laterite caps. The soils are well drained, deep and had no laterite or ironstone within the profile depth. Consistency is friable to hard (dry) with sub-angular blocky structure throughout the profile except the A horizon. The colour ranges from greyish brown (10YR 5/2) at the top to yellowish red (5YR 4/6) at the subsoil with good profile development evidenced from the clay illuviation down the profile.
The soils represented by Mapping Unit C was classified as Kulfo Series and occupies about 8.92% of the total land area and is found mainly at the lower slope positions. The soils are fairly well drained and deep. Fe-rich variegated mottling suggesting redox reactions occasioned by periodic moisture saturation were noticed at depths below 140 cm. Consistency is friable (moist) almost throughout the profile. The colour ranges from dark brown (7.5YR 3/2) at the top to yellowish red (5YR 5/6) at the subsoil. Mapping Unit D was classified as Molo Series and it occupies about 19.97% of the total land area. The soils are well drained and deep with no laterite or plinthite within the profile depth. Consistency is friable to hard (dry) with sub-angular blocky structure throughout the profile except the A horizon. The colour ranges from dark greyish brown (10YR 4/2) at the top to red (2.5 YR 5/8) at the subsoil. A higher clay content at the subsoil than the top is as a result of pedogenetic processes (especially clay migration) was observed, leading to the formation kandic subsoil horizon.
Mapping Unit E which was classified as Otteyi Series (shallow variation) covers about 28.4% of the land mass and was classified as Otteyi Series (Shallow variation). The soils occupy the hill crests of the laterite and ironstone caped almost flat upper slope positions on the landscape. They are well drained soils formed from sandstone parent materials. The soil surface is characterized by ironstone rubbles sometimes of boulder sizes. The soil colour ranges from dark grayish brown (10YR 5/4) becoming dark red (2.5YR 3/6) with highly ferrugenised mottled clay under the pan rubble. The textural class of the fine earth materials ranges from sandy clay loam increasing in clay content to become clay with depth. The gravel content is high ranging from 10.7 to 31.5%.
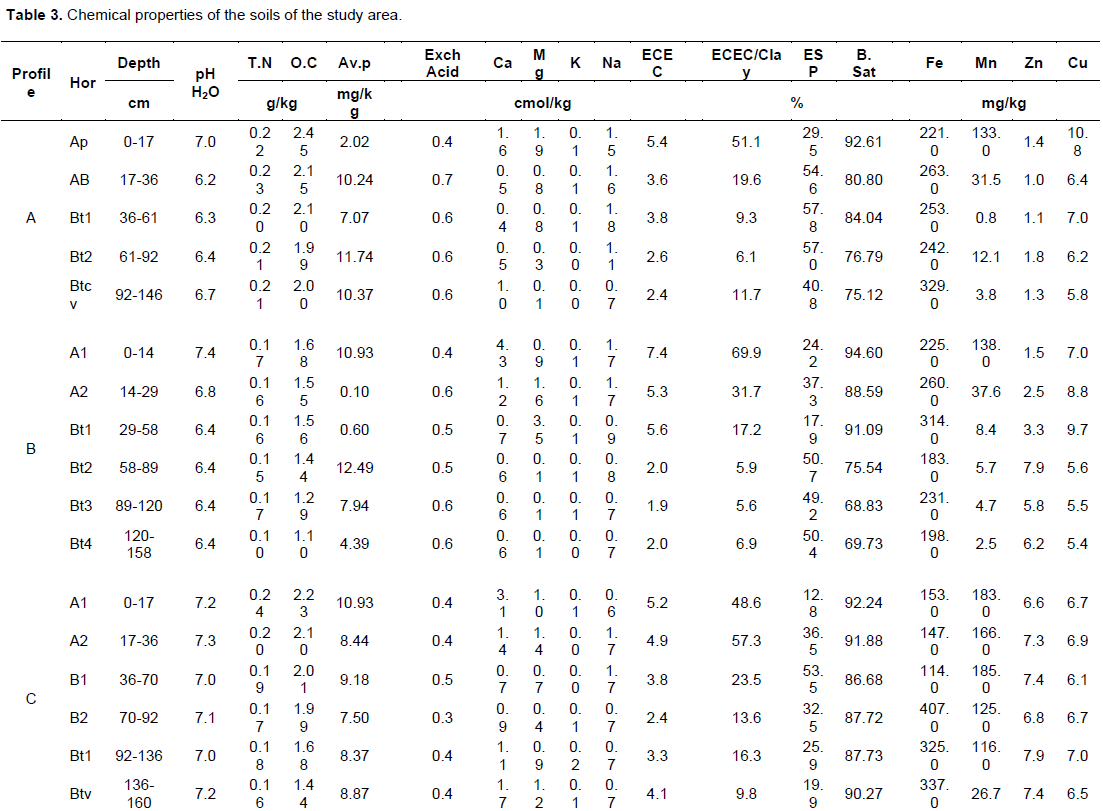
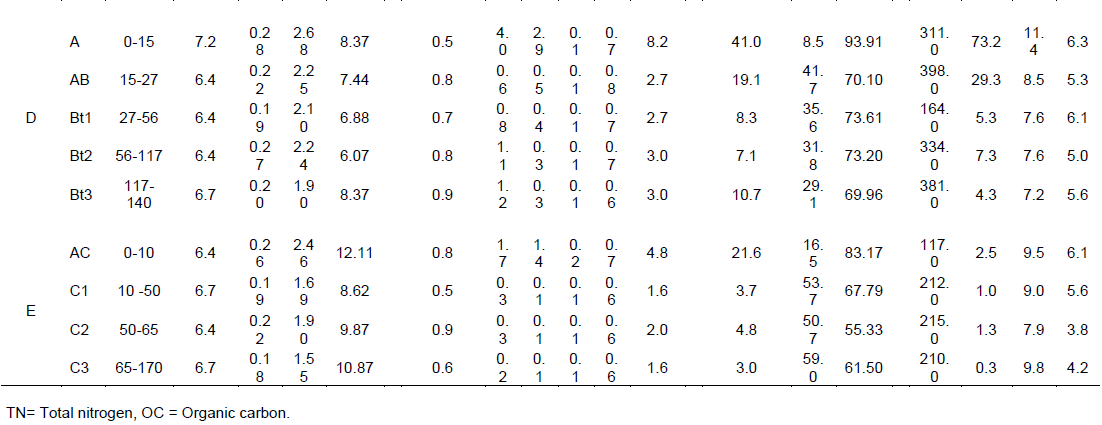
Soil chemical characteristics
The soil chemical characteristics are as presented in Table 3. Ilaro Series is generally slightly acidic to neutral in reaction (pH 6.2 - 7.0) with high base saturation (75.12 - 92.61%). The ECEC is very low (2.4 - 5.4 cmol/kg), while the organic carbon is moderate (19.90 - 24.50 g/kg); the highest value being at the upper horizons, decreasing with depth. Ibeshe Series soils are generally slightly acidic to neutral in reaction (pH 6.4 - 7.4) with the lowest acidity at the surface. Base saturation is high (69.73 - 94.60%) and the ECEC is very low to moderate (1.90 - 7.4 cmol/kg), while the organic carbon is low (11.00 - 16.50 g/kg); the highest value being at the upper horizons, decreasing with depth. The soil reaction in Kulfo is mostly neutral (pH 7.0 - 7.3). Base saturation is high (86.68 - 92.24%) and the ECEC is low ranging from 2.4 to 5.2 cmol/kg, while the organic carbon is relatively low (14.40 - 22.23 g/kg); the highest value being at the upper horizons as expected, decreasing with depth. The soils in Molo Series (Mapping Unit D) are slightly acidic (pH 6.4 - 7.2) with acidity increasing with depth. The topsoil is relatively richer in organic matter content (26.8 g/kg) than the subsoil (4). Nitrogen and phosphorus content are 2.8 g/kg and 8.74 mg/kg, respectively at the topsoil. They are also generally low in exchange cations even though high (>50%) in base saturation. The micro-nutrient contents are low for Cu and Zn but adequate for Mn and Fe. In addition to the aforementioned, they have a texture of sandy loam of 30 cm or more thick within 50 cm of the soil surface. The soils of Otteyi Series are slightly acidic (pH 6.4 - 6.7); moderately high in organic carbon content (24.6 g/kg) at the surface decreasing with depth to 15.5 g/kg. The ECEC is low (1.60 - 4.8 cmol/kg) also decreasing with depth.
Taxonomic classification
At the higher categories the soils of Mapping Unit A was classified as Plinthic Lixisol (Vetic) (FAO/IUSS, 2014) and Kanhaplic Haplustalf (Soil Survey Staff, 2014). They experience ustic moisture regime with argillic horizons at the subsoil. At the lower category they are classified as Ilaro series (Moss, 1957). They display distinct mottled clay structure, in addition to the attributes described. The soils of Unit B was classified as at WRB categories as Haplic Lixisol (Loamic, Ochric) (FAO/IUSS, 2014) and Typic Kandiustalf (Soil Survey Staff, 2014). They possess low activity clays (1:1 lattice clay minerals) with more than 50% base saturation in the major part between 20 and 100 cm from the soil surface and 80% or more in some layers within 100 cm of the soil surface. They experience ustic moisture regime with a Kandic B horizons at the subsoil. At the lower category they are classified as Ibeshe series (Moss, 1957).
The soils of Mapping Unit C are classified as Haplic Lixisol (Loamic, Ochric) (FAO/IUSS, 2014) and Udic Kandiustalf (Soil Survey Staff, 2014). They possess low activity clays (1:1 lattice clay minerals) with more than 50% base saturation in the major part between 20 and 100 cm from the soil surface and 80% or more in some layers within 100 cm of the soil surface. They experience ustic moisture regime with a Kandic B horizons at the subsoil. At the lower category, they are classified as Kulfo series (Moss, 1957). They are therefore classified as Molo series (Moss, 1957); Rhodic Lixisol (Hypereutric) (FAO/IUSS, 2014) and Rhodic Kandiustalf (Soil Survey Staff, 2014). The ironstone pan rubble in this soil is characteristically hard and somewhat metallic and occurs mostly at the surface making effective soil depth in this unit less than 15 cm. Hence, they are classified at the series level as Oteyyi Series (Shallow variation) (Moss, 1957). The soils are classified as Leptic Cambisol (Geoabruptic) (FAO/IUSS, 2014) and Lithic Haplustept in the USDA soil taxonomy.
Land capability classification (LCC)
A summary of the classification of the mapping units into capability classes is presented in Table 5 while the land capability map is presented in Figure 2. Soil Mapping Units B and D (Ibeshe and Molo Series) are grouped into Capability Unit IIf. This unit occupies about 60% of the total area of site 1 (Figure 2). The soils are deep, occupying gentle to almost flat positions on the landscape with little or no risk of accelerated erosion and runoff. The major limitation is that of fertility (f). The soils do not have problems of stoniness and excessive gravel content to limit plant roots proliferation. The effective soil depth of the unit is more than 160 cm. Thus, for most arable and tree crops hard pan is not a limiting factor. For oil palm, the roots are essentially fibrous and can exploit the soil laterally and also due to the fact that the greatest quantity of the roots is to be found between soil depths of 20 and 60 cm, and most of the absorption of nutrients have been known to be through the quaternary roots and absorbing tips of the primary, secondary and tertiary roots to this depth. The soils can be tilled and ridged for cassava, yam and maize though mechanical tillage. Though, the slope gradients are not too steep to warrant high susceptibility to erosion, tillage should be done across the slope contour to prevent erosion. If nutrients as the only limiting factor this unit could be supplied through sound fertility management, it is capable of optimal arable crop production.
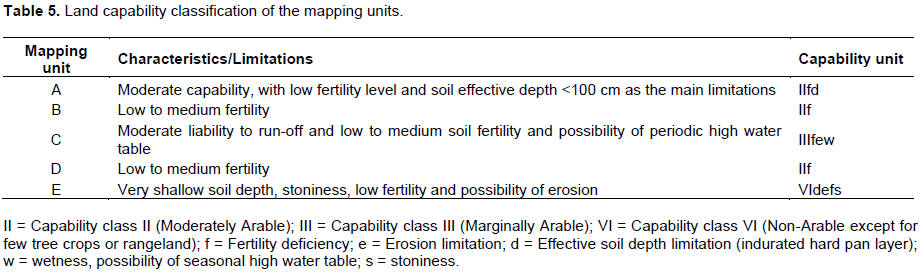
Soil Mapping Unit A (Ilaro Series) is classified into Capability Unit IIdf. This is moderately good unit for crop production with effective soil depth (d) (<100 cm), and low fertility (f) being the major limiting factors, for arable crop production. The capability unit occupies about 24.15% of the land area (Figure 2). It is concentrated in the south central portions of the land area. Maintenance of soil surface cover inform of cover crops or green mulch and manual land clearing will go a long way to reduce the possibility of erosion on the unit. Though, this land has an ironstone layer, it occurs in most parts of the unit below 80 cm depth. Thus, for most arable crops, except tap rooted tree crops, the hard pan may not be a serious limiting factor, since most of the plant’s feeder roots are concentrated in the upper 60 cm. Some form of moisture stress may be expected at the height of dry season. This can, however, be minimized by the application of green or dry mulch. The limiting factor identified are mild and readily be corrected through management practices.
Mapping Unit C (Kulfo Series) was grouped into Capability Unit IIIfew. Fertility (f), erosion (e) and possibility of wetness at the peak of high rainfall are the major limiting factors. The unit is marginally capable for arable but is good for tree crop production. Due to the torrential nature of the rainfall in the area, coupled with sloping (6-8%) nature of the area, it is predisposed to accelerated erosion if large tracts are opened up at once. The site is recommended for tree crop production like oil palm which can keep the soils covered and prevent erosion. This unit because of the periodic high water table may make an excellent area if supplementary water could be provided, for off-season vegetable production. Soil surface cover should be maintained as much as possible.
Fertility capability classification
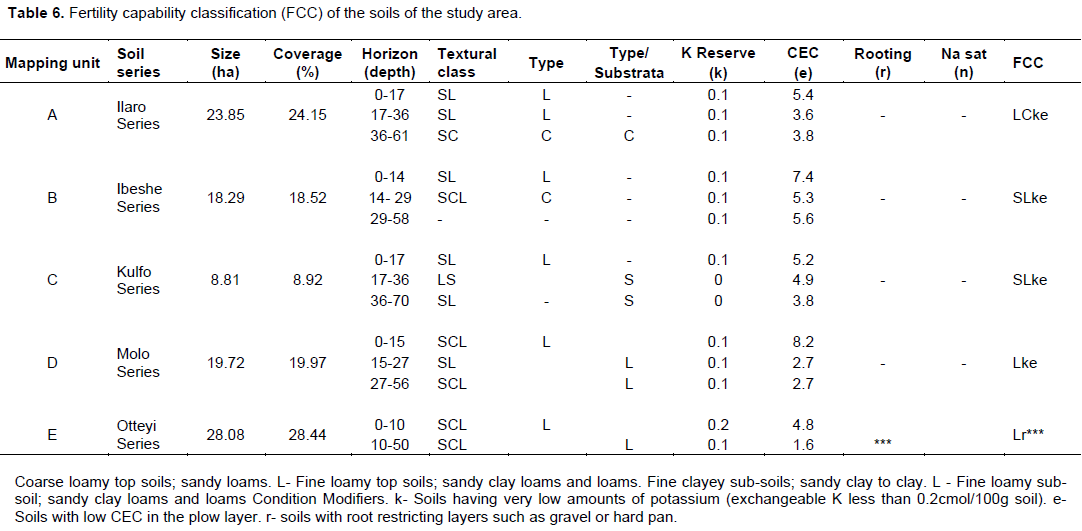
The fertility capability classification rating as obtained by adding the dominant textural class of the type, substrata and the limiting condition modifiers for each soil series and this is shown in Table 6. Ilaro Series had a Loamy starata with a clayey substarata types. The type is the dominant textural class within 0 to 25 cm of the soil series while the substrata represent the dominant textural class at 25 to 50 cm or the plow layer. A CEC value of <15 cmol/kg indicates low CEC and K value of <0.2 cmol/100 g of soil indicates K deficiency. The low CEC and low K reserves were common to almost all the Pedons in the study area. Otteyi Series had serious root restriction limitations resulting from pan rubbles on or close to the soil surface. This renders this pedon inappropriate for cropping.
DISCUSSION
The soils of the study are generally sandy loam at the top with the clay content generally increasing with depth and were classified as Kanhaplic Haplustalf, Typic Kandiustalf, Udic Kandiustalf, Rhodic Kandiustalf, and Lithic Haplustept in the USDA soil classification system. In the order level of classification, 71.56% of the soils are Alfisols and 28.44% Inceptisols. The difference between Typic Kandiustalf and Udic Kandiustalf is that though they both have a kandic B horizon at the subsoil, Typic Kandiustalf experiences an ustic moisture regime whereas Udic Kandiustalf experiences a higher soil moisture (at a lower slope position) similar to udic moisture regime described as a humid climate with about eight to nine months of rainfall in a year (Ojanuga, 2006). In terms of colour, the soils are characterized by dark brown to dark red, greyish-brown to yellowish-red, dark-brown to yellowish-red, dark greyish brown to red and dark greyish brown to dark red. The yellowish red, red and dark red coloration indicates the presence of iron oxides; dark brown color indicates high organic matter content (Brady and Weil, 1999).
The soils are generally slightly acidic to neutral (pH 6 2 - 7.4). Soil acidity can affect nutrient availability, herbicide persistence and toxicity of heavy metal, all of which can adversely crop production (Reeves and Liebig, 2016). The degree of leaching, nature of parent material, intensity of cropping going on in the soils are likely factors affecting the pH of the soil (Leibig et al., 2004). On a general note, the fertility status of the soils is higher at the upper horizons than the sub-soils which aligns with previous findings (Sharu et al., 2013, Belachew and Abera, 2010). The nitrogen status is higher than the critical level of 1.5 g/kg (Fontes and Ronchi, 2002) in about 90% of the land area. However, it must be noted that N is a dynamic nutrient and the present status is a result of organic matter accumulation on the surface soils which mineralizes rapidly on land clearing. Available P is generally deficient as less than 10% of the land area contains the required critical range of 15 to 45 mg/kg for sustainable arable cropping (Weaver and Wong, 2011). The soils are generally deficient in potassium, having values less than the critical level of 0.2 to 2.6 cmol/kg (Anderson et al., 2013) throughout the whole land area. The ECEC values of the soils are above the minimum standard of 4.0 cmol/kg in all portions of the land area owing principally to Calcium levels that are generally higher than the minimum requirement of 3.8 cmol/kg in all the soils. These according to Crespo et al. (2017) are dependent on such parameters as pH and organic matter content of the soils. The organic carbon levels of the soils are low ranging from 1.1 to 2.68 g/kg which is far below the critical level of 30 g/kg proposed by ISRIC (1995). The low organic carbon might have resulted from the high mineralization rate and cropping history of the area. The micro-nutrients (Mn, Cu and Zn) are at sufficiency level only at the top soil. Their critical values are 20 to 25, 1.2 to 2.0 and 3.0 to 3.45 mg/kg, respectively. The iron (Fe) content of the soils are however very high, far above the critical value of 161 mg/kg (Feiziasl et al., 2009; Crespo et al., 2017). Those nutrient elements that are below the critical levels need be supplied through deliberate fertilizer application to build up their levels in the soil. It was observed that Mapping Units A, B, and D are moderately capable of supporting arable cropping with limitations such as low fertility and soil effective depth for Mapping Unit A, low to medium fertility for Mapping Units B and D. Mapping Unit C is marginally capable with limitations such as moderate liability to run-off and low to medium, soil fertility and possibility of periodic high water table (wetness) whereas Mapping Unit E is non-arable with limitations such as very shallow soil depth, stoniness, low fertility and possibility of erosion.
Based on fertility capability classification, of the seventeen different condition modifiers used in the evaluation, potassium deficiency (k- <0.20 cmol/100 g) and low cation exchange capacity (e- <15 cmol/kg) occurred in 100% of the soils studied. The mapping units were thus classified as LCke, SLke, SLke, Lke and Lr*** for Ilaro, Ibeshe, Kulfo, Molo and Otteyi Series, respectively. Potassium deficiency occurred in all soils because majority of the soils are very high in sand content, the sandy texture of the soils as well as high concentration of the gravel in the soil must have encouraged the leaching of the available soil nutrients as K+ which are highly soluble (Datnoff, 2007; Senjobi, 2007). Potassium plays a lot of roles in plants such as protein synthesis, opening and closing of stomata, activation of some enzymes, phloem solute transport, and maintenance of cation: anion balance in the cystol and vacuole, a deficiency in K will impair a plants ability to maintain the processes. The low CEC of the soil is also attributed to the sandy texture of the soils. The CEC of soils influence soil structure stability, nutrient availability, soil pH and other ameliorants (Hazleton and Murphy, 2007). Soils with low CEC are more likely to develop deficiencies in K, Mg and other cations (CUCE, 2007).
CONCLUSION
The soils generally are slightly acidic to neutral and of low fertility status; all the soils are deficient in exchangeable potassium and low CEC. Hence, the major management problems of the soils which are relevant to agricultural production are those related to the maintenance of soil fertility under continuous cropping. The productivity of the soils can be improved through the judicious use of organic and inorganic fertilizers. Land use type and land capability need to be considered in taking appropriate approach to soil rehabilitation or improvement for agricultural uses in these soils. Organic matter management is essential for good crop production.
Organic matter accumulation through green and/or dry mulching should be encouraged. This will enhance the physical properties (bulk density, infiltration rate, hydraulic conductivity, water holding capacity, etc.) of the soils. The chemical fertility will also be enhanced as the organic carbon increases leading to the improvement of the status of nutrient elements in the soil.
CONFLICT OF INTERESTS
The authors have not declared any conflict of interests.
ACKNOWLEDGMENTS
The funding assistance received from Cosmo Farmers Group and the assistance from the Laboratory staff of Department of Agronomy, University of Ibadan are gratefully acknowledged.
REFERENCES
|
Anderson G, Chen W, Bell R, Brennan R (2013). Critical values for soil P, K and S for near maximum wheat, canola and lupin production in Western Australia. WA Crop Updates 2013. Department of Agriculture and Food, P 4. |
|
|
Belachew T, Abera Y (2010). Assessment of Soil Fertility Status with Depth in Wheat Growing Highlands of Southeast Ethiopia. World Journal of Agricultural Sciences 6(5):525-531. |
|
|
Black CA (1975). Methods of soil analysis. Agronomy No. 9, Part 2, American Society of Agronomy, Madison. Wisconsin. |
|
|
Brady NC, Weil RR (1999). The nature and properties of soil. Prentice Hall, New Jersey, USA. 12th Edition. P. 881. |
|
|
Bray RH, Kurtz LT (1945). Determination of Total and Available forms of Phosphate in Oils. Soil Science 59:225-229. |
|
|
Cornell University Cooperative Extension (CUCE) 2007. Cation Exchange Capacity (CEC). Agronomy fact sheet series # 22. Department of Crop Sciences, College of Agriculture and Life Sciences, Cornell University. |
|
|
Crespo CJQ, Zenteno MDC, Intriago FLM, Alvarado RAC (2017). Nutrient critical levels and availability in soils cultivated with peach palm (Bactris gasipaes Kunth) in Santo Domingo de Los Tsáchilas, Ecuador. Acta Agronomie 66(2):235-240. |
|
|
Datnoff LE (2007). Mineral Nutrition and Plant disease. The American Phytopathological Society ISBN0-89054-346-1 |
|
|
Edmeades DC (1982). Effects of lime on effective cation exchange capacity and exchangeable cations on a range of New Zealand soils. New Zealand Journal of Agricultural Research 25(1):27-33. |
|
|
Food and Agriculture Organization (FAO) (1991). Guidelines: land evaluation for extensive grazing. Soils Bulletin 58. Food and Agriculture Organization of the United Nations, Rome, Italy. |
|
|
Food and Agriculture Organization (FAO) (2007). Land Evaluation. Towards a Revised Framework. Food and Agriculture Organization of the United Nations, Rome, Italy. |
|
|
FAO/IUSS (2014). World Reference Base for Soil Resources (2014). International soil classification system for naming soils and creating |
|
|
legends for soil maps. World Soil Resources. Reports No. 106. FAO, Rome. |
|
|
Fasina AS, Omolayo FA, Ajayi SO, Falodun AA (2007). Influence of Land Use on Soil Properties in Three Mapping Units in Southwestern Nigeria-Implications for Sustainable Soil Management. In: Uyovbisere, E.O, Raji, B.A, Yusuf, A.A, Ogunwale, J.O, Aliyu, L. and Ojeniyi, S.O (Eds). Soil and water management for poverty alleviation and sustainable Environment Proceedings of the 31st annual conference of SSSN/ABU Zaria Nigeria November 13th to 17th, 2006. |
|
|
Feiziasl V, Jafarzadeh J, Pala M, Mosavi SB (2009). Determination of Critical Levels of Micronutrients by Plant Response Column Order Procedure for Dryland Wheat (T. aestivum L.) in Northwest of Iran. International Journal of Soil Science 4:14-26 |
|
|
Fontes PCR, Ronchi CP (2002). Critical values of nitrogen indices in tomato plants grown in soil and nutrient solution determined by different statistical procedures. Pesquisa Agropecuária Brasileira, 37(10):1421-1429. |
|
|
Hazleton PA, Murphy BW (2007). Interpreting Soil Test Results: What Do All The Numbers Mean? CSIRO Publishing. |
|
|
Hubrechts L, Vander PK, Vanclosster M, Deckers J (2004). From Soil Survey to quantitative land evaluation in Belgium. European Soil Bureau Research Report No 4. |
|
|
Jackson ML (1958). Soil Chemical analysis. Prentice Hall. Inc. Englewood Cliffs, NJ, 498. |
|
|
Klingebiel AA, Montgomery PH (1961). Land capability classification. USDA Agricultural Handbook 210. US Government Printing Office, Washington, DC. |
|
|
Leibig MA, Tanaka DL, Wienhold BJ (2004). Tillage and cropping effects on soil quality indicators in the northern Great Plains. Soil and Tillage Research 78:131-141. |
|
|
Lufega SM, Msanya BM (2017). Pedological Characterization and Soil Classification of Selected Soil Units of Morogoro District, Tanzania. International Journal of Plant and Soil Science 16(1):1-12 |
|
|
Moss RP (1975). Report on the classification of the soils found over sedimentary rocks in Western Nigeria. Soil Survey Report. No. 67. Institute of Agricultural Research and Training. University of Ife, Ibadan. P. 90. |
|
|
Msanya BM, Mwasyika TA, Amuri N, Semu E, Mhoro L (2018). Pedological Characterization of Typical Soils of Dodoma Capital City District, Tanzania: Soil Morphology, Physico-chemical Properties, Classification and Soil Fertility Trends. Annals of Advanced Agricultural Sciences 2(4):59-73. |
|
|
Nuga BO, Akinbola GE (2011). Characteristics and Classification of Soils Developed Over Coastal Plain Sand and Shale Parent Material in Abia State Nigeria. Journal of Technology and Education in Nigeria (JOTEN), 16(1):36-58. |
|
|
Nuga BO, Akinbola GE (2015). Land Suitability Evaluation of Soils on Two Mapping Units for Some Arable Crops in South Eastern Nigeria. IOSR Journal of Agriculture and Veterinary Science (IOSR-JAVS) 8(3):66-73 |
|
|
Ogunkunle AO (2005). Soil Survey and Sustainable Land Management. Invited paper at the 29th annual conf. of SSSN held at University of Nigeria, Abeokuta, from 6th to 10th December. 2004. |
|
|
Ojanuga AG (2006). Agroecological Zones of Nigeria Manual. Berding F. and Chude V.O. (Eds). National Special Programme for Food Security (NSPFS), FAO and FMA & RD. P. 123. |
|
|
Olabode SO, Mohammed MZ (2016). Depositional facies and sequence stratigraphic study in parts of Benin (Dahomeh) Basin, SW Nigeria: Implications on the re-interpretation of tertiary sedimentary successions. International Journal of Geosciences 7:210-228. |
|
|
Orimoloye JR, Nuga BO, Akinbola GA (2007): Evaluation of some pedons of basement complex of Southwestern Nigeria for rainfed maize, cassava and rubber cultivation. Chemtech Journal 3:483-490 |
|
|
Reeves JL, Liebig MA (2016). Depth matters: soil pH and dilution effects in the northern Great Plains. Soil Science Society of America Journal 80:1424-1427. |
|
|
Sanchez PA, Palm CA, Buol SW (2003). Fertility Capability soil classification: a tool to help assess soil quality in the tropics. Geoderma114:157-185. |
|
|
Senjobi BA (2007). Comparative Assessment of the Effect of Land Use and Land Type on Soil Degradation and Productivity in Ogun State, Nigeria. 161pp. Unpublished Ph.D. Thesis submitted to the Department of Agronomy, University of Ibadan, Nigeria. |
|
|
Sharu MB, Yakubu M, Noma SS, Tsafe AI (2013). Characterization and Classification of Soils on an Agricultural landscape in Dingyadi District,Sokoto State, Nigeria. Nigerian Journal of Basic and Applied Science (June, 2013), 21(2):137-147. |
|
|
Shepande C (2002). Soils and land use with particular attention and land evaluation for selected land use types in the Lake Naivasha Basin. Kenya. Unpublish. M.S.C. Thesis in Soil information, ITC. Enschede Netherlands. |
|
|
Soil Survey Staff (1993). Soil Survey Manual. Soil Conservation Service, United State Department of Agriculture. Agricultural Handbook 18. (Online). |
|
|
Soil Survey Staff (2014). Keys to Soil Taxonomy. 12th Edition, USDA Natural Resources Conservation Service, P. 332. |
|
|
Walkley A, Black IA (1934). AN examination of the Degitareff method for determining soil organic matter and proposed modification of the Chromic acid titration method. Soil Science 37:29-38. |
|
|
Weaver DM, Wong MTF (2011) Phosphorus balance efficiency and P status in crop and pasture soils with contrasting P buffer indices: scope for improvement. Plant and Soil 349:37-54. |
|
Copyright © 2024 Author(s) retain the copyright of this article.
This article is published under the terms of the Creative Commons Attribution License 4.0


