Full Length Research Paper

ABSTRACT
The present paper reviews CODG TEC response to the moderate storm of July 26, 2003 and that of July 29 at Niamey station in West African equatorial station (Geo Lat 13° 28'45.3 "N; Geo long: 02° 10'59.5" E) in Niger. These two moderate geomagnetic storms are of solar wind origin. The study showed an increase in CODG TEC values during the initial phase of the storm and a decrease in CODG TEC values during the main and recovery phases of the storm. In general, in the equatorial region, positive and negative storms occurred (increase and decrease in TEC values). Here we highlight the prereversal enhancement (PRE), a particularity of the equatorial ionosphere. Our investigations show M, B and R profiles in addition to the well-known dome profile in the variation of the CODG TEC in Niamey. This work suggests a variation of the equatorial electrojet intensity during the storm recovery phase, the appearance of the counter-electrojet as well as a disturbance of the ExB drift. This study is local, in the equatorial region in the West African sector. Data are needed to corroborate some hypotheses such as changes in profiles associated with the presence or absence of electrojet and counter-electrojet currents. We advocate for a new IHY for Africa and for data exchange between researchers.
Key words: Ionosphere, solar wind, disturbance, total electron content (TEC).
INTRODUCTION
Solar events, such as coronal mass ejections (CMEs) and solar winds in the vicinity of the earth, impact the geomagnetic field as well as the earth's atmosphere. The ionosphere, the ionized part of the earth's atmosphere, is then strongly disturbed. These disturbances have been studied by several authors (Eurico de Paula et al., 2019; Shimeis et al., 2012; Azzouzi, 2016). According to these authors, geomagnetic storms cause an increase in electron density or in total electron content (TEC) at some stations and also affect electrodynamics. In general, in low latitudes in the equatorial region, positive storms occur (increase in TEC values) and negative storms (decrease in TEC values) (Chakraborty and Hajra, 2010) compared to the monthly mean or median. The equatorial ionosphere presents some particularities as : (1) the existence of an ionospheric electric current ?owing along the magnetic equator, the equatorial electrojet (EEJ) (Chapman, 1951), (2) the existence of an increase in the zonal electric ?eld post sunset, the prereversal enhancement (PRE) (Woodman, 1970). During quiet magnetic periods, the EEJ ?ows along the magnetic equator. The EEJ is an eastward ionospheric electric current in the E region, created by the ionospheric dynamo process (Stewart, 1882; Chapman and Bartels, 1940). Occasionally, the normal daytime eastward directed EEJ current appears to reverse to a westward current, forming counter equatorial electrojet (CEJ) (Yizengaw et al., 2011). The equatorial electric field created by the ionospheric dynamo (Stewart, 1882; Chapman and Bartels, 1940) is eastward during the daytime and westward at nighttime. At the time of its reversal, post sunset, the eastward electric field strongly increases, and is called the PRE. At the geomagnetic equator, the magnetic field is horizontal and the EXB drift is vertical. An eastward/westward electric field lifts up/down the plasma (Azzouzi et al., 2016).
In this work, we present the equatorial ionosphere response to two moderate geomagnetic storms: July 26 and 29, 2003, through TEC variation estimated at Niamey station (Geo Lat 13° 28'45.3 "N; Geo long: 02° 10'59.5" E). We also suggest the underlying physical processes.
general, in low latitudes in the equatorial region, positive storms occur (increase in TEC values) and negative storms (decrease in TEC values) (Chakraborty and Hajra, 2010) compared to the monthly mean or median. The equatorial ionosphere presents some particularities as : (1) the existence of an ionospheric electric current ?owing along the magnetic equator, the equatorial electrojet (EEJ) (Chapman, 1951), (2) the existence of an increase in the zonal electric ?eld post sunset, the prereversal enhancement (PRE) (Woodman, 1970). During quiet magnetic periods, the EEJ ?ows along the magnetic equator. The EEJ is an eastward ionospheric electric current in the E region, created by the ionospheric dynamo process (Stewart, 1882; Chapman and Bartels, 1940). Occasionally, the normal daytime eastward directed EEJ current appears to reverse to a westward current, forming counter equatorial electrojet (CEJ) (Yizengaw et al., 2011). The equatorial electric field created by the ionospheric dynamo (Stewart, 1882; Chapman and Bartels, 1940) is eastward during the daytime and westward at nighttime. At the time of its reversal, post sunset, the eastward electric field strongly increases, and is called the PRE. At the geomagnetic equator, the magnetic field is horizontal and the EXB drift is vertical. An eastward/westward electric field lifts up/down the plasma (Azzouzi et al., 2016).
In this work, we present the equatorial ionosphere response to two moderate geomagnetic storms: July 26 and 29, 2003, through TEC variation estimated at Niamey station (Geo Lat 13° 28'45.3 "N; Geo long: 02° 10'59.5" E). We also suggest the underlying physical processes.
DATA AND METHODOLOGY
In this study, the following were used: (1) TEC data from the IGS CODE analysis center. The IGS provides any GPS user with several products, including an empirical ionosphere model. The IGS uses a global model for the production of ionospheric model based on data from several stations around the world (Schaer et al., 1998). Ionospheric products are calculated by CODE / AIUB (Center for Orbit Determination in Europe/Astronomical Institute of the University of Berne).
CODG implies CODE GIM (Global Ionosphere Maps), the maps of the global ionosphere generated by CODE or from its products. Text data corresponding to Niamey latitude CODG TEC variations were obtained for the period concerned; (2) the Dst index to determine the different phases of the storm and the Aa index through the pixel diagram for the year 2003 (Figure 1) to monitor the geomagnetic disturbance level; the AE index to estimate the energy of the storm. The large variation in the AE index indicates Joule heating in the Auroral region (Maury et al., 2018); As regards the Bz component of the interplanetary magnetic field (IMF), for a geomagnetic storm to develop it is vital that the direction of the interplanetary magnetic field (Bz) turns southward. Also, the dynamic pressure of the solar wind characterizes in particular the strength of the storm and the extent of its effects.

Coronal hole evolution (Figure 2) exit door of the solar wind source of the geomagnetic storms was observed on www.spaceweather.com.

Figure 3 presents from top to bottom: the hourly variation (from July 24 to August 04) of the component Bz of the interplanetary magnetic field, the solar wind dynamic pressure, Dst index and AE index.

On July 23 (as July 24) 2003, a coronal hole lets a solar wind flow which will reach the earth on July 27 (Figure 2; www.spaceweather.com). It arrived earlier on July 26. On July 25 (like July 26) 2003, a coronal hole lets a solar wind flow which will reach the earth on July 27 or 28 (Figure 2; www.spaceweather.com). It arrived later on July 29. These effects will reinforce those of the solar wind that arrived on July 26.
The study covers the period from July 24 to August 4, 2003. It contains the entire duration of the disturbance determined by analyzing the variation of the Dst index and the pixel diagram.
A pixel diagram displays the daily averages of aa index as a table. Each horizontal line contains 27 days corresponding to a 27-day Bartels solar rotation. The number in each square is the mean daily value of the aa index and the squares are color-coded based on these values using the color bar shown in Figure 1. Circles indicate the days when storm impulse. This diagram simplifies the identification of geomagnetic phenomena (Legrand and Simon, 1989; Ouattara and Amory-Mazaudier, 2009; Zerbo et al., 2012, Zerbo et al., 2013): (1) Quiet activity days are defined as days when aa < 20 nT. The three other classes (shock activity, recurrent activity and fluctuating activity) constitute the disturbed geomagnetic activity classes which occur on days when aa ≥ 20 nT. These classes are distinguished as follows: (2) Recurrent (stream) activity corresponds in the pixel diagrams to days where aa ≥ 40 and repeated at the same solar longitude for at least two consecutive solar rotations without SSC. (3) Shock activity are days of ssc where aa ≥ 40 nT. (4) Fluctuating activity are days not included in the three previous classes.
We analyze the total electron content variation from day to day from July 24 to August 04. The total electron content at Niamey station generally presents well-known profiles (Zoundi et al., 2013). We compare the maxima of each day to the previous day in order to characterize qualitatively (decrease or increase) the total electron content variation.
We analyzed the daily profiles of the disturbed days based on those found by Faynot and Villa (1979) for the critical frequency foF2 of the F2 layer at the Ouagadougou station: noon bite out profile or B profile (two peaks with trough around midday); (2) morning peak profile or M profile; (3) dome profile or D profile; (4) plateau profile or P profile; and (5) afternoon peak profile or reversed profile or R profile.
Vassal (1982) associated these profiles of the diurnal variation of the critical frequency in the equatorial region with electrojet or counter-electrojet current presence or absence. Thus, the B profile is linked to the presence of a strong electrojet, M indicates the presence of a medium electrojet, D corresponds to the absence of an electrojet, R indicates the presence of an intense counter-electrojet and finally P is linked to the existence of a weak electrojet.
An empirical relationship between foF2 and VTEC has been established in the Indian sector (Acharya et al., 2010). These research results give us the opportunity to interpret TEC profiles based on electric currents.
RESULTS AND DISCUSSION
Table 1 gives the correspondence between day of the year and current dates. Bz decreases on July 24 with south-north direction on July 25. The AE auroral index is around 500 nT on July 23. On July 24, it is weak but increases at night. On July 25, a peak of around 500 nT is observed. Our pixel diagram lets us see that the four days before the storm are quiet days (Aa ≤ 20 nT).

On July 26, a sharp drop was noticed in the Bz to about -15 nT (southward). The auroral index AE rises sharply to 1400 nT. The Dst index suddenly drops to -57 nT.
Following the categorization (Chakraborty and Hajra, 2010), the Earth is subjected to a moderate geomagnetic storm (-50nT≥Dst≥-100nT).
It is of solar wind origin. The increase in the AE index indicates an intensification of auroral electrojets due to the power dissipated at the auroral oval during the solar wind-magnetosphere impact.
The main phase of the storm lasts from the afternoon of July 26 until around 0800TU (estimate from Figure 3; see Dst hourly variation) on July 27. Shortly before, we can observe an attempt at recovery.
Note that the main phase is simultaneous with a large variation in the AE index and the solar wind pressure. The beginning of the recovery phase is effective on the morning of July 28. In the afternoon of July 29 we observed a further decrease in the Dst index, which also corresponds here to the manifestation of a moderate storm. This further decrease in the Dst index is simultaneous with a large variation in the AE index and a southern orientation of the interplanetary magnetic field component Bz. However, the variation in the dynamic pressure of the solar wind is not significant. The pixel diagram tells us that from July 26 to August 4 there is fluctuating activity. However, on July 26, 29, 30, 31 and August 1, the level of disturbance is more broad (index Aa). August 5 is a quiet day. The recovery is therefore effective on August 4.
Change in total electron content during the storm
Figure 4 shows CODG TEC daily variation obtained at Niamey station from July 24 to August 04, 2003. Here, we can see that TEC diurnal variation has a dome profile the two days before the beginning of the storm. In addition, it exhibits a night peak, signature of the pre-reversal enhancement (PRE).
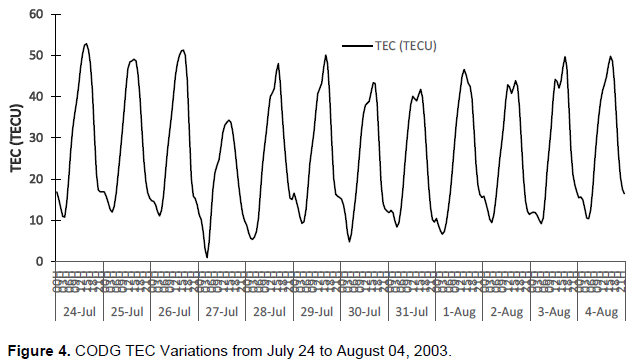
On July 26, 2003, the dome profile was remained while the PRE signature disappeared. During the day and night of July 27, the mean TEC values are lower than those of the other days. This is the signature of a negative storm. The maximum that day is around 34 TECU compared to 50 TECU the three days before and between 40 TECU and 50 TECU the days after. We also notice the absence of the PRE signature, on July 27. From July 28 to August 4, the TEC diurnal variation presents varied profiles: R (Reversed or evening peak) from July 28 to July 30 as well as August 04, M (morning peak) August 1st and B (noon bite-out or double peaks with a trough around noon) July 31st, August 2nd and 3rd. Night peaks are also present.
During magnetic events of solar wind type, two main phenomena already known must be taken into account: the prompt penetration of the magnetospheric electric field (PPEF) (Vasyliunas, 1970; Fejer et al., 1983; Mazaudier et al., 1984) and the dynamo disturbance electric field (DDEF) (Blanc and Richmond, 1980; Sastri, 1988). Indeed, during the shock solar wind-magnetosphere, a convective electric field (Nishida, 1966) penetrates from the polar cap to the equator. This occurs simultaneously at all latitudes. This electric field plays an important role in the circulation of a current system called DP2 in the polar region (Nishida, 1968). In addition to this prompt penetration of the electric field, the energy dissipated in the auroral zone is transferred to the neutral gas by the Joule heating. The large variations in the AE index indicate Joule heating in the auroral region. This energy causes an equatorward transfer of matter which promotes the rise of a westward electric current. This physical process has been named ionospheric dynamo disturbance (Blanc and Richmond, 1980) and the current has been named Ddyn (Amory-Mazaudier and Le Huy, 2008). On July 26, we note an increase in the TEC values compared to those of July 25. This is the signature of a positive storm. Abdu (1997) and Azzouzi (2016) noticed an increase in TEC during the initial phase of a storm of solar wind origin. It occurs simultaneously with the intensification of auroral electrojets and therefore could be due to the prompt penetration of the convective electric field. Indeed, this penetration occurs simultaneously at all latitudes (Kelley et al., 2003) and a variation in the AE index of around 600 nT may be linked to an electric field penetration in the equatorial region (Abdu et al., 2012). In addition, the interplanetary magnetic field Bz component is directed southward characteristic of a day-side reconnection and prompt penetration of the electric field (Eurico de Paula et al., 2019; Kelley et al., 2003). This penetration of the convective electric field causes the ionospheric layers ascension and therefore the phenomena of recombination reduction. This could explain the increase in TEC values. From July 26 around 2200 LT until July 27, there is a decrease in TEC as well as the disappearance of the PRE. The AE index remains above 300 nT from July 26 at 1700 LT to July 27 at 0400 LT. This decrease is observed several hours (2 to 4 h) after an extended intensification of the AE index; according to the criteria of Fejer and Scherliess (1995), the ionospheric dynamo disturbance could be the source of the decrease in CODG TEC. Moreover, Azzouzi (2016) had pointed out that DDEF inhibited vertical plasma drift at the time of the PRE. DDEF would therefore probably also be the cause of the disappearance of the PRE on July 26 and 27. From July 28 we notice the appearance of profiles R, M and B. During the period from July 28 to 31, the AE index remains above 140 nT with increases reaching 500 nT or even 1000 nT. Although the criteria of Fejer et al. (2008) are not rigorously fulfilled, these new profiles could be due to the ionospheric dynamo disturbance. Indeed, it causes the rise of an electric current flowing westward (Blanc and Richmond, 1980), therefore opposite to the equatorial electrojet. This current and the equatorial electrojet could neutralize each other. A westward enhancement of the current could be the source of a counter-electrojet giving rise to the observed reversed profile. The counter-electrojet has already been observed during magnetic events (Eurico et al., 2019). This temporary current from the transfer of the energy dissipated in the auroral zones, and weakening could allow the electrojet to gradually regain its intensity. This could explain the appearance of the M and B profiles resulting respectively from a medium electrojet and a strong electrojet.
It is well known that many types of global-scale disturbances exhibit an enhancement of H-component geomagnetic field at the equatorial latitudes and thus enhancement of EEJ (Rastogi, 1974; Yizengaw et al., 2011). Normally the CEJs are observed as depressions in diurnal variations of H-component geomagnetic field measured in equatorial regions (Rastogi, 1974; Somayajulu et al., 1993; Yizengaw et al., 2011). Our hypotheses on the electrojet and counter-electrojet currents could be tested if we had ground data on H-component geomagnetic field in Niamey for the period considered. Data for these magnetometers are needed. This limit challenges us to the need to advocate for a new project for the International Heliophysics year (IHY) for Africa and for cooperation between researchers for data exchange for large-scale studies. It is important to underline that the IHY project (February 2007 to February 2009) aimed to promote the participation of developing countries to the global international study of the Sun-Earth system in a triptych concept: instruments, observations and education (Davila et al., 2007).
CONCLUSION
The CODG TEC response to the moderate storm of July 26, 2003 at Niamey latitude was: (1) an increase in TEC values during the initial phase, (2) a decrease in TEC values during the main and recovery phases occurring before July 29.
On July 29, a moderate storm reinforced that of July 26 and extended its recovery phase. The CODG TEC response to this reinforcement was an increase in TEC values during the initial and main phases. From July 30 to August 4, last recovery period, TEC values depleted compared to July 29. These results are in agreement with those of Chakraborty and Hajra (2010) which showed that in general, in the equatorial region, positive and negative storms occurred (increase and decrease in TEC values). In addition, during the main phase, we note the disappearance of the PRE signature of fluctuations in the equatorial electrojet intensity and the rise of an equatorial counter-electrojet during the recovery phase. This suggests that the ionospheric dynamo in the equatorial region is strongly disturbed during the main and recovery phases of the geomagnetic storm.
The storm of March 17 2015, of CME origin, reached an unprecedented magnitude for this solar cycle 24 (Maurya et al., 2018; Astafyeva et al., 2015). With a Dst index minimum value of around -217 nT, it is classified as intense.
Future work should be devoted towards analyzing its impact on the equatorial ionosphere in the African sector in an attempt to highlight the underlying physical processes.
CONFLICT OF INTERESTS
The authors have not declared any conflict of interests.
ACKNOWLEDGEMENT
The authors appreciates Rolland Fleury from IMT Bretagne, Technopole, Brest Iroise, France for cooperatively providing Niamey CODG TEC data.
REFERENCES
|
Abdu M A (1997). Major phenomena of the equatorial ionosphere-thermosphere system under disturbed conditions. Journal of Atmospheric and Solar-Terrestrial Physics 59(13):1505-1519. |
|
|
Abdu MA, Batista IS, Bertoni F, Reinisch BW, Kherani EA, Sobral JHA (2012). Equatorial ionosphere responses to two magnetic storms of moderate intensity from conjuguate point observations in Brazil. Journal of Geophysical research 117(A5321):1-20. |
|
|
Acharya R, Roy B, Sivaraman MR, Dasgupta A (2010). An empirical relation of daytime equatorial total electron content with equatorial electrojet in the Indian zone. Journal of Atmospheric and Solar-Terrestrial Physics (UK) 72(10):774-780. |
|
|
Amory-Mazaudier C, Le Huy M (2008). Plantary magnetic signature of the storm wind disturbance dynamo currents: Planetary magnetic signature of the storm wind disturbance dynamo currents: Ddyn. Journal of Geophysical Research: Space Physics 113(A2). |
|
|
Azzouzi I, Migoya-Orue YO, Coïsson P, Amory Mazaudier C, Fleury R, Radicella SM (2016). Day to day variability of VTEC and ROTI in October 2012 with impact of high speed solar wind stream on 13 October 2012. Sun and Geosphere 11(1):7-22. |
|
|
Azzouzi I (2016). Impact des évènements solaires sur l'ionisation de l'ionosphère des moyennes et basses latitudes dans le secteur Europe-Afrique.,» Université Pierre et Marie Currie-Paris VI, Paris. |
|
|
Blanc M, Richmond AD (1980). The ionospheric disturbance Dynamo. Journal of Geophysical Research 85(A4):1669-1686. |
|
|
Chakraborty SK, Hajra R (2010). Variability of total electron content near the crest of the equatorial anomaly during moderate geomagnetic storms. Journal of Atmospheric and SolarTerrestrial Physics 72(11-12):900-911. |
|
|
Chapman S (1951). The Equatorial Electrojet as Detected from the Abnormal Electrique Current Distribution above Huancayo, Peru, and Elsewhere. Archiv für Meteorologie, Geophysik und Bioklimatologie Serie A(4):368-390. |
|
|
Chapman S, Bartels J (1940). Geomagnetism. Oxford University Press. New York. |
|
|
Davila JN, Gopalswamy, Haubold HJ, Thompson B (2007). International Heliophysical Year : Basic space science initiatives. Sciences Direct, Space Policy 23(2):121-126. |
|
|
Eurico de Paula R, Cesar de Oliveira BA, Ronald Caton G, Patricia Negreti M, Inez Batista S, André Martinon R F, Acácio Neto C, Mangalathayil Abdu A, João Monico F G, Jonas Sousasantos and Alison Moraes O (2019). Ionospheric irregularity behavior during the September 6-10, 2017 magnetic storm over Brazilian equatorial-low latitudes. Earth, Planets and Space 71(42):1-15. |
|
|
Faynot JM, Vila P (1979). "F region at the magnetic equator". Annales Geophysicae 35:1-9. |
|
|
Fejer BG, Jensen JW, Su S-Y (2008). Seasonal and longitudinal dependence of equatorial disturbance vertical plasma drifts. Geophysical Research Letters P 35. |
|
|
Fejer BG, Scherliess L (1995). Time dependent response of equatorial ionospheric electric fields to magnetospheric disturbances. Geophysical Research Letters 22(7):851-854. |
|
|
Fejer B, Larsen MF, Farley DT (1983). On the equatorial disturbance dynamo electric field. Geophysical Research Letters 10(7):537-540. |
|
|
Kelley MC, Jonathan Makela J, Jorge Chau L, Michael Nicolls J (2003). Penetration of the solar wind electric field into the magnetosphere/ionosphere system. Geophysical Research Letters 30(4):7-10. |
|
|
Legrand JP, Simon PA (1989). Solar cycle and geomagnetic activity: A review for geophysicists. Part I. The contributions to geomagnetic activity of shock waves and of the solar wind. Annales Geophysicae 7(6):565-578. |
|
|
Mazaudier C, Blanc M, Nielsen E, Min-Yun Z (1984). Latitudinal profile of the magnetospheric convection electric field at ionospheric altitudes from chain of magnetic and radar data. Journal of Geophysical Research 89(A1):375-381. |
|
|
Nishida A (1966). Formation of Plasmapause, or Magnetospheric Plasma Knee, by the Combined Action of Magnetospheric Convection and plasma Escape from the Tail. Journal of Geophysical Research 71(23):5669-5679. |
|
|
Nishida A (1968). Geomagnetic DP2 fluctuations and associated magnetospheric phenomena. Journal of Geophysical Research 73(17):1795-1803. |
|
|
Ouattara F, Amory-Mazaudier C (2009). "Solar-Geomagnetic Activity and Aa Indices toward a Standard." Journal of Atmospheric and Solar-Terrestrial Physics 71(17-18):1736-1748. |
|
|
Rastogi RG (1974). Westward equatorial electrojet during daytime hours. Journal of Geophysical Research 79(10):1503-1512. |
|
|
Schaer S, Gurtner W, Feltens J (1998). IONEX: The IONosphere Map Exchange Format Version 1. In: Proceedings of the IGS AC workshop, Darmstadt, Germany, February 9-11. |
|
|
Shimeis A, Fathy I, Amory-Mazaudier C, Fleury R, Mahrous AM, Yumoto K, Groves K (2012). Signature of the coronal hole near the crest equatorial anomaly over Egypt during the strong geomagnetic storm 5 April 2010. Journal of Geophysical Research 117(A07309):1-8. |
|
|
Somayajulu VV, Cherian L, Rajeev K, Ramkumar G, Reddi CR (1993). Mean winds and tidal components during counter electrojet events. Geophysical Research Letters 20(14):1443-1446. |
|
|
Stewart B (1882). Terrestrial magnetism. In : Encyclopaedia Britannica, ninth edition 16:159. |
|
|
Vassal J (1982). La variation du champ magnetique et ses relations avec l'électrojet équatorial au Sénégal Oriental. Annales Geophysicae 38(3):347-355. |
|
|
Vasyliunas VM (1970). Mathematical models of magnetospheric convection and its coupling to the ionosphere. Particles and fields in the magnetosphere edition, New York, Springer, pp. 60-71. |
|
|
Woodman RF (1970). Vertical drift velocities and east-west electric field at the magnetic equator. Journal of Geophysical research 75(31):6249-6259. |
|
|
Yizengaw E, Moldwin MB, Mebrahtu A, Damtie B, Zesta E, Valladares CE, Doherty P (2011). Comparison of storm time equatorial ionosphere electrodynamics in African and American sectors. Journal of Atmospheric and Solar-Terrestrial Physics 73(1):156-163. |
|
|
Zerbo JL, Amory Mazaudier C, Ouattara F, Richardson JD (2012). Solar wind and geomagnetism: toward a standard classification of geomagnetic activity from 1868 to 2009. In Annales Geophysicae 30(2):421-426). |
|
|
Zerbo JL, Ouattara F, Amory-Mazaudier C, Legrand JP, Richardson JD (2013). Solar Activity, Solar Wind and Geomagnetic Signatures. Atmospheric and Climate Sciences 3:610-617. |
|
|
Zoundi C, Ouattara F, Nanema E, Fleury R, Zougmore F (2013). CODG TEC variation during solar maximum and minimum over Niamey. European Scientific Journal 9(27):74-80. |
|
Copyright © 2024 Author(s) retain the copyright of this article.
This article is published under the terms of the Creative Commons Attribution License 4.0


