ABSTRACT
Adoption behaviour may be reflected as the predisposition of the behaviour of an individual during the adoption process of any innovation. Here, in the present study, the respondents were women stakeholders selected through panchayat. The study analysed their adoption behaviour towards azolla cultivation because the scientific azolla cultivation has been taken up as the innovation in terms of which the adoption percentage and behaviour was calculated for the present study. The study was conducted in five villages of Coochbehar-II block of Coochbehar district in West Bengal. Purposive sampling procedure was followed in the selection of the district, the blocks and also for the gram panchayats and random sampling procedure was followed in the selection of the villages and respondents in the present study. The adoption percentage was considered as the dependent variable and the other attributes of women stakeholders were considered as the independent variables for the study. The data were collected with the help of structured questionnaire schedule through personal interview method. The statistical methods used for the analysis of the data were co-efficient of correlation and multiple regressions. In the present study, it was found that the attributes like expenditure and knowledge about the technology are positively and significantly associated with the dependent variable and the attribute caste is significantly but negatively associated with the dependent variable, that is, adoption percentage of the women azolla growers. Results also showed that the variable annual income of the respondents is contributing negatively and significantly in case of characterizing the adoption percentage of the women azolla farmers. The R2 value being 0.719, it is to infer that the sixteen predictor variables put together have explained 71.90% variation embedded with the predicted variable, adoption percentage.
Key words: Adoption behaviour, women stakeholders, panchayat, azolla cultivation.
In the changed declared hegemony of the climate, the concept of adaptation is becoming more resilient day by day in global context. The connotation of adaptation can be achieved with the help of analyzing the adoption behaviour of technology user. Nowadays, the technology associated with the locally available resources is much more impactful in case of delineating the socio-economic and livelihood improvement of the local people. The people are mostly relying upon the technology which are cost effective, ecologically sound, simple in technology belongingness and economically profitable. The adoption behaviour of any individual is very complex in nature comprising number of successive stages starting from first hearing about an innovation to final adoption. When assessing farmers’ technology adoption behaviour, the methodology has to consider a number of inter-related factors such as the policy framework for farmers, the availability of technical information and the farmers’ perceptions, beliefs and motives (Beedell et al., 2000). Social scientists investigating farmers’ adoption behaviour has accumulated considerable evidence showing that demographic variables, technology characteristics, information sources, knowledge, awareness, attitude and group influence affect adoption behaviour (Oladele, 2005). Therefore, all agricultural development schemes and intervention programs in the study area should focus more on factors affecting adoption behaviour of farmers in order to encourage adoption and sustain the use of agricultural innovations (Tsado, 2008). So, it may be realized that the improvement of adoption process regarding a particular fruitful technology may empower the rural people through improving their livelihood and socio-economic situation. Not only that but also for all around development of a household needs to be refocused on the economic empowerment of the farm women through women-friendly technology. But, due to limitation in horizontal expansion of land and agriculture, the only alternative left is vertical expansion through various farm enterprises requiring less space and time. A combination of agriculture and livestock could be a possible option for this purpose because most of the farm families have domestic dairy cattle and through selling of their cattle’s milk, they can have an alternative source of income. But, the shortage of fodder due to ever decreasing area under cereals and fodder crops is getting compensated with increased use of commercial cattle feed, resulting in increased costs of milk production (Reddy, 2007). Therefore, livestock rearing is becoming less profitable. This problem can effectively be countered through introduction of azolla in the cattle feed because of its nutritional value and low cost. During the study for promoting livelihoods through dairy farming under the Orissa Watershed Development Mission (2011), it was found that dairy farmers who have too little land for fodder production can take up Azolla technology as it can be cheaply produced (at Rs.0.65/ kg of Azolla) in good quantities and be used as a cheap and nutritious cattle feed and also the cost of production of Azolla is much lower in comparison to other green fodders. In another study, it was observed that due to its high nutritional values and protein content, Azolla is suitable for human consumption and as feed supplement for variety of animals like fish, ducks, cattle, poultry etc. to reduce feed cost (Raja et al., 2012). Azolla is the most economic and efficient feed substitute for live stock which is very rich in proteins, essential amino acids, vitamins, growth promoter intermediaries and minerals like calcium, phosphorus, potassium, ferrous, copper, magnesium etc. (Lakshmi et al., 2012). All these bio-chemical constitutions of azolla and its rapid multiplication rate make azolla ideal organic feed substitutes for livestock (Biswas et al., 2013). Azolla can serve as a potential green feed supplement for the dairy cattle for the improvement in productive performance especially where/when green fodder availability is scanty (Chatterjee et al., 2013). A trail carried with azolla as feed substitute shows that there is an overall increase in milk production by 15 to 20% by supplementing feed with the same quantity of the plant on dry weight basis without affecting milk production (Benjamin, 2012). In a project for the development of disadvantaged areas of Bidar District (India), azolla production for increasing output from dairying was found to have the second highest benefit:cost ratio after production of worms for vermicomposting (Deshmukh et al., 2013). Besides all these things, azolla has some environmental benefits like it can serve as a candidate for the bioremediation of waste waters and effluents because it can accumulate excessive amounts of pollutants such as heavy metals, radio nuclides, dyes, pesticides, etc. (Sood et al., 2012). Therefore, in the present study, azolla cultivation has been taken up as the technology for assessing how easily it can be handled by the women and also its profitability.
Keeping all these in view, the present study constructed to analyze the adoption behaviour of the women stakeholders selected through panchayat and to identify the factors contributing towards their adoption behaviour for azolla cultivation.
The present study was conducted in five villages namely Jatrapur, Jibdharer Kuthi and Kaminir Ghat in Takargach-Rajarhat Gram Panchayat and Raserkuthi, Khairatibari villages in Dhandhinguri Gram Panchayat under the block Cooch Behar-II of Cooch Behar district in West Bengal. Purposive and random sampling procedures were followed for the selection of the respondents. The adoption percentage is considered as the dependent variable and the sixteen other attributes of the women stakeholders were considered as the independent variables for the study. The data were collected with the help of structured interview schedule through personal interview method. The collected data were processed with statistical tools like co-efficient of correlation and multiple regressions. The scientific azolla cultivation was the selected practice in terms of which the adoption percentage and behavior was calculated for the present study.
Table 1 presents the distribution of the women stakeholders selected through panchayat in Terai region of West Bengal according to their selected attributes. The results show that the age of the respondents ranges from 24 to 55 years. The mean score of the total distribution, age is 35.74 and standard deviation of the distribution is 8.80. The coefficient of variation value within the distribution 24.62% signifies the high consistency level of the distribution for the variable ‘age’. The education of the respondents ranges from illiterate to class three. The mean score of the total distribution, education is 1.26 and standard deviation of the distribution is 0.81. The coefficient of variation value within the distribution 64.29% signifies the medium consistency level of the distribution for the variable ‘education’. The variable caste of the respondent ranges from scores 2 to 3 means the caste schedule caste and other backward caste. The mean score of the total distribution, caste is 2.87 and standard deviation of the distribution is 0.34. The coefficient of variation value within the distribution 11.85% signifies the high consistency level of the distribution for the variable ‘caste’. The variable primary occupation of the respondents ranges from score 1 to 3 means from agricultural labour to business group. The mean score of the total distribution, primary occupation is 2.13 and standard deviation of the distribution is 1.29. The coefficient of variation value within the distribution 60.56% signifies the medium consistency level of the distribution for the variable ‘primary occupation’. The variable family size of the respondent ranges from scores 2 to 7 means the two members’ family to seven members’ family. The mean score of the total distribution, family size is 4.87 and standard deviation of the distribution is 1.14. The coefficient of variation value within the distribution 23.40% signifies the high consistency level of the distribution for the variable ‘family size’. The variable educational aspiration of the respondents ranges from scores 4 to 10. The mean score of the total distribution, educational aspiration is 6.04 and standard deviation of the distribution is 1.64. The coefficient of variation value within the distribution 27.15% signifies the high consistency level of the distribution for the variable ‘educational aspiration’. The variable farm size of the respondent ranges from scores 0 to 10.25 means landless to 10.25 bighas of land. The mean score of the total distribution, farm size is 1.47 and standard deviation of the distribution is 2.57. The coefficient of variation value within the distribution 174.83% signifies the very poor consistency level of the distribution for the variable ‘farm size’. The variable annual income of the respondent ranges from scores 10 to 72 means Rs. 10000 to Rs 72000. The mean score of the total distribution, annual income is 36.09 and standard deviation of the distribution is 17.90. The coefficient of variation value within the distribution 49.60% signifies the medium consistency level of the distribution for the variable ‘annual income’. The variable house type of the respondents ranges from scores 1 to 2 means kachha house to mixed house. The mean score of the total distribution, house type is 1.09 and standard deviation of the distribution is 0.29. The coefficient of variation value within the distribution 26.60% signifies the high consistency level of the distribution for the variable ‘house type’. The material possession of the respondents ranges from scores 1 to 10 means the little material to very good amount of material. The mean score of the total distribution, material possession is 2.87 and standard deviation of the distribution is 2.74. The coefficient of variation value within the distribution 95.47% signifies the very poor consistency level of the distribution for the variable ‘material possession’. The animal size of the respondents ranges from score 1 to 5 means one number to five numbers. The mean score of the total distribution, animal size is 2.65 and standard deviation of the distribution is 0.98. The coefficient of variation value within the distribution 36.98% signifies the high consistency level of the distribution for the variable ‘animal size’. The expenditure of the respondents ranges from score 0.60 to 8.40 means Rs. 600 to Rs 8400. The mean score of the total distribution, expenditure is 4.06 and standard deviation of the distribution is 2.42. The coefficient of variation value within the distribution 59.61% signifies the medium consistency level of the distribution for the variable ‘expenditure’. The risk orientation of the respondents ranges from score 27 to 42 means low risk orientation to medium risk orientation. The mean score of the total distribution, risk orientation is 35.48 and standard deviation of the distribution is 3.42. The coefficient of variation value within the distribution 9.64% signifies the very high consistency level of the distribution for the variable ‘risk orientation’. The knowledge about the technology of the respondents ranges from score 7 to 13 means low knowledge to medium knowledge. The mean score of the total distribution, knowledge is 10.83 and standard deviation of the distribution is 1.59. The coefficient of variation value within the distribution 14.68% signifies the very high consistency level of the distribution for the variable ‘knowledge’. The attitude towards the technology adoption of the respondents ranges from score 38 to 52 means medium to high positive attitude towards adoption. The mean score of the total distribution, attitude is 41.52 and standard deviation of the distribution is 2.86. The coefficient of variation value within the distribution 6.40% signifies the very high consistency level of the distribution for the variable ‘attitude’. The assessed training need of the respondents ranges from score 4 to 7 means four numbers to seven numbers of training need. The mean score of the total distribution, assessed training need is 5.48 and standard deviation of the distribution is 1.04. The coefficient of variation value within the distribution 18.98% signifies the high consistency level of the distribution for the variable ‘assessed training need’. The adoption percentage of the respondents ranges from score 0 to 90 means from very low to very high level of technology adoption. The mean score of the total distribution, adoption is 57.83 and standard deviation of the distribution is 30.29. The coefficient of variation value within the distribution 52.38% signifies the medium consistency level of the distribution for the variable ‘adoption percentage’.
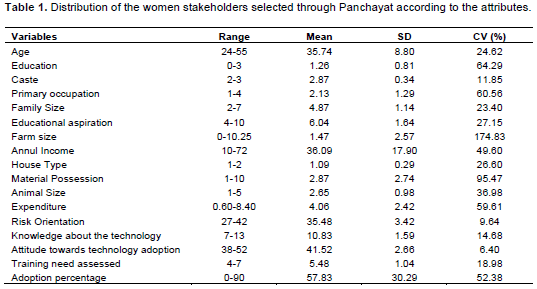
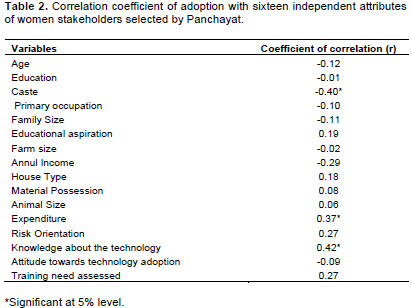
Table 2 presents the Pearson’s co-efficient of correlation among the adoption percentage of the women stakeholders selected by panchayat with sixteen causal variables. The result shows that the variable caste is negatively and significantly associated with the adoption percentage and the variables expenditure and knowledge about the technology are positively and significantly associated with the adoption percentage at 5% level of significance.
Caste and adoption percentage
The adoption of scientific azolla cultivation practices was higher in case of low-caste households. Abundance of family labour force, dependency on domestic animals and small farms and diminishing trend of employment in traditional professions of low-caste households are some of the major reasons for their higher adoption of scientific azolla cultivation practices. In the case of high-caste households one of the main reasons behind the low rate of improved scientific azolla cultivation practices is their better access to land that reduces their need to invest in their domestic animals rearing which is less productive. Other reasons are higher involvement of their children in the schools outside the village and increasing family labour shortages and their resource richness. Low-caste households on average are poorer than high-caste households both in terms of income and major assets like land holding. That is why the variable caste is negatively and significantly associated with the adoption percentage.
Expenditure and adoption percentage
Expenditure accurately depicts the investment for applying any technology in the real life situation. Always expenditure bears the cost for taking risk in application of technology. In other words application of technology occurs after the mental decision to adopt an innovation. In the present study the scientific azolla cultivation practices are adopted by the women stakeholders selected by the panchayat by incurring the expenditure to practice the scientific azolla cultivation throughout the year. That is why the variable expenditure is positively and significantly associated with the adoption percentage.
Knowledge about the technology and adoption percentage
Knowledge of the individual may be the cognitive pursuit to increase the wisdom of the individual. Knowledge always tries to help the individual to develop their mind set for analysing the pros and cons of the technology. Such pros and cons help an individual to take any decision in favour of the technology. Not only that but also it increases the exposure of an individual regarding the outer sphere for horizontal expansion of any innovation. In the present study the better knowledge about the scientific azolla cultivation of the women stakeholders selected by panchayat helps to adopt the technology in their own situation to use the azolla as the low cost supplementary feed for the cattle. The knowledge of the women stakeholders developed with the help of the training imparted by the Coochbehar KVK personnel. That is why the variable knowledge is positively and significantly associated with the adoption percentage.
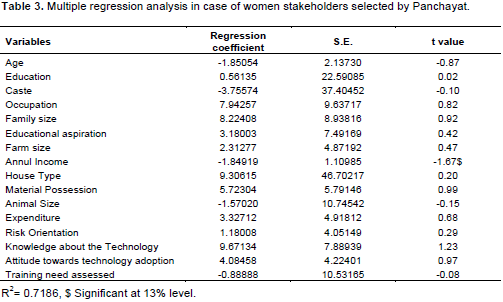
Table 3 reflects the multiple regression analysis of the predicted variable, that is, adoption percentage with sixteen predictor variables of the women stakeholders selected by the panchayat. From the table it is observable that the variable annual income is negatively and significantly contributing towards characterizing the adoption percentage at 13% level of significance.
Annual income and adoption percentage
Annual income is the economic indicator of an individual. It also helps to acquire respect and values in the society. The selected women are mostly economically deprived and have the capability to take risk for increasing their earning in a successful manner. In the present study it is found that the high annual income women group are reluctant to adopt the practices for increasing the earning from household livestock enterprise. Consequently, the variable annual income is positively and significantly contributing in case of characterizing the adoption percentage. One unit change of the variable annual income is delineating the 1.85 unit change in the predicted variable, adoption percentage.
The R2 value being 0.719, it is to infer that the sixteen predictor variables put together have explained 71.90% variation embedded with the predicted variable adoption percentage. Still 29.10% variations embedded with predicted one are unexplained. Thus it would be suggested that inclusion of some more contextual variables possessing direct bearing on the adoption percentage could have increased the level of explicability.
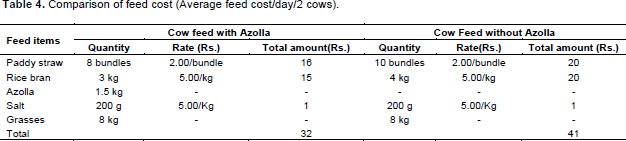
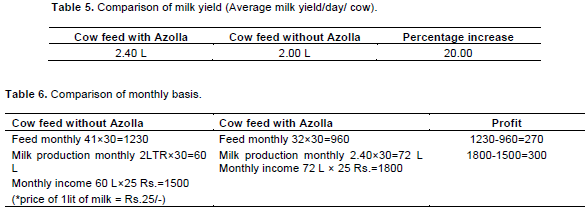
Table 4 reveals that per day cost for cow feed with azolla for 2 cows was Rs.32/- whereas the per day cost for cow feed without azolla for 2 cows was Rs.41/- that means using cow feed with azolla made a profit of Rs.9/- per day.
Table 5 shows that milk production has increased to 20% and lastly, Table 6 represents a calculated profit of Rs.570/- per month from using azolla as cattle feed.
In the changing dynamics of the social system, there is a need to consider the prerogative of the women farmers in decision making process in the inside (homestead activity) and outside (agricultural activity) activity of the development process. In this direction, it is of prime importance to know the adoption behaviour of the rural women before taking any new agricultural technology or innovation to them with an intention to empower them by providing opportunities for sustainable livelihood. This can only be achieved by finding out the factors influencing their adoption behaviour. Besides this, as the income from cropping alone is insufficient to sustain farmers’ family, a judicious mix of enterprises is recommended. Livestock rearing and selling of their milk is a very common phenomenon in the rural area besides cultivation to complement the farm income of farm families. In this context, azolla cultivation could pave its way by increasing the profit from livestock rearing because cow feed with azolla costs lesser than cow feed without azolla and also use of azolla as cow feed supplement increases the milk yield due to its nutritional value. Therefore, the present study has attempted to assess the determinants of the adoption behaviour of the rural women stakeholders for azolla cultivation because this livestock rearing is mainly managed by the farm women. It has been found that the variable knowledge about the technology has positive and significant relationship with the adoption behaviour while the family size of the rural women has been found to be negatively and significantly contributing towards characterizing the adoption percentage of the women stakeholders. Therefore, the variables stated above should be given major emphasis during planning and policy making to promote adoption of azolla cultivation by the farm women for making the livestock enterprise more profitable and sustainable which could lead to their socio-economic upliftment and empowerment to some extent and also to offer them with a sustainable livelihood.
The authors have not declared any conflict of interests.
REFERENCES
|
Beedell J, Rehman T (2000). Using social-psychology models to understand farmers' conservation behaviour, Rural Stud. 16:117-127.
Crossref
|
|
|
|
Benjamin RP (2012). Dairy farmers being motivated to cultivate azolla, The Hindu, Visakhapatnam, Andhra Pradesh, India.
|
|
|
|
|
Biswas S, Sarkar S (2013). Azolla cultivation: A supplementary cattle feed production through natural resource management, Agric. Update 8(4):670-672.
|
|
|
|
|
Chatterjee A, Sharma P, Ghosh MK, Mandal M, Roy PK (2013). Utilization of Azolla Microphylla as Feed Supplement for Crossbred Cattle, Int. J. Agric. Food Sci. Technol. 4(3):207-214.
|
|
|
|
|
Deshmukh RC, Balaji J, Gayatri B (2013). Integrated farming system for strengthening rural livelihood in disadvantaged areas of Bidar district, Int. J. Agric. Sci. 9(1):57-59.
|
|
|
|
|
Lakshmi V, Sailaja D (2012). Nutrient Content of Khoa Samples prepared from Azolla and Non Azolla Fed Cow Milk, Int. J. Biol. Pharm. Allied Sci. 1(3):364-369.
|
|
|
|
|
Oladele OI (2005). A Tobit Analysis of Propensity to Discontinue Adoption of Agricultural Technology among Farmers in South Western Nigeria, J. Central Eur. Agric. 6(3):249-254.
|
|
|
|
|
Orissa Watershed Development Mission (2011). Promoting Livelihoods through Dairy Farming, published by NR Management Consultants India Pvt. Ltd., New Delhi, India.
|
|
|
|
|
Raja W, Rathaur P, John SA Ramteke PW (2012). Azolla: An aquatic pteridophyte with great potential. Int. J. Res. Biol. Sci. 2(2):68-72.
|
|
|
|
|
Reddy GR (2007). Azolla - a sustainable feed substitute for livestock, Rural Development Organisation, Andhra Pradesh, India, www.karmayog.org accessed on 20.08.2010.
|
|
|
|
|
Sood A, Uniyal PL, Prasanna R, Ahluwalia AS (2012). Phytoremediation potential of aquatic macrophyte, Azolla. Ambio. 41(2):122-137.
Crossref
|
|
|
|
|
Tsado JH (2008). Factors affecting adoption behaviour of small scale farmers in Mariga local government area of Niger state Nigeria: The case of rice farmers. J. Agric. Forest. Soc. Sci. 6:2.
|
|