ABSTRACT
Pervious concrete (PC) pavement is a sustainable type of concrete pavement that can protect and restore natural ecosystem. The permeability coefficient is the most important characteristic of PC. The purpose of this experimental study was to investigate the effect of mixture design parameters, particularly water-to-cement ratio (W/C) and size of aggregate on the permeability coefficient of PC. The thirty six mixtures were made with W/C in range of 0.28 to 0.34, 350 kg/m3 cement content and 9.5 to 19.5 mm maximum size of aggregate. In this study the feasibility of using the artificial neural networks (ANN) in predicting the effect of aggregate size and W/C on amount of permeability coefficient of PC was investigated. For modeling, 65% of data was used for model training and remaining 35% was used for model testing. Based on the lowest root mean squared error (RMSE), the best ANN model was chosen. The results showed that the W/C and aggregate size are key parameter, which significantly affect the performance of PC. The ANN modeling was developed in this study can facilitate prediction permeability coefficient of PC. This approach can reduce the number of trial batches for target performance of samples.
Key words: Pervious concrete, artificial neural network, permeability coefficient.
Pervious concrete (PC) is a special type of concrete characterized by an interconnected pore structure and high void content, thus allowing infiltration of water through its structure. While its constituent materials are similar to that of normal concrete, PC contains little or no fine aggregate. It is also known as permeable concrete, porous concrete and no-fine concrete. PC has been used in low-traffic pavements such as parking lots and sidewalks (Schaefer et al., 2006). Permeability coefficient or hydraulic conductivity is the most important performance characteristic of PCs, and with any some material, transportation property are dependent on the pore structure features (Montes and Haselbach, 2006). The PC allows water to pass through its structure due to an increased air voids network. This open structure gives this concrete the added possibility to be applied in pavement engineering as a water drainage layer (Vassilikou et at., 2011). The costs of such asphalt pavements will grow the coming years due to the foreseeable increase in oil prices. PC is therefore a suitable material to be considered for increased usage in the developing sustainable pavement (Lian and Zhuge, 2010; Vancura, 2011; Sumanasooriya and Neithalath, 2011). Natural resources are increasingly consumed due to rapid urbanization and there after human construction activities, so that various strategies are being investigated by engineers to protect and restore natural ecosystems in the world. PC pavement is termed as comprising material that facilitate storm water infiltrate and transfer to the underlying subsoil (Suozzo and Dewoolkar, 2012; Shu et al., 2011).
The porosity is the ratio of the volume of voids to the total volume of the specimen. Some of the voids in PC are not effective in carrying water through the material. The voids, which are frequently called the ‘effective voids’ are important. Some methods for finding the porosity of PC only calculate the effective voids (Boyer et al., 2012; Shen et al., 2012; Tho-in et al., 2012). Some researchers recommends to finding the total porosity of PC using a water displacement method. The water displacement method is based on Archimedes principle of buoyancy, which states that the buoyancy force is equal to the weight of fluids displaced. In this method, the dry mass, submerged mass and the total volume must be known to calculate the porosity (Montes et al., 2005).
Since the permeability coefficient of PC is the most important characteristic of PC, in this experimental study, the characteristic of PC has been evaluated. It's believed that PC can effectively assist solving drainage problems and reducing the risk of flash flooding, resulting from continuous urban development. The most important mixture design parameters for PC that affect the performance and workability are aggregate size and water-to-cement ratio (W/C). PC made with different W/C has different permeability coefficient. In this study an ANN modeling approach was used to determine the effect of aggregate size and W/C on permeability coefficient of PC.
Materials and mixtures
A total of thirty-six PC samples were prepared and tested to determine the porosity content and permeability coefficient. The compositions used to prepare PC samples in this study consisted aggregates, ordinary Portland cement, and water.
All mixtures were designed with single size of crushed silica aggregates. The single size of aggregate defined as the size of sieve on which, 100% of aggregate was passed but all retained the sieve under that. Crushed silica aggregates with a size of 4.75-9.5, 9.5-12.5 and 12.5-19.5 mm were used in this study. Aggregates with a size of 4.75-9.5 mm were named fine and aggregates with a size of 9.5-12.5 mm were named medium and aggregates with a size of 12.5-19.5 mm were named coarse. Using single size aggregates for making samples, leads to gain higher porosity content. However, this approach reduces the workability of samples. The used aggregates were from the eastern area of Tehran. Three groups of samples for this study were developed. The first group was produced with only coarse aggregates with one grading (12.5-19.5 mm). The second group was produced with medium aggregates with one grading (9.5-12.5 mm). The third group was produced with fine aggregates with one grading (4.75-9.5 mm). The engineering properties of used aggregates are shown in Table 1.
For preparing all the PC mixtures, type 2 Portland cement was used. The chemical properties of used cement are shown in Table 2. The physical properties of used cement are shown in Table 3. All mixtures were produced by using single size aggregate and Portland cement with W/C of 0.28, 0.3, 0.32, and 0.34. 1400 kg of aggregates was used for making one cubic meter of PC mixes. The cement content of all the mixtures was around 350 kg/m3. The W/C was incrementally changed from 0.28 to 0.34. In this way, samples of different porosity were obtained. PC mixes were made from fine aggregates was named Fine PC (FPC), PC mixes were made from medium aggregates was named Medium PC (MPC), and PC mixes were made from coarse aggregates was named Coarse PC (CPC). This division was used to compare the performance of PC mixes made from different aggregates size.

For making samples, materials were mixed in a rotating-drum mixer. For each mixture, triplicates of 100 × 200 mm cylinders were prepared. The fresh concrete was compacted in molds in three layers same to the one described in ASTM C 192; Practice for making and curing concrete test specimens in the laboratory. Instead of mechanical vibration because of the risk of blockage of the PC open pore structure, each layer tamped 15 times using a standard compacting bar. Excess concrete above the upper edge of the mold, was removed and a steel trowel was used to press on the surface for levelling. All specimens were de-molded after 24 h and stored in the curing room at 95% relative humidity.
Density test was performed for hardened concrete samples by simple dimensional checks, followed by weighting and calculation. The average density was 1800 kg/m3 with a porosity of 37%. Picture of sample for permeability coefficient test is shown in Figure 1.
Testing procedure
Permeability test
The permeability coefficient test was measured using the falling head method. Permeability coefficient was calculated using the Darcy's law as gives:
Where A1 and A2 are the cross-sectional areas of the sample and the tube respectively, and L is the length of the specimen for typical specimen geometry, h1 or h2 are the initial and final heads of water and t is the time between transition water from h1 to h2. Picture of permeability coefficient test kit is shown in Figure 2.
The specimens were enclosed in a mold that was lined with a thin rubber sheet, and tightened with house clamps to minimize any flow along the sides of the mold that would affect the measurement of permeability coefficient. The sample was then connected to a vertical PVC pipe on both the upstream and downstream sides.
The apparatus was filled with water from the downstream end, to expel any air voids that may have been present in the PC sample. Once water head reached the top of the specimen, the apparatus was then filled from the upstream side. The system was allowed to reach equilibrium, at which time the water level was recorded, representing the head level on the downstream side. Maintaining the constant downstream head at a higher elevation than top of the PC sample provided full saturation throughout the test. The upstream water level was then increased to a height of 30 cm and the valve closed. The valve was then opened and water allowed to fall to a height of 10 cm, during which the time it look for the water level to fall was recorded. This head difference was expected to maintain laminar flow for the range of anticipated permeability coefficient.
Porosity test
The total porosity was measured by finding the difference of the PC sample cylinder weight submerged in the water and the weight after air drying for 24 h. The difference in the measured weights was then divided by the sample volume (mm3) as follow (Park and Tia, 2004):

Where p is the total porosity of the PC (%), w1 is the PC sample weight air-dried for 24 h (kg), w2 is the PC sample weight submerged under water (kg), v is the PC sample volume (mm3), and ρw is density of water (kg/mm3).
Artificial neural networks
ANNs are data processing systems consisting of a large number of simple, highly interconnected processing elements (artificial neurons) in an architecture inspired by structure of the central cortex of the brain (Hola and Schabowicz, 2005; Mansour et al., 2004). Much of success of neural network is due to such characteristic as nonlinear processing and parallel processing. Neural networks model techniques have been rapidly applied in engineering, business, psychology, science, and medicine in recent years. In civil engineering the methodology of neural networks has been successfully applied to a number of areas such as structural analysis and design (Hajela and Berke, 1991; Consolazio, 2000).
In this study for ANN modeling, the multilayer perception (MLP) is used. MLP is a feed forward artificial neural network model. MLP consists of multiple layers of nodes in a directed graph, with each layer fully connected to the next one. Three-layered ANN shown in Figure 3 was used in this study.
Three-layered feed forward neural networks (FFNN) are based on a linear combination of the input variables, which are transformed by a nonlinear activation function. The explicit expression for an output value of ANN is given by following equation:
Where wji is the weight in the hidden layer connecting the ith neuron in the input layer and jth neuron in the hidden layer; wjo is the bias for jth hidden neuron; fh is the activation function of the hidden neuron; wkj is the weight in the output layer connecting the jth neuron in the hidden layer and the kth neuron in the output layer; wko is the bias for the kth output neuron; fo is the activation function for the output neuron. The weights are different in the hidden and output layer, and their values can be changed during the process of network.
To examine how close the predicted data to the experimental ones, some different criteria are used. There are two types of graphical and statistical criteria goodness of fit where each has its own unique features, and is used for a specific purpose. Since the graphical method is not accurate and varies depending on opinion of individual person, the statistical criteria were used in this study. Root mean square error (RMSE) is the most widely used statistical criteria. Finally, the best model, based on the lowest root mean square error coefficient, is chosen;
Where n is the number of data, xe is experimental data, and xs is simulated data.
Effect of W/C and aggregate size
Table 4 shows the average measured properties of all PC mixes, including permeability coefficient and porosity. It can be seen from Table 4 that the highest permeability coefficient achieved in this study is 15.1 mm/s for mixture CPC1, which was produced from coarse aggregate. Mixture FPC4 has the lowest permeability coefficient of 8 mm/s, which was produced from fine aggregate.
Results indicated that reduction in permeability coefficient caused by size of aggregate was more than that by W/C. The W/C and its effects on PC mixes were evaluated in lab mixes by W/C of 0.28, 0.3, 0.32 and 0.34. Results show good relationship between permeability coefficient and W/C, supporting the conclusion that greater workability leads to a denser specimen with smaller permeability coefficient. Lab mixes had the highest permeability coefficient, had the lowest W/C.
ANN modeling
In this study 65% of data was used for model training and the remaining 35% are used for testing. Accordingly, the data are normalized according to the following formula and is then used in the neural networks.
Where yi is the normalized data, xi is the input data, and xmax is the maximum of the input data.
The process of network training is accomplished by a feedback propagation algorithm. This algorithm is based on the error-correction learning rule of Liebenberg-Marquardt. The activation function is hyperbolic tangent sigmoid type. This neural networks model has one input layer, one output layer, and one hidden layer.
Modeling of permeability coefficient by ANN; In order to predict the permeability coefficient values for aggregate size and W/C, the following relation was used;
The Importance factor and goodness-of-fit test results of permeability coefficient modeling using ANN are presented in Tables 5 and 6.
The relationship between the W/C and permeability coefficient was analyzed by performing ANN modeling. The results indicate a satisfactory trend as the W/C increased with decrease in permeability coefficient. In same W/C, Results shows that permeability coefficient of FPC are smaller than permeability coefficient of MPC and CPC. For a fixed W/C, sample making by coarse aggregate lead to an increase of permeability coefficient higher than 40%. This increase has seen in other W/C and has proved the important role of aggregate size.
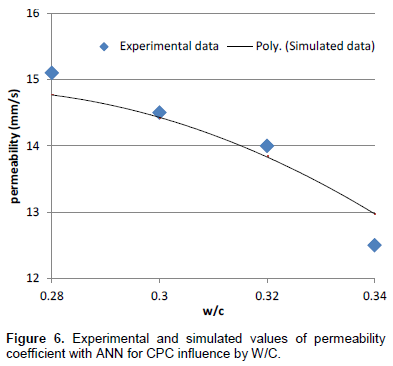
The experimental and ANN simulated data of permeability coefficient in terms of W/C content for different aggregate size are shown in Figures 4 to 6, respectively. In these figures, ANN simulated data are connected by using polynomial form.
Figure 4 illustrates the effect of W/C on permeability coefficient for FPC. The permeability coefficient of FPC generally decreases when the W/C increases. The highest permeability coefficient of around 11.3 mm/s can be seen when the porosity is higher than 39%. Small changes in W/C content can lead to higher changes in permeability coefficient of samples.
The effect of W/C on permeability coefficient for MPC is shown in Figure 5. The highest permeability coefficient of 12.9 mm/s can be seen when the porosity is higher than 40% for MPC1. The smallest permeability coefficient of 9.7 mm/s can be seen when the porosity is higher than 38% for MPC4.
The effect of porosity on permeability coefficient for CPC is shown in Figure 6. The highest permeability coefficient of 15.1 mm/s can be seen when the porosity is higher than 41% for CPC1. The smallest permeability coefficient of 12.5 mm/s can be seen when the porosity is higher than 39% for CPC4.
The low workability of PC indicates that the cement paste may have been stiff, and therefore may not have readily coated the pore in the mix. This lower density resulted in a greater amount of pore space available for water to pass through. This would also have contributed to the lower compressive strength. The higher W/C would have contributed to an increased workability as well as made more water available for hydration of the cement paste, resulting in a stronger concrete specimen.
Figure 7 shows experimental value and simulated value for permeability. It can be concluded from Table 6 and Figure 7 that permeability can be efficiently modeled by ANN. Furthermore, it was shown that the prediction permeability in fine aggregate was more accurate, it is because of decreasing of porosity.
In this study, the main properties of PC containing three aggregate sizes were investigated. Thirty-six (36) different mixes of PC were tested. The W/C and aggregate size had an effect on the hydrological properties like permeability coefficient and porosity. ANN revealed good relationships between W/C and permeability coefficient for PC. ANN can be used to simulate the influence of aggregate size and W/C on permeability coefficient of PC. The main conclusion remarks are summarized as follows:
1. The average water permeability coefficient of PC produced from single size aggregate is approximately 10 mm/s for FPC, 10.5 mm/s for MPC and 13 mm/s for CPC. If the size of aggregates increased then the porosity and permeability coefficient increase too.
2. As expected, if the W/C of PC increased, the porosity and permeability coefficient decrease.
3. ANN indicates that for permeability coefficient of PC samples, the W/C and size of aggregate are significant.
4. The average density of PC was around 1800 kg/m3 with a porosity of 37%.
5. Since the RMSE of the modeling results is less than 2%, it can be concluded that the ANN can be used as an accurate and fast tool for modeling the permeability coefficient test results.
6. This study also showed that the permeability coefficient can be easily ANN-modeled by using W/C data.
Abolfazl Hassani on behalf of other author confirms that there is not any known conflicts of interests associated with this publication and there has been no significant financial support for this work that could have influenced its outcome.
The authors gratefully acknowledge the support given by the laboratory team of the Tarbiat Modares University for their help to complete the laboratory tests and data collection.
REFERENCES
|
ASTM C 192 (2003). Standard practice for making and curing concrete test specimens. Annual book of ASTM standards 4.02. West Conshohocken, PA: ASTM international. |
|
|
|
Boyer M, Haselbach L, Cofer W (2012). Heat transfer finite element modeling in pervious concrete: Impacts of vertical porosity distributions. Transportation Research Board 91th Annual Meeting. January, Washington D.C. |
|
|
Consolazio GR (2000). Iterative equation solver for bridge analysis using neural networks. Comput.-Aided Civ. Infrastruct. Eng. 15(2):107-119.
Crossref |
|
|
Hajela P, Berke L (1991). Neurobiological computational models in structural analysis and design. Comput. Struct. 41(4):657-667.
Crossref |
|
|
|
Hola J, Schabowicz K (2005). Application of artificial neural networks to determine concrete compressive strength based on non-destructive test. J. Civ. Eng. Manage. 11(1):23-32. |
|
|
Lian C, Zhuge Y (2010). Optimum mix design of enhanced permeable concrete-An experimental investigation. Constr. Build. Mater. 24(1):2664-2671.
Crossref |
|
|
Mansour MY, Dicleli M, lee YJ, Zhang J (2004). Predicting the shear strength of reinforced concrete beam using artificial neural networks. Eng. Struct. 26(4):781-799.
Crossref |
|
|
|
Montes F, Valavala S, Haselbach LM (2005). A new test method for porosity measurements of Portland cement pervious concrete. J. ASTM Int. 2(1):1-13. |
|
|
Montes F, Haselbach L (2006). Measuring hydraulic conductivity in pervious concrete. Environ. Eng. Sci. 23(2):960-9.
Crossref |
|
|
Park SB, Tia M (2004). An experimental study on the water-purification properties of porous concrete. Cem. Concr. Res. 34(2):177-184.
Crossref |
|
|
|
Schaefer V, Wang K, Suleiman M, Kevern J (2006). Mix design development for pervious concrete in cold weather climates. Final report, National centre of concrete pavement technology, Iowa state university, Ames, IA. |
|
|
|
Shen S, Burton M, Jobson B, Haselbach L (2012). Pervious concrete with titanium dioxide as a photo catalyst compound for a greener urban road environment. Transportation Research Board 91th Annual Meeting. January, Washington D.C. |
|
|
Shu X, Huang B, Wu H, Dong Q, Burdette EG (2011). Performance comparison of laboratory and field produced pervious concrete mixtures. Constr. Build. Mater. 25(1):3187-3192.
Crossref |
|
|
Sumanasooriya MS, Neithalath N (2011). Pore structure features of pervious concrete proportioned for desired porosities and their performance prediction.¬ Cem. Concr. Compos. 33(2):778-787.
Crossref |
|
|
Suozzo M, Dewoolkar M (2012). Long-term field monitoring and evaluation of maintenance practice of pervious concrete pavements in Vermont. Transportation Research Board 91th Annual Meeting. January, Washington D.C.
Crossref |
|
|
Tho-in T, Sata V, Chindprasirt P, Jaturapitakkul C (2012). Pervious high clacium fly ash geo-polymer concrete. Constr. Build. Mater. 30(2):366-371.
Crossref |
|
|
Vancura M, Mc Donald K, Khazanovich L (2011). Microscopic analysis of paste and aggregate distress in pervious concrete in a wet, hard freeze climate. Cem. Concr. Compos. 33(2):1080-1085.
Crossref |
|
|
|
Vassilikou F, Kringos N, Kotsovos Scarpes A (2011). Application of pervious concrete for sustainable pavements: A Micro-Mechanical Investigation. Transportation Research Board 90th Annual Meeting. January, Washington D.C. |