The water binding capacity of the starches significantly increased with temperature with high increases observed between 50 to 70°C for all starches (Table 1). Generally, cassava starches exhibited significant higher WBC values than sweetpotato and cocoyam starches at all temperatures. Between 50 to 90°C, WBC values ranged from 1.49 to 38.70, 1.28 to 28.31 and 1.47 to 24.71 g H2O g-1, for cassava, cocoyam and sweetpotato starches, respectively. Variations in WBC within the same botanical source were also observed. Among the cassava genotypes, starch from Sauti displayed the highest WBC at the three temperatures whilst among the cocoyam accessions, starch from Chitipa accession exhibited higher WBC values at 70 and 90°C. No consistent trends were observed among sweetpotato starches. Water binding is a measure of the amount of water that starch granules are able to hold and depends on the capacity of starch molecules to hold water through hydrogen bonding. These observed differences in WBC therefore, indicate the differences in the intensity of the hydrogen bonds forms and the degree of availability of water binding sites among the starches (Hoover and Sosulski, 1986). This ability to hold water is a desirable characteristic in the food industry for consistency of food products. Therefore cassava starches are better suited for the food industry as gelling agents than cocoyam and sweetpotato starches (Gbadamosi et al., 2013). They could also be used in frozen food products as stabilisers and emulsifiers as starches with high WBC usually bind more water preventing syneresis (Otegbayo et al., 2013).
Swelling power and solubility patterns
The swelling power of the starches increased with increasing temperature from 50 to 90°C. This is probably due to the breaking of intermolecular hydrogen bond in the amorphous areas (De la Torre-Gutiérrez et al., 2008). There were significant variations in swelling power among the starches. Generally, the cocoyam and sweetpotato starches exhibited lower swelling power than cassava starches at all temperatures; cassava starches exhibited the highest swelling power (Table 2). The swelling power of the cocoyam starches ranged from 2.29 to 34.10 g g-1 from 50 to 90°C while that of sweetpotato starches ranged from 2.49 to 28.22 g g-1 from 50 to 90°C. Swelling power of cassava starches ranged 2.50 to 43.81 g g-1 from 50 to 90°C. These results agree with those reported by Wickramasinghe et al. (2009). They reported higher swelling power for cassava starches than taro (Colocasia esculenta) and sweetpotato starches. Gbadamosi et al. (2013) also reported higher swelling power for cassava starches than cocoyam starches. However they reported lower values of swelling power for cassava and cocoyam starches than the ones observed in this study. Bentacur-Ancona et al. (2001) reported higher swelling power values (58.8 g g-1) for cassava values than the ones obtained in this study.

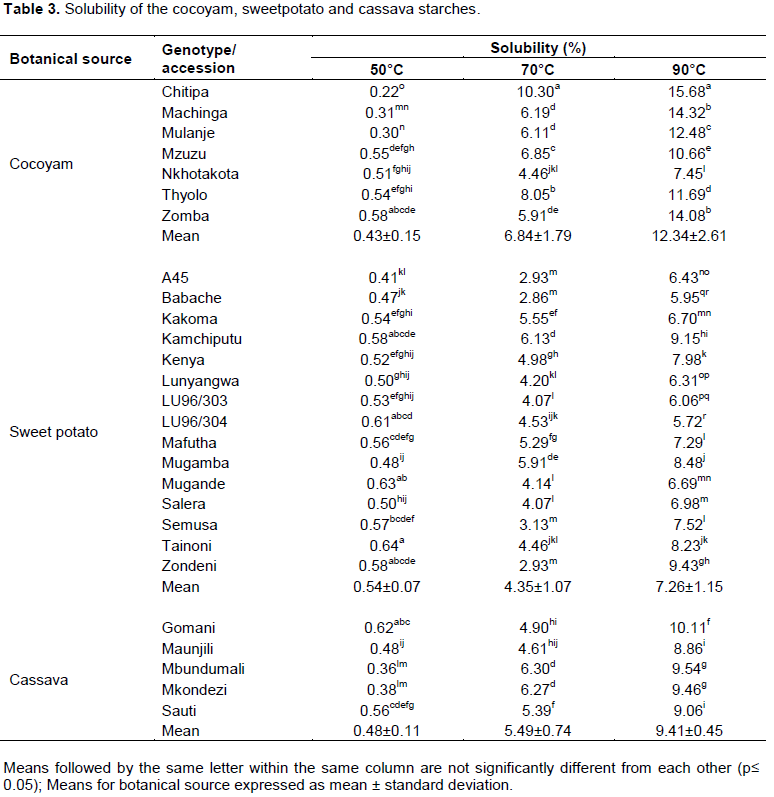
Solubility of the starches increased with increasing temperature (Table 3). This is because an increase in temperature increases the mobility of starch granules thereby facilitating dispersion of starch molecules in water. The heated and swollen starch granules consequently for allow amylose exudation (Adebowale et al., 2002). Cocoyam starches generally displayed higher solubility than cassava and sweetpotato starches, and sweetpotato starches displayed the lowest solubility. Solubility of cocoyam, cassava and sweetpotato starches ranged from 0.22 to 15.68%, 0.36 to 10.11% and 0.41 to 9.43% from 50 to 90°C, respectively. These results contrast those of Gbadamosi et al. (2013) who reported higher solubility for cassava starches that cocoyam starches.
Both swelling power and solubility provide evidence of the magnitude of interactions between starch chains within the amorphous and crystalline regions. Swelling power is influenced by a strong bonded micellar network and amylopectin molecular structure decreasing with increasing crystallite formation by the association between long amylopectin chains (Srichuwong et al., 2005; Gujska et al., 1994; Sasaki and Masuki, 1998). Thus, the differences in the extent of swelling observed in this study indicate differences in structures among the starches. The differences in solubility of the starches could largely be due to granular and molecular structural differences among the starches (Bello-Pérez et al., 2000; Tian and Rickard, 1991). The high swelling power of cassava starches coupled with high water binding capacity makes them ideal for their exploitation in the food industry where they could be utilised as thickeners.
Paste clarity and stability
Generally, cassava starches had higher paste clarity (33.8±6.0%) than sweetpotato (16.1±2.5%) and cocoyam (15.9±3.5%) starches (Table 4). The paste clarity of the cocoyam and sweetpotato starches was comparable. Maunjili starch exhibited the highest paste clarity among the cassava starches whilst Mugande, Semusa and Kenya starches displayed higher paste clarity among sweetpotato starches. Chitipa and Mzuzu starch provided the highest clarity among the cocoyam starches. Nwokocha et al. (2009) also reported higher paste clarity for cassava starches than cocoyam starches. Amylose and phosphorus contents are known to influence clarity of starch pastes. High amylose content may result in more opaque starch pastes (Schmitz et al., 2006), while presence of high amounts of phosphate groups tends to increase starch paste clarity (Jane et al., 1996). Lower paste clarity of cocoyam and sweetpotato starches compared to cassava starches suggests the presence of amylose molecules of high susceptibility to retrogradation (Craig et al., 1989).

For the five days of refrigerated storage, opacity of the cocoyam, sweetpotato and cassava starch paste increased (Table 4). Greater increases in opacity were observed in cocoyam and sweetpotato starches than in cassava starches indicating higher retrogradation tendencies for cocoyam and sweetpotato starches than cassava starches. Turbidity development during storage arises from interaction of several factors, such as granule swelling, granule remnants, leached amylose and amylopectin, amylose and amylopectin chain length, intra or interbonding, and lipid (Jacobson et al., 1997). The high retrogradation tendencies displayed by cocoyam and sweetpotato starches in this study suggest that these starches are not ideal for food products that require freezing and thawing. However low retrogradation tendencies displayed by cassava starches makes them ideal for such application.
Paste viscosity and syneresis
Generally cassava starches exhibited higher paste viscosity than sweetpotato and cocoyam staches (Table 5). The paste viscosity ranged from 10140 to 14033 cps, 5333 to 8733 and 6067 cps 12733 cps for cassava, cocoyam and sweetpotato starches, respectively.Thus cassava starches displayed the highest tendency to form viscous pastes than cocoyam and sweetpotato starches. Gbadamosi et al. (2013) reported the contrary; they found that cocoyam starches had the greatest tendency to form viscous pastes. Since starches are used in industries to impart viscosity, the use of cassava, sweetpotato or cocoyam starches will be determined by the desired viscosity of the end product. Cassava starches could be explored in the adhesive industries where high viscosity provides and appreciable binding capacity.
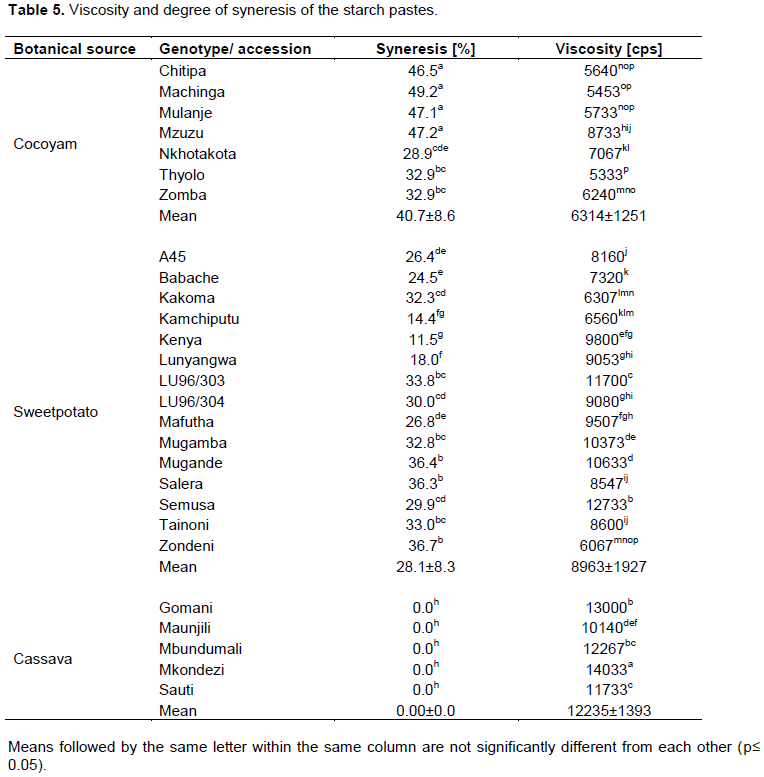
Syneresis is the exeudation of water from frozen gels during retrogradation process and is therefore an indication of retrogradation tendencies of the starch pastes (Otegbayo et al., 2013). The degree of syneresis ranged from 28.9 to 49.2%, 11.5 to 36.7% for cocoyam and sweetpotato starches respectively, and was 0% and for cassava starches (Table 5). Thus cassava starches were more stable to freeze-thawing than cocoyam and sweetpotato starch. Cassava starch could therefore be better suited for use in frozen products than cocoyam and sweetpotato starches (Vaclavik and Christian, 2014). Higher tendencies to lose water for sweetpotato and cocoyam starches indicate that they will have limited application in frozen food products.
Gelatinization
The gelatinization temperatures ranged from 69.4-81.4, 68.5-79.2 and 60.1-76.8°C for cocoyam, sweetpotato and cassava starches, respectively (Table 6). Generally, cocoyam starch exhibited higher onset, peak, and conclusion temperatures than sweetpotato and cassava starches. Thus cassava starches gelatinised at lower temperature range than cocoyam and sweetpotato starches. The low gelatinisation temperatures for cassava starches suggest they could be used in the adhesive industries as minimal heat energy would be required when producing hot-melt glues. The enthalpy of gelatinisation ranged from 13.1-15.1, 8.3-14.7 and 10.5- 12.9 J/g for cassava, cocoyam and sweetpotato starches, respectively. On average, enthalpies of gelatinisation for cocoyam and cassava starches were comparable but higher than those of sweetpotato starches. These results are in agreement with those reported by Nwokocha et al. (2009). They reported lower gelatinisation temperature range for cassava starches (60.11- 72.67°C) than cocoyam starches (72.96- 80.25°C) however the gelatinisation enthalpy was higher in cocoyam starches than cassava starches. Pérez et al. (2005) also reported higher enthalpy of gelatinisation for cocoyam starches than cassava starches. During gelatinisation, there is loss of molecular order within starch granule and therefore the gelatinisation enthalpy gives an overall measure of degree of organisation (crystallinity). Thus the higher gelatinisation enthalpy values for cassava and cocoyam starches suggest a more orderly arrangement of starch molecules. Therefore there is lower degree of organisation in sweetpotato starches leading to lower enthalpies of gelatinisation (Singh et al., 2006).
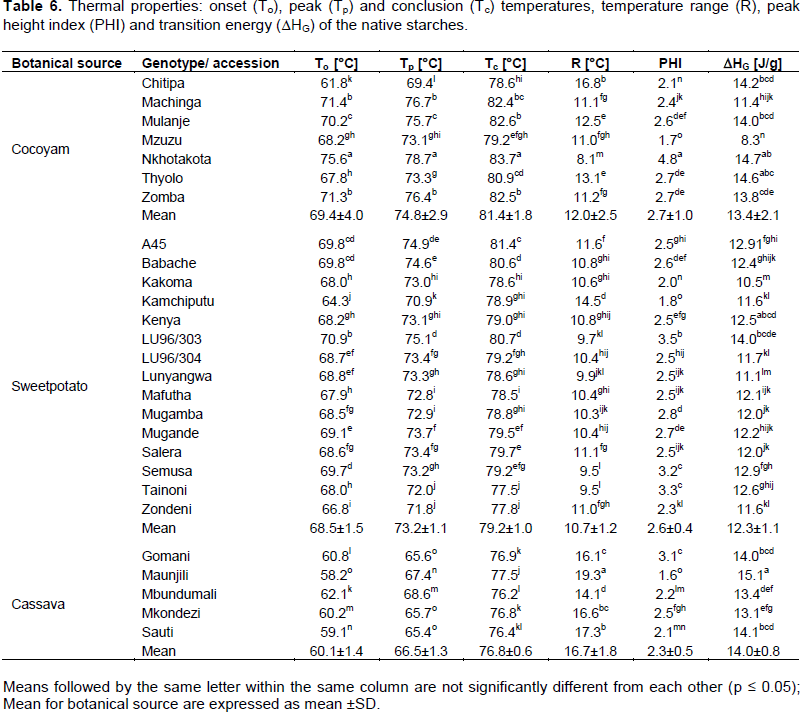
Temperature range values of the starches ranged from 16.7±1.8, 12.0±2.5 and 10.7±1.2°C for cassava, cocoyam and sweetpotato starches, respectively. Cassava starches exhibited a higher temperature range than that of cocoyam and sweetpotato starches. The peak height index values of the cassava, sweetpotato and cocoyam starches fell within the same range. The peak height index values ranged from 1.6-3.1, 1.8-3.5 and 1.7-4.8 for cassava, sweetpotato and cocoyam starches. However, significant (p<0.001) variations in PHI values were observed within starches from different sweetpotato and cassava genotypes, and cocoyam accessions. Temperature range of gelatinization and PHI are indicative of the distribution of starch granules; the more heterogeneous the granules, the broader the temperature range and the lower the PHI (Sandhu et al., 2005; Karim et al., 2000). Higher amylopectin content can also lead to the narrowing of temperature range of gelatinization (Krueger et al., 1987). Thus, the differences in gelatinization temperature range and PHI of cassava, sweetpotato and cocoyam starches indicate the differences in heterogeneity and amylose/amylopectin ratio.
Retrogradation
Retrograded starches displayed lower gelatinization temperatures and smaller enthalpies (Table 7) than raw starches indicating weaker crystallinity (Sasaki, 2005). Enthalpy of retrogradation was significantly higher for cocoyam starches than both sweetpotato and cassava starches resulting in higher levels of retrogradation. Cocoyam starches exhibited higher degree of retrogradation than sweetpotato and cassava starches indicating rapid retrogradation for cocoyam starches. Higher retrogradation tendencies are attributed to crystallization involving small amylose molecules and long chain amylopectin (Peroni et al., 2006; Gudmundsson, 1994) whereas lower degree of retrogradation is attributed to higher content of short branches of amylopectin chains and long amylose molecules (Spence and Jane, 1999). The greater degree of retrogradation in cocoyam starches could therefore be attributed to higher contents of short amylopectin branches (Shi and Srib, 1992). Thus, the differences in the retrogradation tendencies of the starches confirm composition and structural differences exist among the starches from the three crops.

Principal component analysis (PCA)
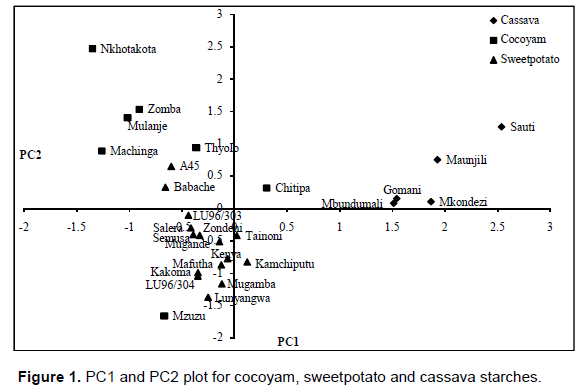
The results of PCA are presented in Tables 8 and 9 and Figures 1 and 2. The first three principal components explained 85% of the total variability. Principal components 1, 2, and 3 accounted for 63.4, 13.6, and 8.3% of the variability, respectively.
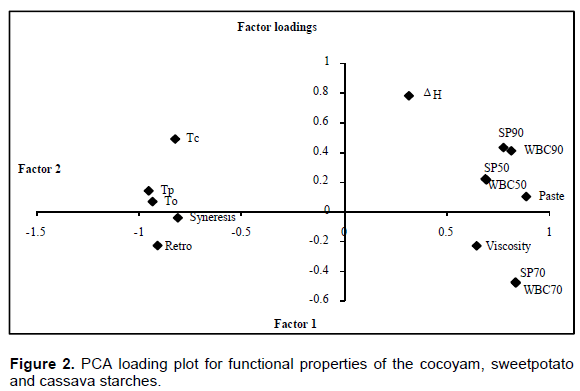
Principal component 1 separated mostly cocoyam starches (Nkhotakota, Machinga, Mulanje and Zomba) from cassava starches (Sauti, Maunjili, Mkondezi, Gomani and Mbundumali) whereas component 2 separated the cocoyam and cassava starches from most of the sweetpotato starches (Figure 1). The factor loading revealed that principal component 1 contrasted cassava starches with cocoyam starches with respect to paste clarity, viscosity, water binding capacity and swelling power, gelatinisation temperatures, syneresis and degree of retrogradation. Cassava starches exhibited higher paste clarity, viscosity, water binding capacity and swelling power but lower gelatinisation temperatures, syneresis and degree of retrogradation (Figure 2). Principal component 2 contrasted cassava and cocoyam starches with sweetpotato starches with respect to gelatinisation enthalpy, swelling power and water binding capacity: Cassava and cocoyam starches displayed higher gelatinisation enthalpy, swelling power and water binding capacity than sweetpotato starches (Figure 2).
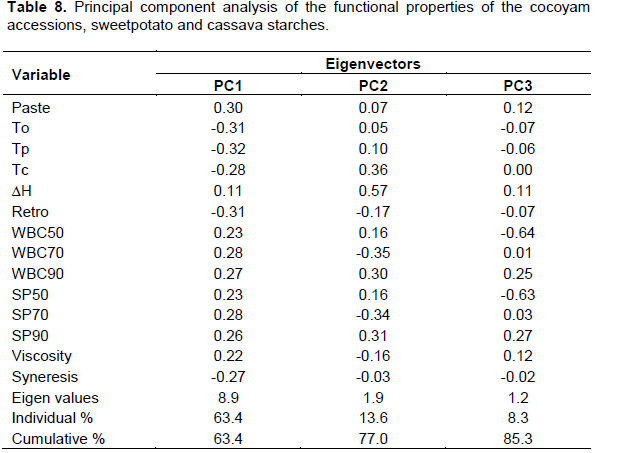

The factor loading revealed that cassava starches were contrasted with cocoyam starches in terms of high paste clarity, viscosity, water binding capacity and swelling power, lower gelatinisation temperatures and lower degree of retrogradation and syneresis. The plot also showed that that cocoyam starches (Nkhotakota, Zomba, Mulanje and Machinga) had the lowest negative scores. These starches were discriminated in terms of their higher degree of syneresis and retrogradation, higher gelatinization temperatures and lower water absorption capacity, swelling power, viscosity and paste clarity.
The correlation matrix (Table 9) showed that swelling power, water binding capacity, viscosity and paste clarity were closely related. These variables were positively correlated. On the other hand gelatinisation temperatures (To, Tp) and syneresis were also close to each other. Kong et al. (2009) also reported significant positive correlation between gelatinization temperatures, To, Tp, and Tc and the enthalpy. There was significant negative correlation between swelling power, water binding capacity, viscosity and paste clarity with gelatinisation temperatures (To, Tp, Tc), retrogradation and syneresis.
This is in agreement with results of Singh et al. (2006), who reported a significant correlation between swelling power and gelatinization temperatures, and syneresis. However, swelling power was negatively correlated with setback viscosity. Singh et al. (2004) also reported positive correlation between swelling power and light transmittance, peak and conclusion gelatinisation temperatures but a negative correlation with water binding capacity.