Energy consumption by occupants during utilization phase concerns the increase of global warming potential and a shortage of energy resources. Energy consumption in an effective way decreases the risk of global warming. Use of materials with high embodied energy and embodied carbon in building components may improve the energy performance of the building, but it can ameliorate global warming. The issue of Life Cycle is quite new in the Middle East, so is it effective or does it work in developing countries. One of the goals of this study is to use three different wall types in a two-story office with close embodied energy and U-value (overall heat transfer coefficient) and compare the performance of each wall in the building from the Life Cycle point of view. Subsequently, analyzing the importance of other factors such as embodied carbon and transportation in choosing appropriate material in the construction sector. According to this study, even in countries like Iran (‘‘which holds the world's fourth-largest proved crude oil reserves and the world's second-largest natural gas reserves’’) with very low amount of database about the embodied energy, the right material should be chosen to reduce the fuel consumption and CO2 emission.
After Saudi Arabia, Iran is the second-largest oil-consuming country in the Middle East. Over the past few years, Iran has expanded its domestic refining capacity to meet the country’s demand, particularly for gasoline. Almost all of the products which are produced in Iran are made from local oil. A huge amount of this oil and gas is consumed in the construction sector. These huge amounts of gas and oil are consuming to extract the raw material, transportation of the material to the factory, and production stage. Likewise; the installation part and usage stage also consumes lots of oil and gas. At the last stage of the energy consumption, also, too much energy consumed for disposal and recycling part (cradle to grave). According to the Statistical Centre of Iran, more than 446 million barrels of crude oil consumes at the domestic, public and commercial sector. Electricity consumption in public sector is about 19767 GWh which is equal to the 9% of yearly consumption (www.amar.or.ir). Research about the energy consumption at building industry shows that more than 40% of whole countries energy consumption is consumed at building industry. Energy price at Iran is low, so consumers do not pay high cost bills. Energy subsides are mostly paid by the government; therefore, if the energy consumes efficiently by the consumers, it will have huge benefits for the country (www.old.ifco.ir). Therefore, energy consumption at each climate must obey some rules based on researches. There is not so many research about the life cycle assessment of buildings at Tehran, so this research may help to the architects and constructors to design more efficiently.
ISO 14040 series consider the life cycle assessment and introduce some criteria’s and methods for life cycle assessment of the buildings. Many studies are inquired the energy consumption of different types of building in different climates. Besides, too many simulation programs have been producing to calculate the operating energy of the buildings, as an example Energy plus, DesignBuilder, Equest, Ecotect and some plugins of rhino. These calculations are done hourly, daily, monthly and yearly to represent the energy performance of the buildings that can help to conserve energy (Ascione et al., 2014). For this study, the more appropriate one is DesignBuilder, because of that, this simulation software was chosen.
It is the climate that specifies the role of each stage at life cycle assessment, and where the building is situated, the operational energy of the building through usage phase contributes 52 to 82% of the total life cycle energy consumption during the 50-year life span. It is obvious that 82% operating energy relates to one of the hot or cold climates because the high amount of energy needs to prepare the condition for living in the building. The remaining percentage between 18 to 48% is varied according to the embodied energy consumption demolition and transportation (Adalberth, 1997; Suzuki and Oka, 1998; Ramesh et al., 2010). Some countries consider the life span of the buildings 40 years and some of them 80, so they may get different results in the same climate. With increasing the life span of the buildings, the importance of the embodied energy, demolition and transportation become inconsiderable (Thiel et al., 2013).
A study about the major refurbishment of an office in Auckland, New Zealand with changing the building envelope with additional insulation, modified wall-window ratio, solar shading as well as technical replacement of the lighting and HVAC system showed that deep energy refurbishment is associated with significant environmental impacts mainly due to the use of energy-intensive construction materials (Ghose et al., 2017).
Correlation 1 between the energy consumption in MJ and the CO2 footprint in Kg is used to convert the CO2 footprint to energy consumption and vice-versa (Cabeza et al. 2013):
CO2 footprint 0.08 Energy consumption (1)
This study assesses life cycle of three different wall types in an office building and compares the role of each life cycle stage in the whole LCA. The case study is an office that has two level, and the overall heat transfer coefficiency for all three type of walls are close to each other because the U value of the walls is almost same. Regions with the high importance of embodied energy must be designed more carefully, because of the importance of the materials and thermal performance of them in reducing operating energy. The operating energy for the office building is done with DesignBuilder simulation software. This study does not consider the life cycle cost of the office building.
Researchers use different methods to assess the life cycle. There are some ambiguous aspects of the process that make it difficult to understand whole stages of life cycle. One ambiguous aspect is embodied energy and embodied database. Eco invent database, and Gabi database is a trustworthy database that is available, but this database is not cover all the materials. Likewise, these data belong to the special country that is not same in all countries. While producing of materials, factories use different fuel types and processes, so footprints and embodied energy/carbon of the database will vary from country to country (Sartori and Hestnes, 2007). Carbon footprints data for this study are gathered from Inventory of Carbon and Energy (ICE), and Environmental Product Declaration (EPD) database.
All of the data may not give us the exact results because the database is related to the Germany and the United Kingdom, but the results will be close to the exact number.
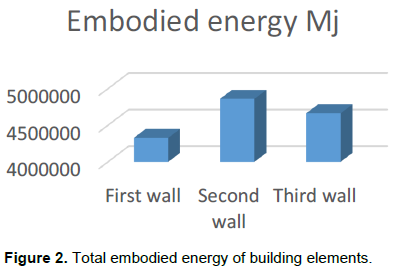
Figure 1 briefly, expresses the life cycle steps from cradle to grave. Construction machinery consume lots of energy through extracting the raw materials. Transporting the raw material from mine to the factory, release lots of CO2 to the environment. Raw material should prepare to be used as the construction building material and for this purpose, machines in the factory consume lots of energy to build the material. Through this process, lots of CO2 and energy release. All these steps call cradle to gate, and the data about all of these steps gathered from databases that are mentioned before (Menzies, 2011; Hammond and Jones, 2008; Pfundstein et al., 2008). Materials must distribute from factory to the distributors or construction site. During transportation, up to the vehicle that does the transportation, lots of CO2 release to the environment.
After finishing the construction, occupant starts to use the building. To prepare the comfort for the occupants up to the energy performance of building too much electricity and gas consume for heating, cooling, ventilating and lighting space. According to ISO 14040 series disposal and depletion are the last stages that can be considered through life cycle assessment, but because of their low impact on the life cycle (less than 1%), both are ignored through this study (Ramesh et al., 2012). This study does not calculate the effect of other gas emissions and disposal.
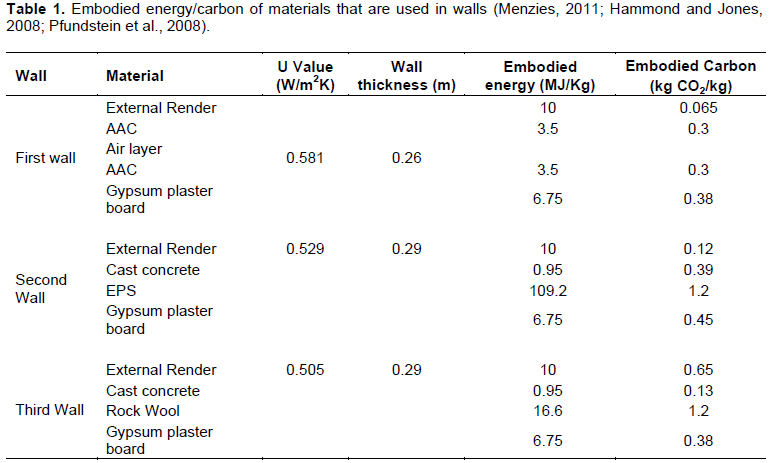
This study uses three different wall types with close U values and thickness of 0.26 and 0.29 m. Table 1 represents the components, U value and the thickness of each wall. For this study, three different wall types were considered with different U values and different materials. The U value for all glazing types set to be 1.9 W/m2K. Tables below show the detailed feature of each wall type. Too many inorganic insulating and organic materials are in the market, for this study rock wool and expanded polystyrene are selected, because few of the materials have a density between 20 and 80 kg/m3. The most appropriate density for the insulating materials is between 20 and 80 kg/m3 because at lower densities, the heat transmitted by radiation increase and at higher densities the heat transmitted by heat conduction increase. So because of this, insulating materials decided to be EPS and Rockwool (Pfundstein et al., 2008).
Therefore, first of all, this study calculated the embodied energy and embodied carbon of the building. Then CO2 emission during transportation for the building materials is calculated. The last stage calculates the operating energy of the office which is done with DesignBuilder simulation software. After all, the results are added to represent the life cycle of the office.
Condition
A case study is a two-story office building with an 1876 m2 occupied area that is located in Tehran, Iran. A two-story office with thirteen zones that the occupants work 10 hours a day at the office except to holidays. The objects studied are construction materials of the buildings with the latitude of 35.68 and longitude of 51.32. The opaque surface for the office is considered to be 445 m2. Likewise, the number of occupants in the office are 50 people, so the density is modified to be 0.03 person per m2. For the convenience of the occupants during summer and winter time during working hours the set point temperature adjusted to be 24 and 19°C and the setback temperature for the times when the building is empty adjusted to be 28 and 15°C.
Grid electricity is used for the appliances such as refrigerators, laptop computers, monitors, printers and lighting systems. Iran is full of gas, and most of the mechanical systems are working with gas, so for this study gas is used to heat, cool and ventilate the building. The radiator is choosen as a hot water heating system with coefficient of performance (COP) of 0.75.
According to the space function, each space needs its light demand to see the objects. More illuminance needs more energy consumption. It is better to use the controlling system and appropriate lamps with high coefficiency to reduce the energy consumption by lighting. Generally, in an office, 500 lux is enough for most of the spaces. Corridors need between 150-300 lux. T8 fluorescent lamps with high efficiency used for the office that consumes 10.8 watts per meter square (Jayamaha 2007). The heating system should be chosen based on space type and actual time schedule of usage. With the concept of indoor temperature demand, it is feasible to enhance energy efficiency and reduce environmental impact without deteriorating the indoor environment (Kosonena, Hagströma, Laineb, Martiskainen, 2003).
Evaluating embodied energy
CO2 emission in construction materialization stage is the key factor of architectural life cycle assessment. This factor depends on both emission time and absolute emission volume (Luo et al., 2016).
There is the traditional way to calculate the EBE for all building types. First of all, the amount of each material should be calculated according to the design features. Then, the amount of each material should multiply with the embodied energy of it. In the end, all of the multiplied numbers must add with each other to represent the total embodied energy of the building. The same method should use to calculate all components, such as windows and doors. As the building is constant for this study and just the walls are changing, so the EBE of doors, windows and other objects neglected through this study.
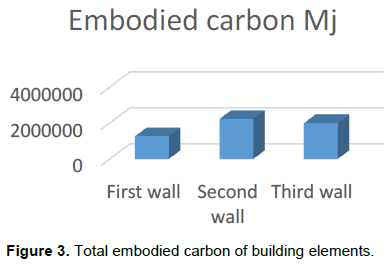
Figure 2 contribute the total embodied energy of the office building with wall type one to three. The quantity of external render and gypsum plaster board is the same for all wall types so that the EBE will be the same. Wall type 2 with cast concrete and EPS have the maximum EBE among others while the first wall with two layers of aerated concrete and the air between layers with total 4327968 MJ have minimum EBE. However, the embodied energy of the aerated concrete is more than cast concrete, but EPS and Rock wool that are used as insulation materials caused to increase the EBE of the second and the third wall.
Evaluating embodied carbon
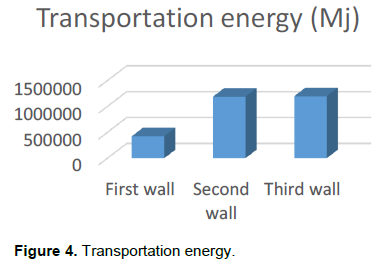
The method that is used to calculate the embodied energy can apply for calculating the embodied carbon. The only difference is substituting the EBE of each material with embodied carbon of it. Regarding embodied CO2, as shown in Figure 3, all three types of walls have impacts between 101481 and 178303 KgCO2/kg. As all units are in MJ equation (1) is used to convert the kgCO2/Kg to MJ. The first wall has the minimum impact on the environment, and this is because of lack of insulating materials. Layers and amount of the materials in wall two and three are the same except for insulation material. Because of EPS, there is 231200 MJ difference in embodied carbon of the wall two and three. Using aerated concrete without any insulation cause to reduce the 960287 MJ embodied energy of the building.
Evaluating transportation energy
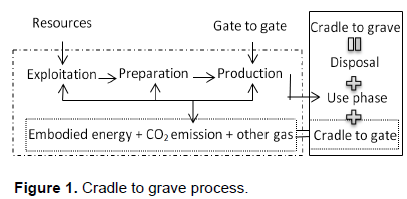
Production of the building material and transportation of them to the building site to form the building can change the total embodied energy of buildings (Reddy and Jagadish, 2003). CO2 emission through transportation is varied up to the vehicle, fuel type, weight and the volume of the material. Gabi is a trustworthy simulation software that can calculate some CO2 emissions through transportation according to the fuel type that is used in the country. The average distance between the factory and the site, supposed to be 20 km for this study, and the 15-tonne truck is chosen to transport the materials. Figure 4 shows the CO2 emission of the whole construction building materials with three wall types. As we expected, the first wall has minimum CO2 emissions because of its lower weight and volume.
Operating energy
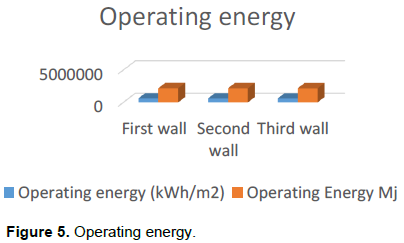
The operating energy provides comfort to the occupants of the building. The mechanical system consumes a huge amount of fuel to cool, heat and ventilate the space. Besides, appliances, miscellaneous, catering, and lighting consume lots of electricity (Turkish Standard Regulation on the Energy Performance of Buildings, 2008). Operating energy at functions like homes depend on the user's consumption while there is a central controlling system at spaces like an office that do not let occupants interpret it. During the calculation of operating energy with DesignBuilder, some factors like window U-value, schedule of appliances and occupancy, lighting and office equipment are a constant amount. According to Table 1, U values are close to each other; although, according to the DesignBuilder simulation results, the total energy consumption for all three wall types is close to 323 kWh/m2. Wall type 1 consumes a little bit more energy than other walls, and this is because of lack of insulation material. Figure 5 shows the distribution of operating energy of an office building in kWh/m2 and MJ.
Evaluating LCA for office building
Different case studies with a different function and climate represent a linear relation between operating energy and total life cycle (Sartori and Hestnes, 2007). Very hot or very cold climates require more energy consumption by the mechanical system to provide a standard condition for living. The importance of operating energy at hot and cold climates are evident while in mild climates, the embodied energy value in life cycle analysis is high. First triple line at Figure 6 represents the sum of CO2 emission during the transportation, embodied energy and embodied carbon for the building with three types of wall. Energy consumption by the occupants is added each five years to the first triple line and continued until the end of 50 years usage span. Figure 6 represent the total energy consumption of the building each five years.
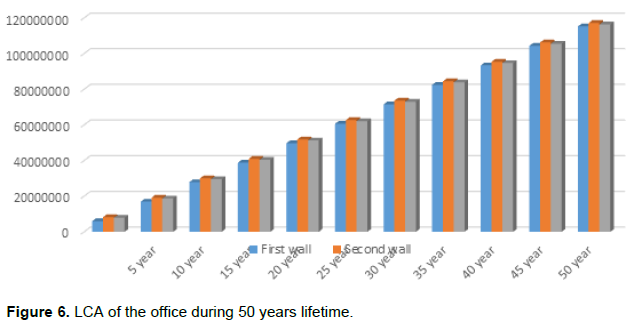
Building with wall type two, consumes the maximum energy from cradle to gate and building with wall type one consumes minimum energy through the cradle to gate. Wall type one with higher U value consumes more operating energy compared with the other wall types, so during 50 years usage phase building with aerated concrete gets closer to the cast concrete buildings.
Huge amount of raw materials is being used in building industry. Choosing materials with high embodied energy by architectures not only increase the cradle to gate energy but also it increases cradle to grave energy (Bribian et al., 2011). Factors such as density, thickness, quantity, embodied energy and embodied carbon are major factors that affect the LCA, so considering them at the beginning will help to reduce the total energy of the building.
To reduce the life cycle energy of buildings, one of the important factors is greenhouse gas emission. One ton of CO2 in the first year is equal to one ton of CO2 in the year 50; while the value of CO2 in the first year is not equal to the 50th year because of the cumulated effect. As the rate of global warming in the world is increasing significantly, the life cycle energy of the buildings should be an important factor to reduce greenhouse gas emission of the country. Therefore, considering the embodied carbon of materials and transporting them can help countries to reach their target. CO2 emission during construction and before that for wall type one, two and three are 72, 59 and 60% which means the CO2 emission of all buildings is more than their embodied energy. Moreover, before using phase; CO2 emission during constructing the building type one is almost 65% less than the others, so considering building materials from different aspects can help countries to reach their target.
Wall type two with higher embodied energy, embodied CO2, CO2 emission through transportation and low U-value than wall type one is a pioneer in LCA during all 50 years. Comparing wall type two and three at each triple shows that the wall type 2 have more embodied energy and embodied carbon than wall type three while U value of wall three is less than wall type two. After ten years, LCA for all wall types becomes a bit closer, and after 15 years a little bit more and they become closer and closer, but during the 50-year lifespan of the building, they never become the same. Therefore, From Figures 2, 3, 4, 5 and 6 we can conclude that through all stage of building life cycle in cities like Tehran with semiarid climate erecting office buildings with two layers of aerated concrete with a layer of air between them is preferable to a wall with cast concrete and five centimeter of EPS or Rockwool insulation even under the conditions that the cast concrete wall has 0.1 W/m2K higher U value. Moreover, the aerated concrete wall has much less impact on the environment because it does not have any insulation material, so because of its less volume, it will need less transportation and subsequently less CO2 emission.
Energy consumption of the building with wall type one, two and three are 6021828, 8276514 and 7857088 MJ before occupants entering the building. Each of these buildings consumes 5983, 5963 and 5944 MJ per day. According to these numbers, if the total embodied energy is divided into daily energy consumption, the results will show that embodied energy of each building is equal to 1006 days for the first wall type and 1387 and 1321 days consecutively for the second and the third building. The second and third wall type consume almost a year more operating energy than the first building. It means if we erect the building with two layers of aerated concrete and the air layer between them, as a result, the building will have the chance to prepare comfort for the occupants for free almost for a year.
As bibliometric analysis represents, subtopics such as energy, materials, environmental impacts and sustainable development will be prominent directions of future building LCA research (Geng et al., 2017). Use phase of the life cycle not only contribute maximum energy consumption but also it contribute to most environmental impact categories (Azari, 2014). CO2 emission is not considered during this study but it should be a good idea for future studies.
In many industries such as building, there is a growing desire to reduce the energy consumption, CO2 emissions, and other environmental impacts associated with all aspects of production and operation (Ooteghem and Xu. 2012).
LCA for each building is necessary because the results of LCA will help to bring some solutions for the efficiency of the building. As an example, results of a study in central part of London focus on the envelope, structure and operational systems (Azzouz et al., 2017). Another LCA study in Tianjin represents that operational stage not only consumes more energy but also contribute more CO2 emissions (Ma et al., 2017).
One of the priorities of doing LCA for each building is understanding the amount of consumption at different stages and trying to minimize it. At this building, the main cause of energy consumption is operating energy. Total operating energy for all buildings during 50 years lifetime is more than 90%. At semiarid regions, the embodied energy percentage is low because of the high energy consumption during the use phase. Embodied energy for the first wall type is 5.2%, for the second and the third wall is 7.1 and 6.7%. Evaluating the life span of different wall types with different sections and materials will help architects to decide confidently about the building environmental performance and decide which material is appropriate for the projects.