Full Length Research Paper

ABSTRACT
Arch dams are of great importance in the world. In Turkey, there are 1200 existing dams with different types. Arch dams are important due to their economic resource in irrigation and water supply which are significant to the homeland security and the agricultural economy. Researchers have been carrying out various studies on dams and their seismic resistance especially after the earthquakes that occurred in the recent years. Turkey is also located at one of the earthquake-active zones. In 1999, devastating earthquakes hit Turkey causing severe property losses and thousands of lives. Excessive ground deformation caused severe crack to the existing buildings. Therefore, it is important to investigate the seismic safety of the existing dams in Turkey. In this study, probabilistic seismic risk assessment has been carried out for arch dams: Gökçekaya, Oymapinar, Karakaya, Gezende, Sir, Berke, Deriner, Ermenek Dams. For these arch dams, structural resistances have been discussed. In addition, their resistances have been determined through time history analysis with 60 different ground motion data. After time history analyses, fragility analyses for arch dams have been carried out. The fragility analysis has been used to determine probability of exceedance. Via fragility analyses, level of risk and probability of exceedance have been determined. The exceedance probabilities of the yield and collapse limit states for arch dams in Turkey have been obtained for a realistic probabilistic determination. According to the results, the role of probabilistic seismic risk assessment in dam safety decisions is addressed in detail.
Key words: Arch dams, probabilistic seismic assessment, structural assessment, time history analysis, fragility analysis.
INTRODUCTION
Arch dams are of great importance in Turkey and also in the world due to their economic values in irrigation and water supply which are critical for the homeland security and the agricultural economy. Numerous researches have been conducted on dams and their seismic resistance especially after the earthquakes occurrences of the recent years. It became more important after the earthquakes in 1964 in Alaska and 1971 in San Fernando.
There are various valuable research works available in the literature. The dissemination of risk analysis procedures in dam engineering and the interest of scientific community began in the 1990s, even if the first risk analyses were conducted in the 1970s (Pimenta, 2013). Leclerc et al. (2003) conducted the static and seismic analysis of different load conditions using various fracture criteria and uplifting pressures of dams. Zhang et al. (2001) carried out the static and stability analyses of dams using rigid-spring element method and found static and dynamic factor of safety of dam slopes. The other important research works on structural assessment of existing dams are done by Turkman (1991), Yu et al. (2005), Calayir and Karaton (2005), Javanmardi et al. (2005), Uddin (1999), Espander and Lotfi (2003), Azmi and Paultre (2002), and Ahmadi et al. (2001). In these research works, structural behavior of existing dams ın different places were investigated through nonlinear analysis and the results were documented.
In the present research, seismic analysis of arch dams was carried out through finite element analysis on the created structural models. Structural models for existing dams which provide expression of earthquake behavior of dams were created using finite element modeling and the parameters were determined to represent random characteristics. It can be said that accuracy of structural modeling is very critical for accuracy in the analyses.
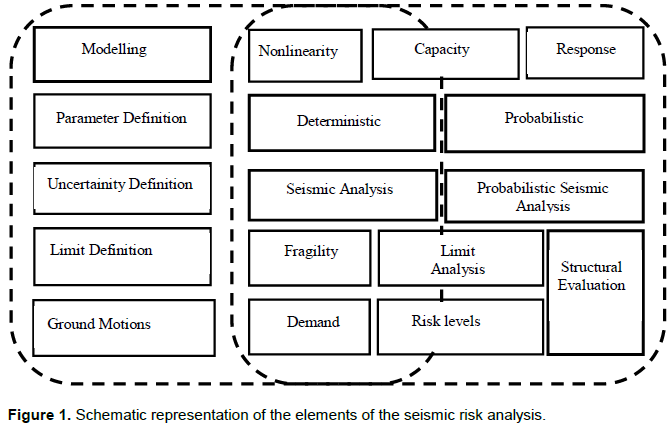
Probabilistic approach is also associated with testability of model information. Probabilistic seismic evaluation methods cover the approaches which are based on the expression as probability of the behavior of existing structures and that are widely used today. The risk in the analysis of structural systems is the probability of occurrence of an event which is undesirable. Generally, the structural reliability is based on the possibility of collapse of the structure and is also referred to as breaking performance of the structures in the analysis (Korkmaz, 2005). The application of deterministic approaches, excluding probabilistic seismic analysis may be insufficient in the expression of the seismic structural behavior. The uncertainty and lack depend on the different reasons in the numerical expressions such as capacity and response in the analysis. Due to such uncertainties which cannot be expressed probabilistically, it is not possible to conclude that the results of deterministic methods are valid for every case. Limited information affects the results, hence, sensitivity analysis can be carried out as a part of probabilistic approach. In Figure 1, risk analysis steps used in seismic risk analysis were given as detailed. The probabilistic seismic analysis is expressed as the inclusion to the structural analysis of the concept of the limit state exceedance probability accepted for fracture cases. Fragility analysis is the expression of the vulnerability of the structure (Castaldo et al., 2015, 2016 a, b, 2017 a, b).
Fragility analysis used in analyzing the building structures is also used in the determination of damage of the dam structures. As a result of the analysis performed with the chosen design parameters, the parameters effecting the structural behavior are obtained. The behavior parameters obtained in the results analysis would become a function of the design parameters. On the other hand, in the determination of non-specific behavioral parameters, it may be necessary to implement the probabilistic seismic damage models and probabilistic analysis methods. Therefore, considered criteria should be evaluated in each step to determine the effectiveness on the analysis. This step is called the evaluation step.
The concept of probability goes back to 1940s which was used first time in the determination of seismic safety (Marek, 2003). In recent years, probabilistic seismic analysis methods have shown significant improvements. User loads, external influences and the uncertainties in material properties has required the use of the probabilistic approach in the seismic analysis.
Using probabilistic analysis was based on the concepts of uncertainty and randomness. To complete these analyses correctly, the data used in the analysis are important for the accuracy of the analysis. Defining concept of probability is neccessary to provide risk assesment analysis. Therefore, in the analyses, risk and exceedance probabilities are obtained. When performing analysis, the concepts of seismic damage curves, limit states of the structures and risk levels are given. The probability analysis is of great importance in terms of the determination of the acceptable risk level.
SEISMIC SETTING
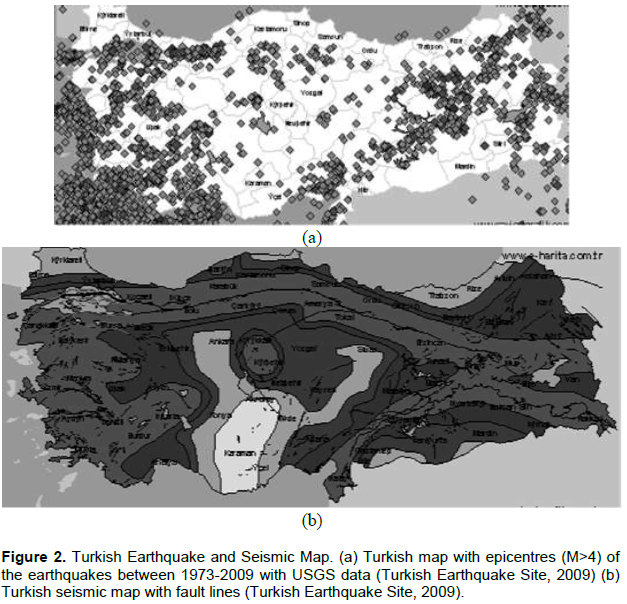
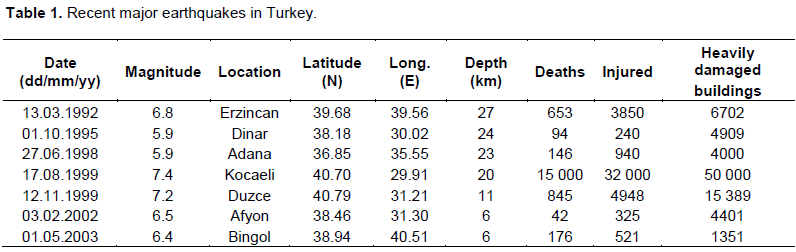
Earthquakes hit Turkey very often, causing serious damage to exisiting buildings and led to a significant life and economic loss. In 1999, two major earthquakes hit the northwestern region of Turkey and damaged or destroyed many buildings. The seismic activity of the country might be best explained by illustrating the epicenters and magnitudes of the earthquakes (M>4) that have occurred in Turkey through history as in Figure 2a. In Figure 2a, it is clearly seen that, northwestern and western Turkey are areas of significant seismic activity. In Figure 2b, Turkish seismic map with fault lines is shown (Turkish Earthquake Site, 2009). Table 1 shows the recent major earthquakes in Turkey (Inel et al., 2008).
Turkey is located in the southeast side of Europe and covers an area of 77.95 million ha. Almost one-third of this area (28 million ha) can be classified as cultivable land. About 8.5 million ha is feasibly irrigable with the use of available and appropriate technology. However, only 2.5 million ha land has been irrigated up until now (Tosun et al., 2007). Water and energy supplies are key factors that affect the economic development and environmental improvement of Turkey. The total number of dams that are constructed in Turkey is 1,200 (Tosun et al., 2007). In Turkey, high magnitude earthquakes that potentially cause hazards on dams occur frequently. High magnitude earthquakes can cause: deep cracks along or perpendicular to the crest, deterioration of the rip-rap or sealing system and displacement or settlement of the crest. Therefore, it is necessary to determine the displacements and stresses that occur during the construction of dams. Displacements and stresses vary depending on the material properties and earthquake’s features.
SEISMIC ANALYSIS AND DESIGN ASPECTS OF EXISTING DAMS
Assessment of the impact of earthquake on existing dams can be challenging, as it requires more sophisticated analysis tools than those used for the usual analyses. Understanding the behavior of a dam is also a challenging task as the behavior is shaped by the complex interaction between various components of the dam (Yalin, 2013). Over the decades, significant developments have been accomplished in understanding the dynamic response of dams (Espander and Lotfi, 2003; Azmi and Paultre, 2002). Significant progress has been attained in the linear-elastic dynamic analysis of the existing dams and the equivalent linear method has been developed for earthfill/rockfill dams, which has been widely used for practical applications. Accuracy of nonlinear dynamic analysis of the existing dams is related with defining joint behavior and cracking in the anlaysis. These definitions directly affects the structural modeling and analysis. For instance, time history analyses are one of the important analyses tools to understand the structural behavior. Through the existing research works, significant progress has been achieved in understanding the dynamic characteristics of dams (Espander and Lotfi, 2003; Azmi and Paultre, 2002; Ahmadi et al., 2001).
The International Commission on Large Dams (ICOLD) and FEMA committees has prepared number of guidelines on various aspects of seismic analysis, design and seismic monitoring of the existing dams. These guidelines are considered as seismic codes in the countries which do not have any specific codes or regulations for dams (ICOLD, 1989; FEMA, 2005).
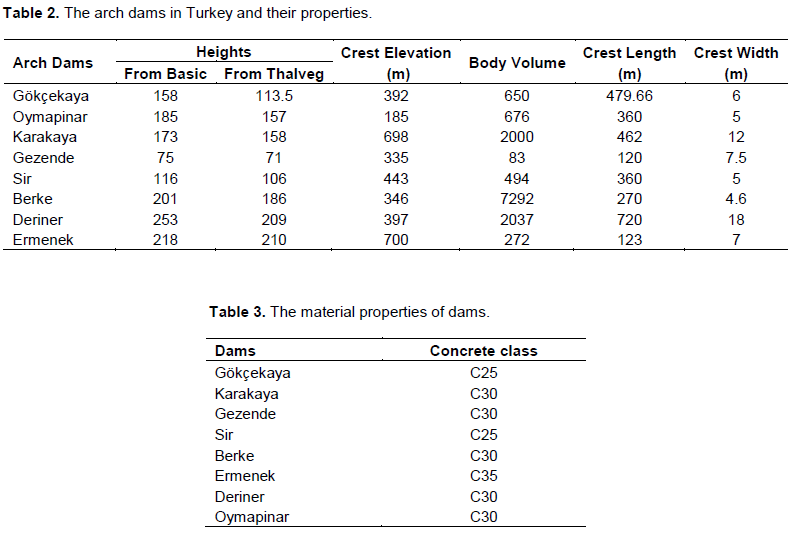
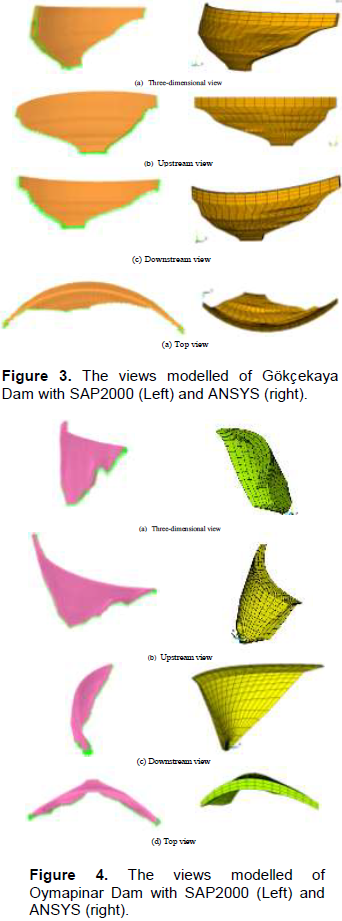
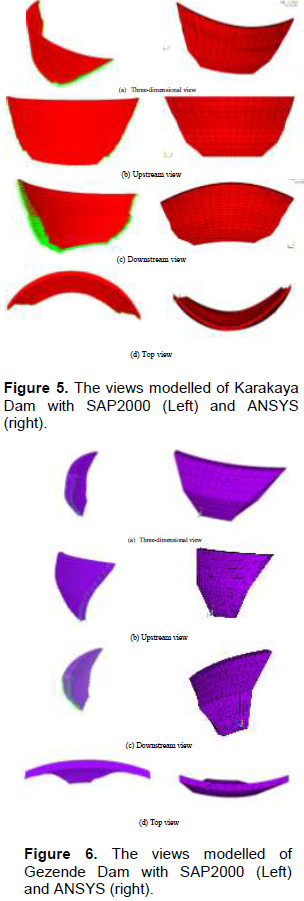
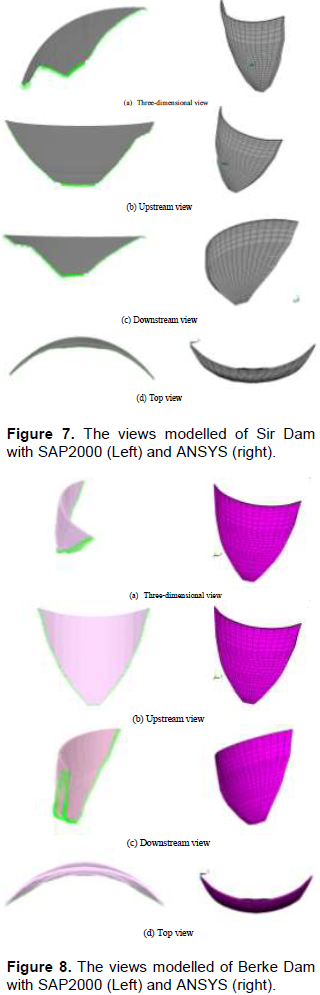
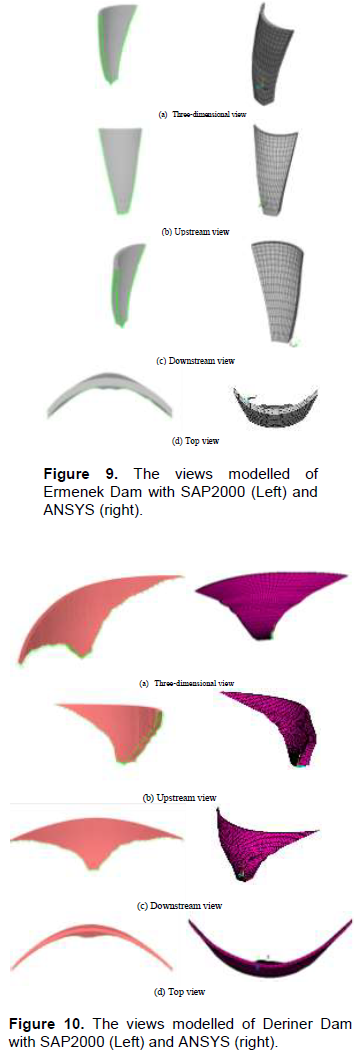
In this study, the earthquake safety of existing arch dams in Turkey were examined. Investigated arch dams are Gökçekaya, Oymapinar, Karakaya, Gezende, Sir, Berke, Deriner, Ermenek Dams. The arch dams and their properties was presented in Table 2 (DumanoÄŸlu and Akköse, 2003). The material properties of the arch dams in Turkey are presented in Table 3. Gökçekaya Dam is located in EskiÅŸehir, Oymapinar Dam is located in Antalya, Karakaya Dam is located in Diyarbakir, Gezende Dam is located in Mersin, Sir Dam is located in KahramanmaraÅŸ, Berke Dam is located in Osmaniye, Deriner Dam is located in Artvin, and Ermenek Dam is located in Karaman in Turkey.
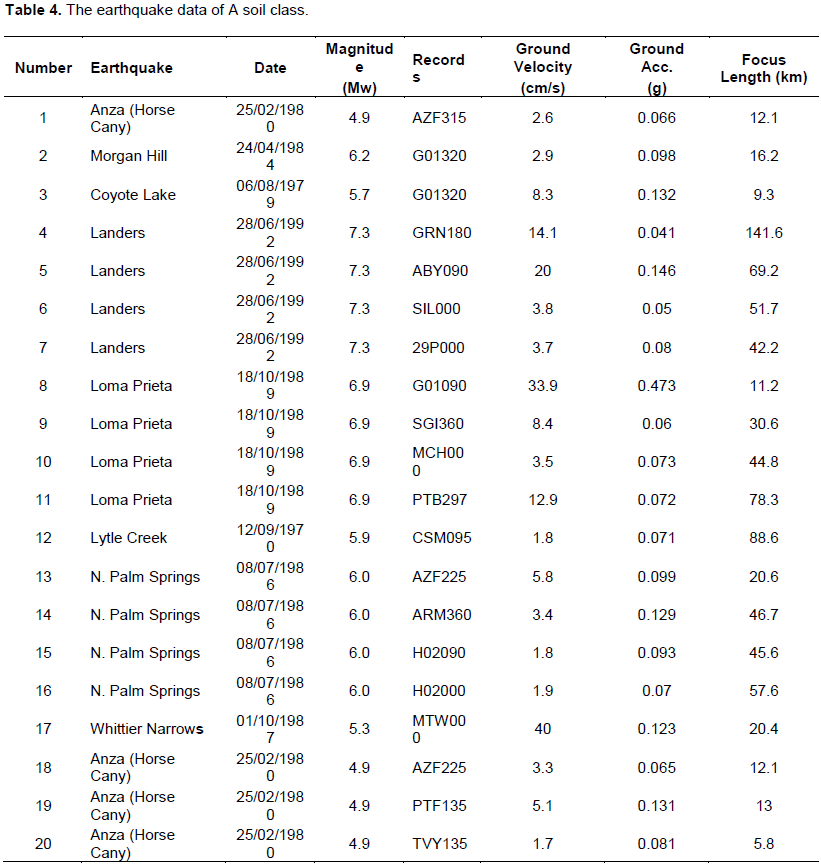
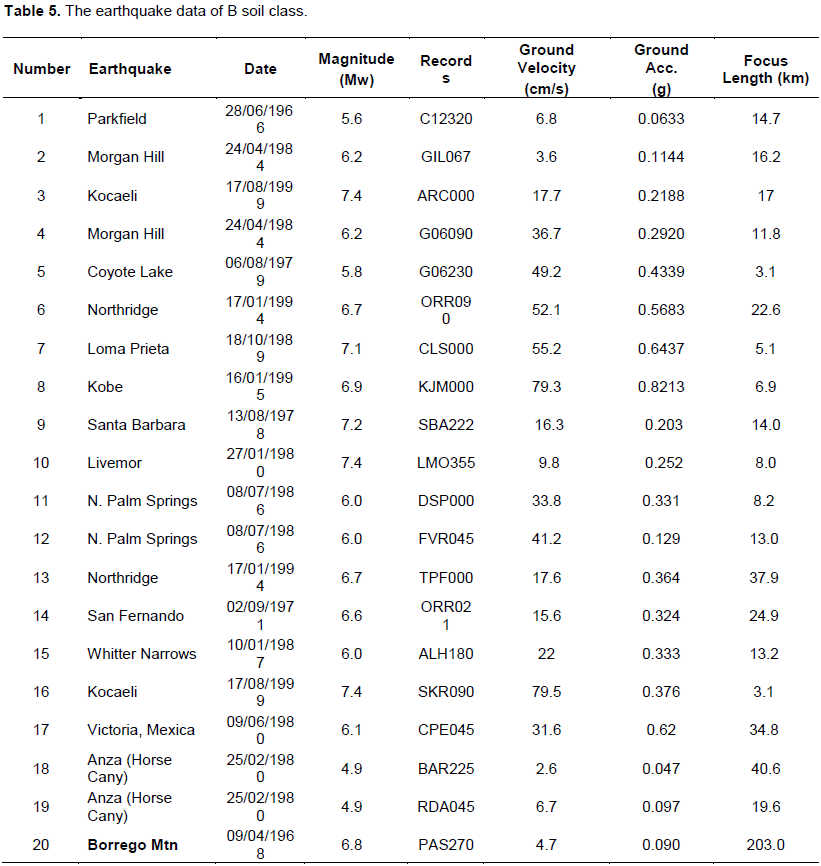
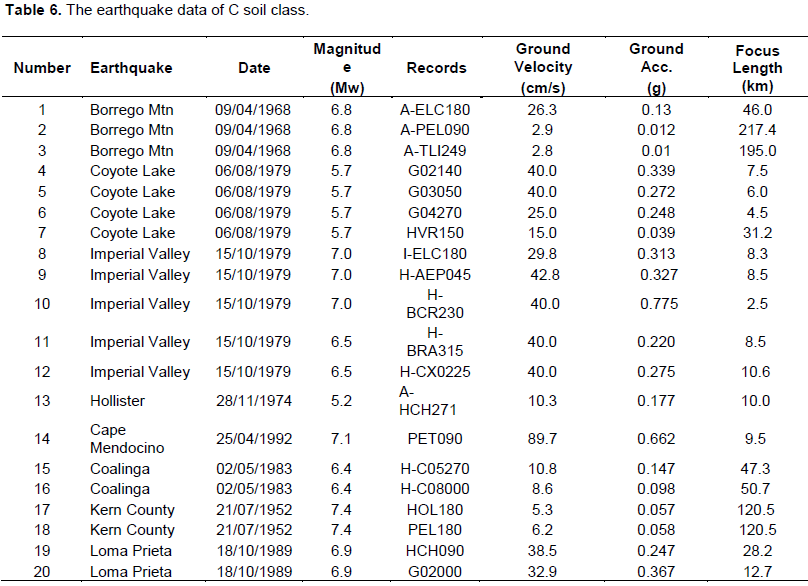
Dynamic analysis was carried out for selected arch dams. The dynamic equilibrium equations were integrated by using the step by step numerical processing. Direct integration is to make step by step processing without transforming to a different form of the equations (Bathe, 1996). The dynamic analysis were made by applying 60 earthquake acceleration records of A, B and C soil classes. The properties of earthquakes are presented in Tables 4 to 6. Seismic probability analysis were made by using the values obtained. The mass adding approach of Westergard was used at hydrodynamic pressure estimation (Westergard, 1933). According to the Westergard approach, the liquid impact was calculated by the following equations.
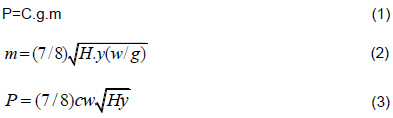
P: hydrodynamic pressure, m: mass of liquid, C: the rate of earthquake acceleration to gravity acceleration, W: the density of liquid, H: the depth of water, Y: the distance of the water depth to crest level.
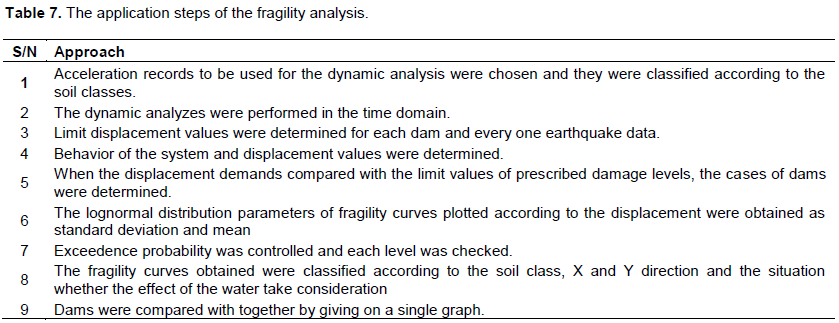
Dams were modelled via SAP 2000 V14. The modelled dams are presented between Figure 3 and 10. 60 earthquake acceleration records of A, B and C soil classes have been considered. In the scope of the study, the steps for each dam model were taken into consideration as vulnerability expression as given in Table 7.
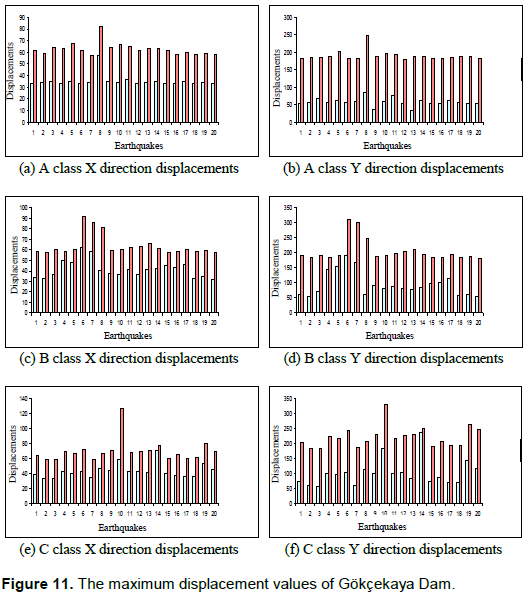
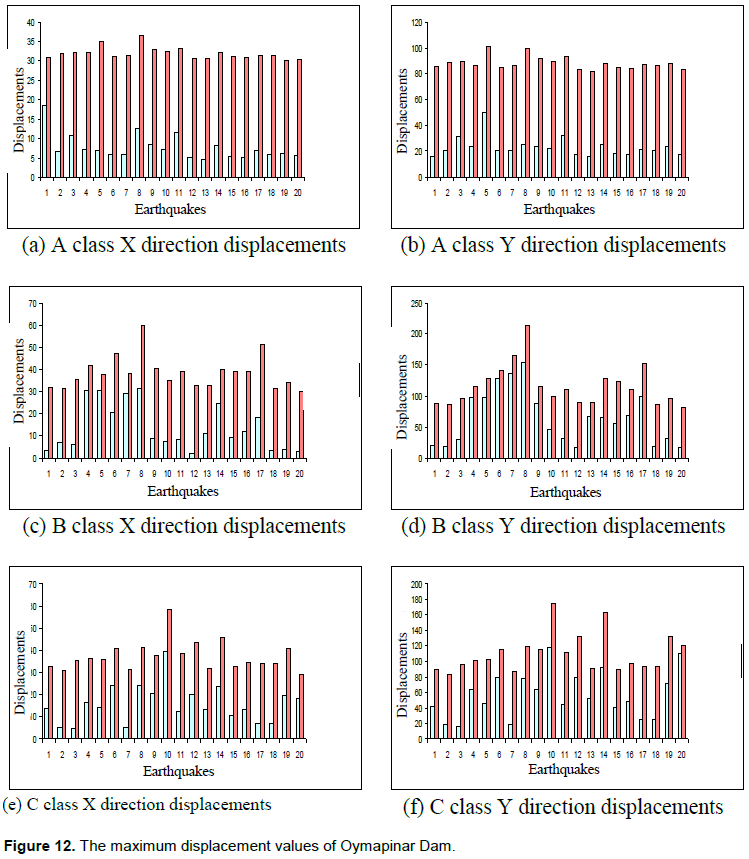
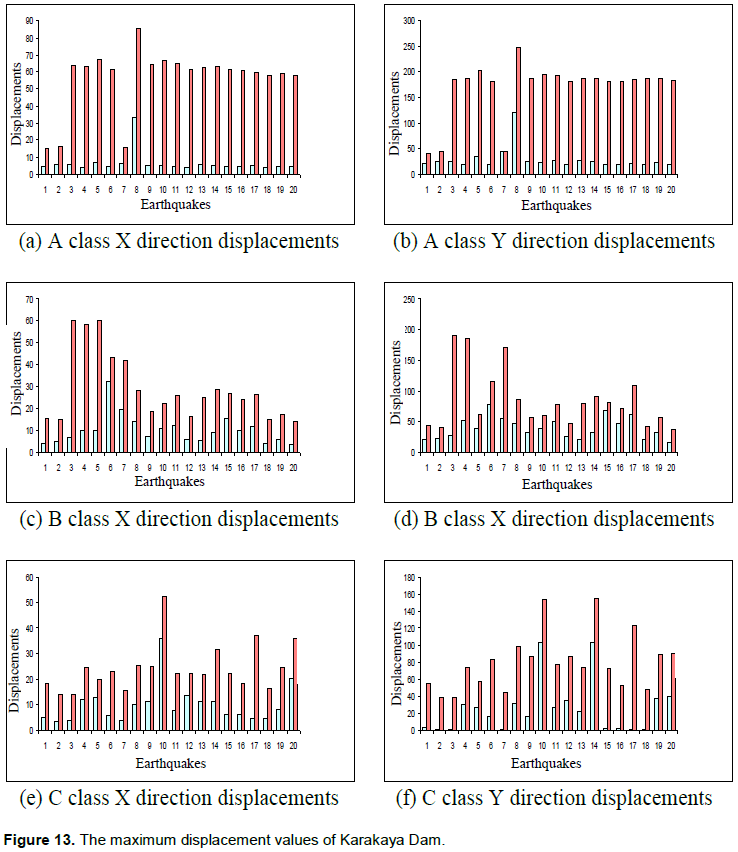
Performance assessment of existing dam structures using ground motion data from A, B and C soil classes for Gökçekaya Dam, Oymapinar Dam, Karakaya Dam, Gezende Dam, Sir Dam, Berke Dam, Deriner Dam, and Ermenek Dam, along with displacement values in X and Y directions are presented in Figures 11 to 18 respectively. As seen in Figure 11, the maximum displacement value in X direction in A soil class, Gökçekaya Dam was obtained in Loma Prieta earthquake data with number 8. The displacements values occurred as a result of the analyses performed by Loma Prieta earthquake record, viz; maximum 81.6 mm with full case and 56.9 mm with empty case. The magnitude of Loma Prieta earthquake is 6.9 and Loma Prieta earthquake has the most effective ground acceleration in A soil class. The displacements obtained by using Landers earthquake magnitude (8.3) were smaller values than those obtained by using Loma Prieta earthquake. The focal length of Loma Prieta earthquake is 11.2 km and it is the earthquake having the smallest depth in A soil class. In the results, it was obtained by using number 20 and 1 earthquake gives 32.9 mm and 33 mm displacements, respectively. The magnitude of Anza earthquake number 20 is the smallest value in A soil class. The displacement values close to each other in the empty and full case at X direction were obtained due to the act of water effects on the Y direction. While the biggest displacement value in full case at the Y direction was obtained as 247.6 mm, it was obtained as 85.4 mm in empty case with Loma Prieta earthquake record number 8. This situation, the of effect ground acceleration value of Loma Prieatra for earthquake number 8, is said to be more than the other earthquakes. The smallest displacement value in empty case was obtained as 33.9 mm with N. Palm Springs earthquake record number 13, and was obtained as 181.2 mm with Lytle Creek Earthquake number 12 in full case.
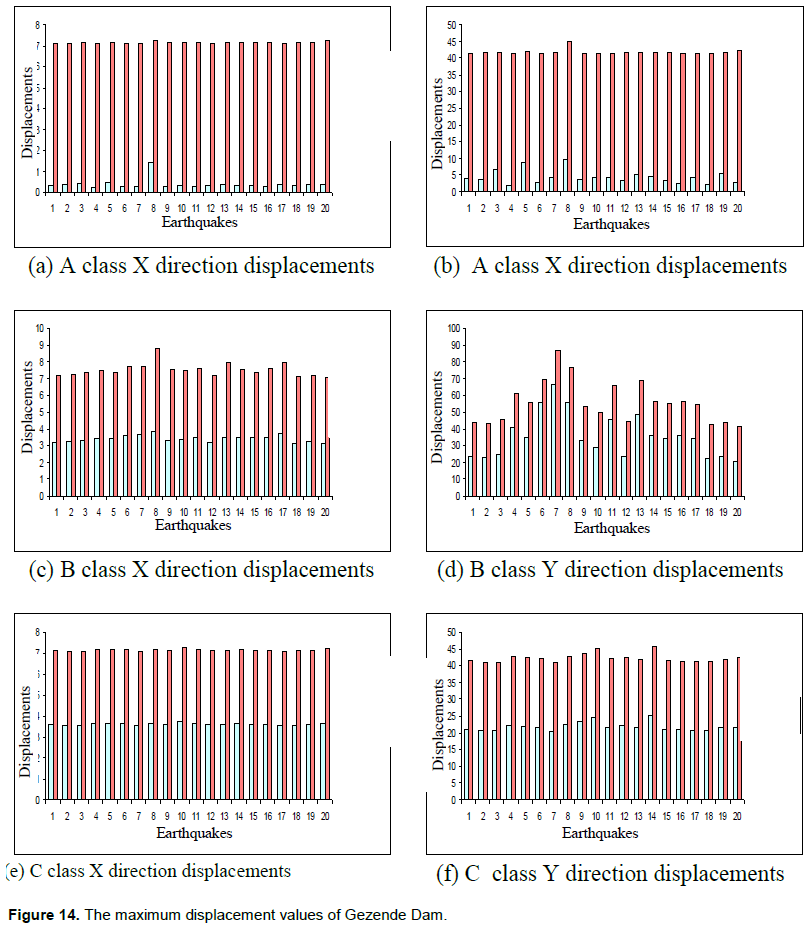
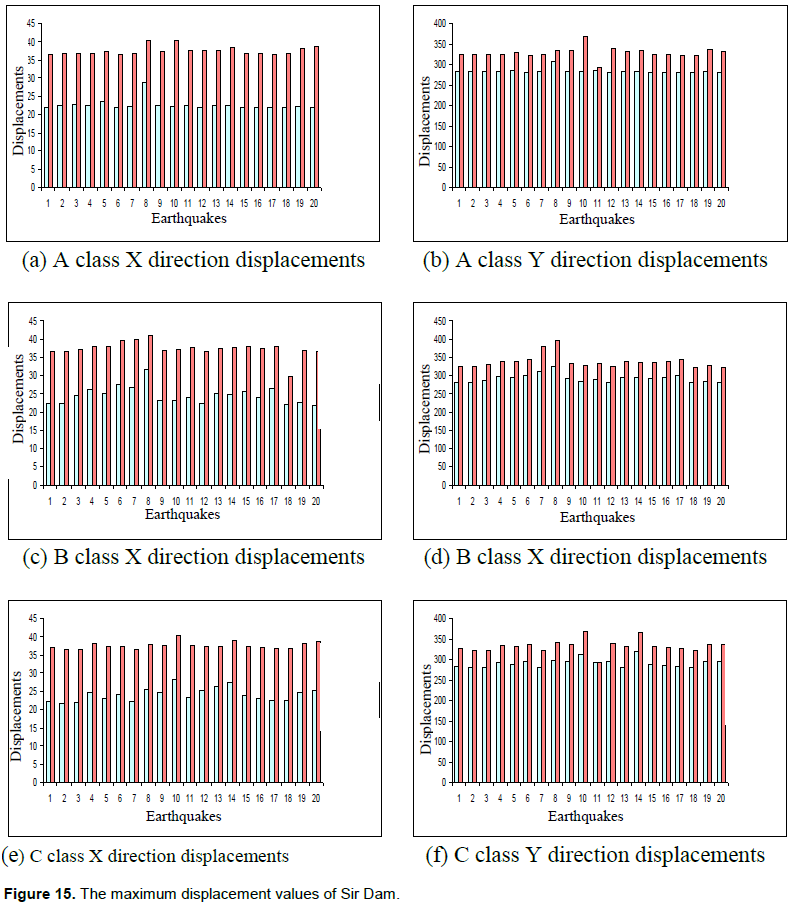
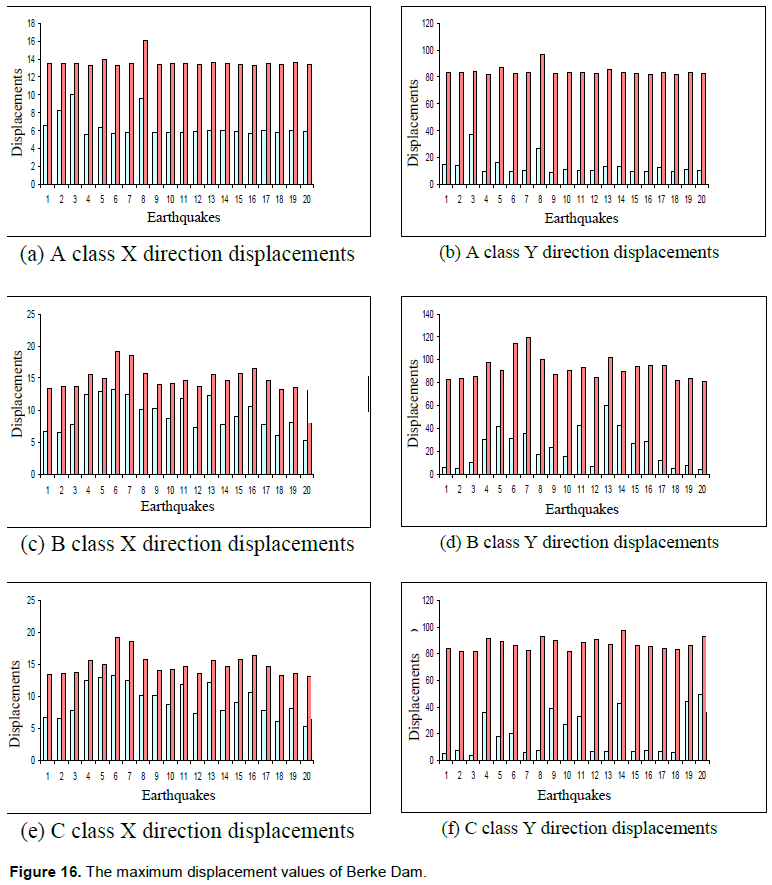
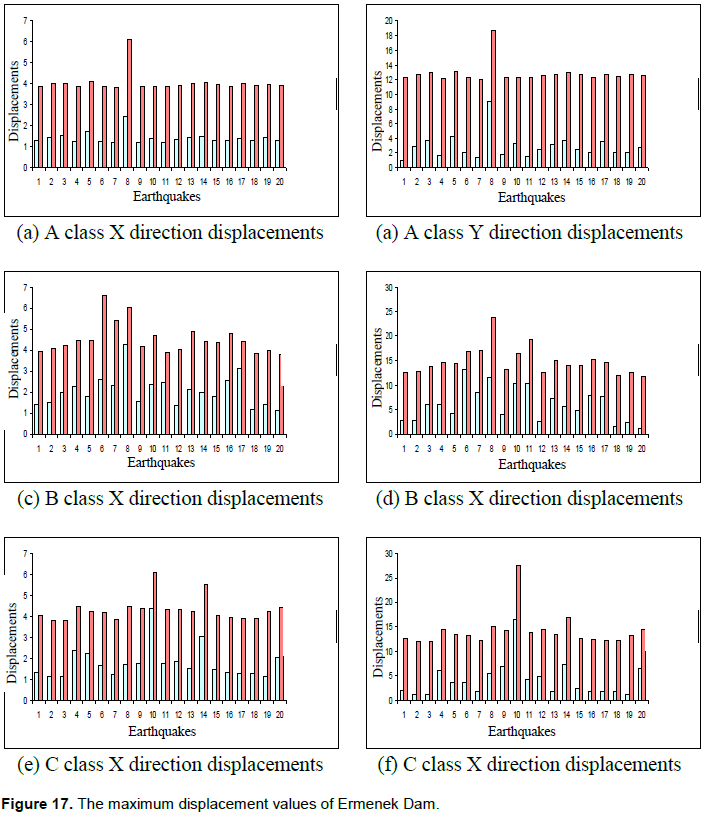
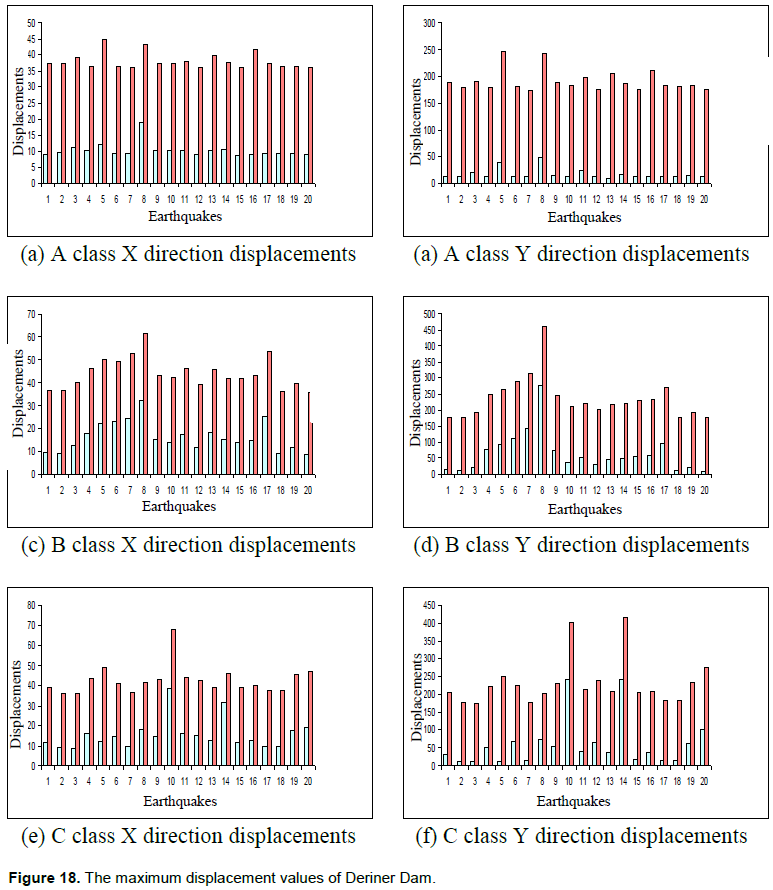
For B soil class, the biggest displacement values at X direction were obtained as 62.2 mm with Nortridge data in empty case, while 91.4 mm in the full case. The effect of ground acceleration and focus depth of Northridge earthquake number 6 is the biggest value of B soil class. The biggest displacement at Y direction was obtained with earthquake number 6 with 190.4 mm for empty case and 311.7 mm for full case. The smallest displacement was obtained as 53.5 mm for empty case and 182.9 mm for full case, using earthquake record number 20. These earthquakes were used to obtain the biggest and smallest displacement values at X and Y direction.
In the C soil class, the biggest displacement value at X direction was determined as 126.1 mm for full case with earthquake number 14. The smallest displacement value was recorded as 32.7 mm for empty case and 57.5 mm for full case by using earthquake data number 14. The smallest displacement value was recorded as 183.2 mm for full case by using earthquake data number 14. The maximum displacement values at X and Y direction were obtained with Cape Mendocino Earthquake with magnitude 7.1.
FRAGILITY ANALYSIS
Fragility analyses were previously used to determine seismic performance of various structures such as nuclear structures (Gergly, 1984) and have been more recently used in the seismic analysis of other structures (Mosalam et al., 1997). This analyses expresses probability to define the damage risk of existing buildings.
Also, fragility is the propability expression of the vulnerability of structures. Ä°t is difficult to predict the structural performance or damage of future eartquakes since their magnitudes and impacts are unknown. To express the seismic risk for a structure and the probability response against the seismic ground motion are quite important uncertainties in the fragility analysis. Fragility analysis generally can be grouped under three main headings which are uncertainties in modeling of the structure, the uncertainty due to ground motion and uncertainties in limiting threshold of structure. Fragility curve, which is a function of the earthquake data parameters, is used to assess the probabilistic nature of the structure due to seismic loading. To forecast structural behavior in future earthquakes, it is necessary to define existing behavior using past earthquake data.
Currently, fragility analysis methods, in FEMA-HAZUS regulations, are given depending on the fragility and the structural response spectra (FEMA, 1999; Dutta and Mander, 1998). In these methods, the probability of exceedance Pf and the distribution of spectral values were adopted in the form of logarithmic normal distribution. Fragility curves can be expressed for an entire structure or single structural component. These curves may be generated using the numerical analysis or experimental results. Fragility analysis is performed in
four steps in the form of the identification of grount motion data, definition of ground motion, identification of structural damage and evaluation of the results. The exceedance probability on the y axis, the PGA, PGV or PGD in the x axis is given as one of the spectral acceleration values​​.
Ä°n the study by Hwang and Jaw (1988), fragility analysis was given in detail while Petrovski and Nocevs (1993) obtained fragility curves of structures which they addresed in their study. Ä°n previous studies, damage probability matrices were developed and they used the value of the rate of the relative story drift as damage parameter in fragility curves (Singhal, 1996; Erberik and Elnasha, 2004); and the value of Sd accepted, confirming a lognormal distribution for fragility curves, was used. Karimi and Bakhshi (2006) proposed fragility curves for masonry structures, using Cumulative Absolute Velocity (CAV) as ground motion parameters. Park-Ang model (1985) was used as damage parameter in their study. Rubinstein (1989) in consideration of the uncertainties in the structural parameters used Monte Carlo simulation technique. Karim and Yamazaki (2003) choose Park-Ang model as damage parameter studies in which they proposed the fragility curve for bridges, using the dynamic analysis beyond linear PGA and PGV values and adopted the Lognormal distrubition as ground motion parameter; while in a later study they considered PGA, PGV and SI as ground motion parameter in their study (Karim and Yamazki, 2003). Their expression was simplified in terms of structural features, using the linear regression as the parameters for lognormal distribution. Shinozuka et al. (2000a) used section ductility demand as damage parameter which was derived of the fragility curves with time history and static analysis approach, using two different analytical approach for the bridges. In another study, the authors adopted PGA values as a part of lognormal distribution, which was used as ground motion parameter. Lognormal distribution parameters were determined by the maximum likelihood method. In the study, results were evaluated as a statistical analysis to sketch empirical and analytical fragility curves for bridges, and the ductility demand was used as damage parameter (Shinozuka et al., 2000b). Kim and Shinozuka (2004) used PGA parameter as lognormal distribution of ground motion parameters. In the study, they evaluated the effect of reinforcement in the bridge columns. Tsopelas and Pekcan (1999) performed a research on the reinforcement and suggested an improvement, using seismic fragility curves and performance methods. They focused on the modeling with the fragility analysis of the structural behavior. In their method, structural behavior is directly applied on a structure. All these studies can be used as a part of determining the probabilistic structural behavior.
PROBABILISTÄ°C SEISMIC ASSESSMENT OF ARCH DAMS
Various research works evaluated dams and the probabilities were performed using fragility analysis, which relates to evaluating the probabilistic seismic behavior of dams. Among them, Chopra and Gregory (1987) discussed the fragility analysis of dams. In the study performed by Ellingwood and Teike (2001), detailed information about the fragility analysis of dams was given and the fragility analysis of the concrete gravity dams was expressed in the study’s scope. Another significant study carried out was by Papadrakakis et al. (2008). They described a new approach to increase the accuracy of probabilistic demand definition in seismic areas.
In the present study, probabilistic seismic analysis of arch dams was performed using fragility analysis. The scope of the study covers fragility analyses carried out and probabilistic seismic behavior of arch dams as a result of the analysis. Fragility was expressed with a conditional probability expression in form of the probability of exceedance:

Here, R: the structural response calculated at the result of analysis; r: the damage level predicted for the minimum value of the structural response; I: ground motion parameter used as the random variable for the purpose of calculating the damage limit state of the structural response. The data used for the fragility curves were obtained from past earthquakes, results of experiments, results of analysis or engineering experiences.
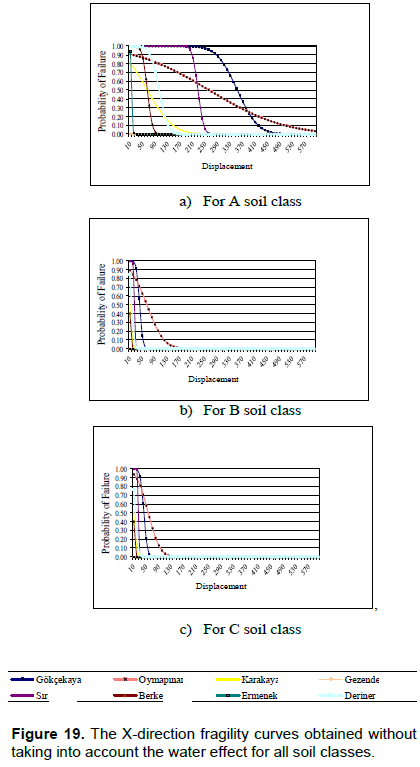
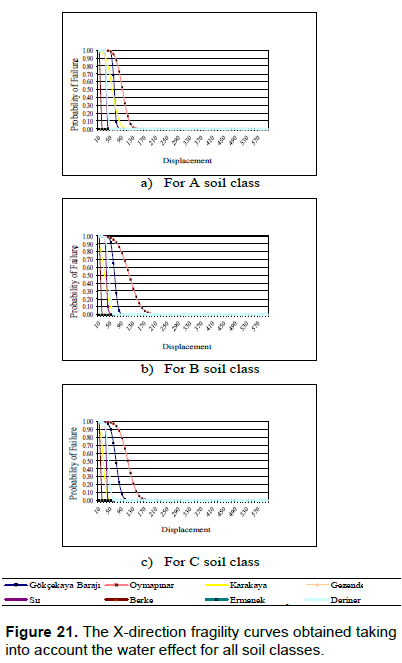
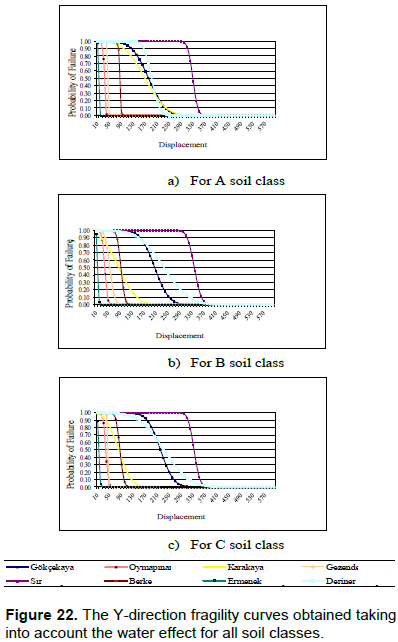
The graphs for A, B and C soil classes in the empty and full cases of dams were obtained. The fragility curves obtained for all soil classes in Figure 19 and Figure 20 were presented for X and Y directions respectively, without considering the water effect. The fragility curves obtained for all soil classes in Figures 21 and 22 were presented for X and Y directions respectively, with consideration for the water effect. It was seen that the yield and collapse limit state as well as exceedance probabilities have increased in this order: Ermenek, Oymapinar, Gezende, Karakaya, Berke, Deriner, Gökçekaya and Sir Dams for empty and full cases. This order can be seen in the Fragility curves in Figures 19 to 22.

CONCLUSION
The results of the dynamic analysis were used in the propabilistic seismic evaluation researches performed within this scope of study. Exceedance probability of displacement values were determined using the dynamic analysis, and the fragility curves were plotted. The graphs were created under this section with these values, by obtaining exceedance probabilities against each displacement value in the fragility curves plotted. All dams can be seen on a graph using this approach. In the result of this study performed, sepeate graphs were obtained for A, B and C soil classes. The fragility curves were obtained by considering the effect of water and were also obtained for all soil classes as presented respectively for X and Y directions without taking into account the effect of water. When the graphs were examined, It was seen that the yield and limit state exceedance probabilities increased in this order: Ermenek, Oymapinar, Gezende, Karakaya, Berke, Deriner, Gökçekaya and Sir Dams for empty and full cases. This order can be seen in the Fragility curves in Figures 19 to 22.
CONFLICT OF INTERESTS
The authors have not declared any conflict of interests.
REFERENCES
|
Ahmadi MT, Izadinia M, Bachmann H (2001). A Discrete crack joint model for nonlinear dynamic analysis of concrete arch dams. Computers and Structures 79(4):403-420. |
|
|
Azmi M, Paultre P (2002). Three-dimensional analysis of concrete dams including contraction joint non-linearity. Engineering Structures 24(6):757-771. |
|
|
Bathe KJ (1996). Finite Element Procedures in Engineering Analysis, Prentice-Hall, Englewood Cliffs, New Jersey. |
|
|
Calayir Y, Karaton M (2005). A Continuum damage concrete model for earthquake analysis of concrete gravity dam-reservoir system. Soil Figure 22. The Y-direction fragility curves obtained taking into account the water effect for all soil classes. |
|
|
Dynamics And Earthquake Engineering 25(11):857-869. |
|
|
Castaldo P, Palazzo B, Della Vecchia P (2015). Seismic reliability of base-isolated structures with friction pendulum bearings. Engineering Structures 95:80-93. |
|
|
Castaldo P, Palazzo B, Della Vecchia P (2016a). Life cycle-cost and seismic reliability analysis of 3D systems equipped with FPS for different isolation. Engineering Structures 125:349-363. |
|
|
Castaldo P, Palazzo B, Ferrentino T, Petrone G (2016b). Influence of the strength reduction factor on the seismic reliability of structures with FPS considering intermediate PGA/PGV ratios", Composites Part B: Engineering 115:308-315. |
|
|
Castaldo P, Amendola G, Palazzo B (2017a). Seismic fragility and reliability of systems isolated by friction pendulum device: Seismic reliability-based Design (SRBD), Earthquake Engineering and Structural Dynamics 46(3):425-446. |
|
|
Castaldo P, Palazzo B, Ferrentino T (2017b). Seismic reliability-based ductility demand evaluation for inelastic base-isolated structures with friction pendulum devices. Earthquake Engineering and Structural Dynamics 46(8):1245-1266. |
|
|
Chopra A, Gregory FK (1987). Simplified Earthquake Analysis of Concrete Gravity Dams. Journal of Structural Engineering 113(8):1688-1708. |
|
|
Dutta A, Mander JB (1998). Seismic Fragility Analysis of Highway Bridges in Center-to-Center Project Workshop on Earthquake Engineering Frontiers in Transportation Systems, International Center for Disaster-Mitigation Engineering (INCEDE), Tokyo, Japonya pp. 311-325, |
|
|
Ellingwood B, Teike PB (2001). Fragility Analysis of Concrete Gravity Dams. Journal of Infrastructure Systems 7(2):41-48. |
|
|
Erberik MA, Elnashai AS (2004). Fragility Analysis of Flat-Slab Structures, Engineering Structures 26(7):937-948. |
|
|
Espander R, Lotfi V (2003). Comparison of non-orthogonal smeared crack and plasticity models for dynamic analysis of concrete arch dams. Computers and Structures 81(14):1461-1474. |
|
|
Federal Emergency Management Agency (FEMA) (2005). Federal Guidelines for Dam Safety. Earthquake, Analyses and Design of Dams. |
|
|
Federal Emergency Management Agency (FEMA) (1999). Federal Emergency Management Agency, HAZUS 99. Estimated Annualized Earthquake Losses for The United States FEMA 366, Washington DC, USA. |
|
|
Gergly P (1984). Seismic Fragility of RC Structures and Components for Appilcation to Nuclear Facilities, Teknik Rapor, Lawence Laborotuarlari, Livemore. (No. UCID--20164). Cornell Univ. |
|
|
Hwang HM, Jaw JW (1988). Seismic Fragility Analysis of Frame Structures, Technical Report, NCEER-88-00009 New York Eyalet Üniversitesi, Buffalo, NY, USA. |
|
|
ICOLD (1989). Selecting parameters for large dams—guidelines and recommendations. ICOLD Committee on Seismic Aspects of Large Dams, Bulletin, vol. 72. |
|
|
Inel M, Ozmen H, Bilgin H (2008). Re-evaluation of building damage during recent earthquakes in Turkey. Engineering Structures 30(2):412-427. |
|
|
Javanmardi F, Leger P, Tinawi R (2005). Seismic structural stability of concrete gravity dams considering transient uplift pressures in cracks. Engineering Structures Engineering Structures 27(4): 616-628. |
|
|
Karim KR, Yamazaki F (2003). A Simplied Method of Constructing Fragility Curves for Highway Bridges, Earthquake Engineering and Structural Dynamics 32:1603-1626. |
|
|
Karimi K, Bakhshi A (2006). Development of Fragility Curves for Unreinforced Masonry Buildings Before and After Upgrading Using Analytical Method, First European Conference on Earthquake Engineering and Seismology, Geneva, Isviçre. |
|
|
Kim SH, Shinozuka M (2004). Development of Fragility Curves of Bridges Retrofitted by Column Jacketing. Probabilistic Engineering Mechanics 19(1-2):105-112. |
|
|
Korkmaz KA (2005). Yapi Sistemlerinin Güvenilirlik Esasli Performansa BaÄŸli Analizi, Doktora Tezi, Dokuz Eylül Üniversitesi Fen Bilimleri Enstitüsü, Izmir, Türkiye. |
|
|
Leclerc M, Leger P, Tinawi R (2003). Computer aided stability analysis of gravity dams (CADAM). Engineering Software 34(7):403-420. |
|
|
Marek P (2003). Probabilistic Assesment of Structures, 2. Basi, TERECO, Prak, Çek Cumhuriyeti. |
|
|
Mosalam KM, White RN, Gergeley P (1997). Static Response of Infilled Frames Using Quasi-Static Experimentation, Journal of Structural Engineering 123(11):1462-1469. |
|
|
Papadrakakis M, Papadopoulos V, Lagaros ND, Oliver J, Huespe AE, Sánchez P (2008). Vulnerability Analysis of Large Concrete Dams Using The Continuum Strong Discontinuity Approach and Neural Networks. Structural Safety 30(3):217-235. |
|
|
Petrovski S, Nocevski NK (1993). Definition of Emprical And Theoritical Models for Assesment of High Rise Buildings, Teknik Rapor, IZIIS Skopje, Makedonya Cumhuriyeti. |
|
|
Pimenta L, Caldeirab L, Neves EM (2013). A new qualitative method for the condition assessment of earth and rockfill dams. Structure and Infrastructure Engineering 9(11):1103-1117. |
|
|
Rubinstein RY (1989). Sensitivity Analysis of Computer Simulation Models via the Score Efficient. Operations Research 37:72-81. |
|
|
Shinozuka M, Feng MQ, Kim HK, Kim SH (2000a). Nonlinear Static Procedure for Fragility Curve Development. Journal of Engineering Mechanics 126(12):1287-1295. |
|
|
Shinozuka M, Feng MQ, Lee J, Naganuma T (2000b). Statistical Analysis of Fragility Curves. Journal of Engineering Mechanics 126(12):1224-1231. |
|
|
Singhal A (1996). A Method for Earthquake Motion Damage Relations with Application to RC Frames, Doktora Tezi, New York Devlet Üniversitesi, NY. |
|
|
Tosun H, Zorluer I, Orhan A, Seyrek E, Savas H, Turkoz M (2007). Seismic hazard and total risk analyses for large dams in Euphrates basin, Turkey. Engineering Geology 89:155-170. |
|
|
Turkman F (1991). Optimization of large scale hydroelectric generating systems, Engineering Optimization 17:237-245. |
|
|
Tsopelas P, Pekcan C (1999). Seismic Fragility and Retrofit of non Ductile RC Structures, Technical Report, New York Devlet Universitesi, Buffalo, NY. |
|
|
Uddin N (1999). A Dynamic analysis procedure for concrete faced rockfill dams subjected to strong seismic excitation. Computers and Structures 72(1-3):409-421. |
|
|
Yu Y, Xie L, Zhang B (2005). Stability of earth-rockfill dams: influence of geometry on the three-dimensional effect. Computers and Geotechnics 32(5):326-339. |
|
|
Westergard HM (1933). Water Pressures on Dams During Earthquakes. Transactions ASCE 98(1835):418-433. |
|
|
Zhang J, He J, Fan J (2001). Static and dynamic stability assessment of slopes or dam foundations using a rigid body-spring element method. International Journal of Rock Mechanics and Mining Sciences 38(8):1081-1090. |
|
Copyright © 2024 Author(s) retain the copyright of this article.
This article is published under the terms of the Creative Commons Attribution License 4.0


