Full Length Research Paper

ABSTRACT
In this work, spalling is naturally initiated on the bearing raceway during its operation on the test bench. The experimental procedure used consists of monitoring the deterioration of the ball bearing until its failure with an online acquisition of vibration signals. Vibration analysis is the method used to characterize the damage. In order to obtain a significant trend curve, spalling surface has been measured several times during the lifetime of the tested bearing. These measurements allowed plotting the fatigue curve which has been found to follow a power law. The root mean square (RMS) indicator has been used to follow the bearing’s degradation using vibration time signals. The RMS trend curve has been established, and its reliability in following the spall growth has been discussed. Finally, the RMS falling problem has been addressed and well discussed using experimental investigation.
Key words: Predictive maintenance, fatigue spalling, root mean square falling, vibration monitoring, rolling contact fatigue.
INTRODUCTION
Among damages encountered in bearings, the predominant one is rolling contact fatigue which is a complex process that requires the skills of contact mechanics and material science (Dudragne, 2000; Fernandes, 1997). The industrial needs led us to investigate the modelling of spalling damage. Progress has been made to improve load capacity and reduce heat using lubrication. This progress has led to establish new models based on micromechanics and physical metallurgy of metals. In these models which are based on Weibull’s probability theory (Gupta and Zaretsky, 2018), the crack initiation is related to the presence of stress concentration (El Laithy et al., 2019), and to the dislocations, emission to the critical stress concentration area (Tallian, 1999); whereas, crack propagation results from the emission of dislocations towards the crack tip according to the applied stress field (Rycerz et al., 2017). This new approach should ultimately allow a finer estimation of the bearing’s life time; taking into account both the intrinsic properties of materials and the real tribological stresses on the contact surfaces. In general, fatigue occurs without overall plastic deformation, but threshold (Allison and Pandkar, 2018). The fatigue test consists of subjecting each bearing to a load and to a constant frequency, taking into consideration the resulting cycles number or the operating time until bearing’s failure. The most commonly used method for monitoring a bearing defect is vibration analysis which we will use in this study (Alfredson and Mathew, 1985a, b; Lei et al., 2018).
TESTING PROCEDURES
The tests are carried out on a batch of identical single row thrust ball bearings. The purpose is to monitor the growth of a fatigue micro-spalling until it reaches a large size sufficient to cause bearing’s failure. The fatigue module of the test bench shown in Figure 1 is used to perform experiments. During tests, a constant axial load of 30000 N is applied on the bearing, while the rotation speed is kept constant at 1800 rpm. The cooling lubricant flow rate is also kept constant. Two piezoelectric accelerometers (8) of references DJB3208 and DJB3209 are placed as close as possible to the bearing in axial and radial directions. The test bench shown in Figure 1 consists of three main parts: (i) a fixed base which is composed of two plates (3) linked with four uprights (4); (ii) a rotating part that includes the main shaft (2) which crosses one plate to allow positioning of the tested bearing on its end; and an electric motor (1) which transmits the rotation movement to the shaft by means of a coupling; (iii) the loading device which consists of a cylinder (5) that applies a load on the press (6) which, in turn, ensures a uniform distribution of the load applied on the bearing. The load intensity is indicated by a display device (7). The used thrust bearings are of reference FAG 51207 CZECH/ATK with an internal diameter of 35 mm, an external diameter of 64 mm, and 12 balls.

SPALLING evolution
The evolution of the bearing spalling is illustrated in Figure 2. It is expressed by its surface denoted by s, and the vibratory level defined by the root mean square (RMS) value of the vibration signal measured at time (t) (Bastami and Vahid, 2021; Manoj et al., 2008). The RMS value of the signal is the normalized second statistical moment of the signal. It is given by:
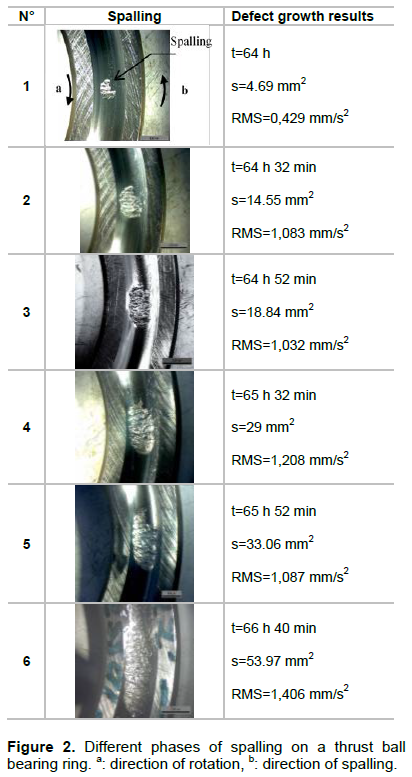

where, N: is the number of samples taken from the signal, : is the average value of the time signal amplitudes.
The RMS values indicated in Figure 2 represent the energy of the vibration signal acquired at time t by the axial accelerometer. Figure 3 illustrates the evolution of spalling size (s) induced on the tested thrust bearing with respect to time. The obtained trend curve shows that a good correlation exists between the spalling size and the spalling time, which follows a power law.

RMS FALLING ANALYSIS
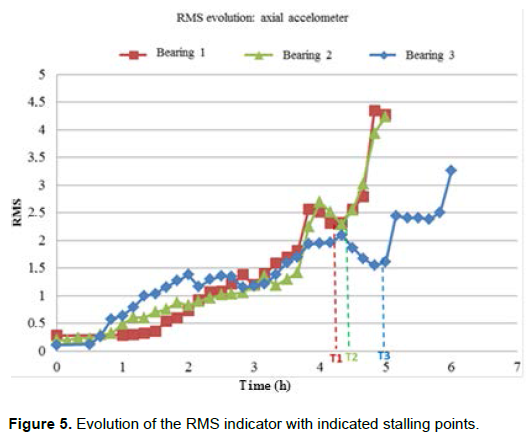
Figure 4 shows the entire evolution of RMS used to monitor the thrust bearing degradation. This includes the normal operating phase (without defect) and the spalling phase. We can observe that RMS had small values before spall initiation, which increased monotonically until it reaches a point where it decreases abruptly, and then starts increasing again until bearing failure. The RMS trend curve stalling is well indicated in Figure 5 by three points T1, T2, T3 corresponding to three tested bearings.

Through the fatigue tests carried out on thrust ball bearings, we have seen that the fall in the RMS value corresponds to a spalling defect size close to 59 mm2 (Figure 7). This defect extends over the entire width of the raceway which is equal to 5 mm, and therefore corresponds to an arc length equal to 12 mm. Using the geometrical specifications of the tested bearings, the distance between two consecutive balls can be found as follows:

Where p is the distance separating two balls, N is the number of balls which is equal to 12, and Rm is the bearing average radius given by:

We can see that the distance separating two consecutive balls is almost equal to the defect arc length. Therefore, it was concluded that the RMS fall would be due to the presence of two balls in the defect simultaneously; one exiting the spall and the other entering it as illustrated in Figure 6.


DISCUSSION
The appearance of spalling on the raceway of the thrust ball bearing causes shocks when the balls hit the defect. These shocks are due to spalling surface irregularities, and result in peaks of positive and negative amplitudes corresponding to the simultaneous entering and exiting of two successive balls in and out of the defect. These amplitudes give rise to the sinusoidal function amplitude at the passage frequency of the balls on the external raceway (BPFO). This is illustrated by phase 2 of Figure 6.
In fact, when the spalling size reaches an arc length corresponding to the distance between two consecutive balls, these rolling elements become both inside the defect surface. Thus, ball 1 will create a positive amplitude shock because it is entering the spall, while the exiting ball 2 will produce a negative amplitude shock. Therefore, the effects are offset. This is illustrated by phase 3 in Figure 6.
The value of the indicator undergoes a fluctuation (stall phenomenon) at the points T1, T2 and T3 corresponding, respectively, to the RMS trend curves of bearings 1, 2 and 3 as shown in Figure 5. The results show that the vibratory level changes linearly with respect to the defect size along a great part of the spalling phase, and then stabilizes slightly undergoing some fluctuations when the spalling reaches a significant size, and finally increases abruptly before bearing failure.
The RMS falling gives us an important indication about bearing life’s limit. As shown in Figure 5, for all the tested bearings, the evolution curves undergo systematically an abrupt decrease after a spalling duration which approaches 85% of the spalling phase time and corresponding to an average spalling size of 55 mm2. To ensure a best health monitoring of bearings, establishing a threshold for the vibration indicator RMS should be considered based on the results obtained in this study. This, in turn, helps with creating reliable models for bearings remaining useful life prognostics.
CONCLUSION
In this study, the problem of RMS falling when the thrust ball bearing approaches failure was discussed. Experimental results showed that this is due to an excessive spalling size whose length approaches the distance between two successive balls. Hence, an RMS threshold should be set to avoid such misleading indications.
Through this work, it was concluded also that the best monitoring of the bearings spalling evolution depends on:
1) The vibration indicator reliability as long as there exists a variety of statistical indicators used in vibration monitoring such as kurtosis, RMS, crest factor. Some indicators may be more sensitive; therefore, more accurate to describe the spalling evolution;
2) The trend of the vibratory indicator with respect to the spalling time before its stalling.
It was also figured out that spalling evolution in thrust ball bearings with respect to operating time follows an exponential law. Thus, this work still needs more efforts to establish a spalling growth model which leads to predicting of the remaining useful life of thrust ball bearings; and therefore reduce unplanned maintenance operations.
CONFLICT OF INTERESTS
The authors have not declared any conflict of interests.
REFERENCES
|
Alfredson RJ, Mathew J (1985a). Frequency domain methods for monitoring the condition of rolling element bearings. Transactions of the Institution of Engineers, Australia. Mechanical engineering ME 10(2):108-112. |
|
|
Alfredson RJ, Mathew J (1985b). Time domain methods for monitoring the condition of rolling element bearings. Transactions of the Institution of Engineers, Australia. Mechanical engineering ME 86(2):102-107. |
|
|
Allison B, Pandkar A (2018). Critical factors for determining a first estimate of fatigue limit of bearing steels under rolling contact fatigue. International Journal of Fatigue 117:396-406. |
|
|
Bastami AR, Vahid S (2021). A comprehensive evaluation of the effect of defect size in rolling element bearings on the statistical features of the vibration signal. Mechanical Systems and Signal Processing 151:107334. |
|
|
Dudragne G (2000). Rolling element bearings: Operational limits and damage mechanisms. Mecanique et Industries 1(6):593-602. (In French). |
|
|
El Laithy M, Wang L, Harvey TJ, Vierneusel B, Correns M, Blass T (2019). Further understanding of rolling contact fatigue in rolling element bearings - A review. Tribology International 140:105849. |
|
|
Fernandes PJL (1997). Contact fatigue in rolling-element bearings. Engineering Failure Analysis 4(2):155-160. |
|
|
Gupta PK, Zaretsky EV (2018). New stress-based fatigue life models for ball and roller bearings. Tribology Transactions 61(2):304-324. |
|
|
Lei Y, Li N, Guo L, Li N, Yan T, Lin J (2018). Machinery health prognostics: A systematic review from data acquisition to RUL prediction. Mechanical Systems and Signal Processing 104:799-834. |
|
|
Manoj V, Manohar Shenoy K, Gopinath K (2008). Developmental studies on rolling contact fatigue test rig. Wear 264(7 8):708-718. |
|
|
Rycerz P, Olver A, Kadiric A (2017). Propagation of surface initiated rolling contact fatigue cracks in bearing steel. International Journal of Fatigue 97:29-38. |
|
|
Tallian TE (1999). Failure atlas for Hertz contact machine elements. ASME Press, New York P 496. |
|
Copyright © 2024 Author(s) retain the copyright of this article.
This article is published under the terms of the Creative Commons Attribution License 4.0


