ABSTRACT
Pulses play an important role in addressing hunger, food insecurity, malnutrition, environmental degradation, climate change impacts and human health, thereby supporting the overall achievement of the Sustainable Development Goals. Pulses yield is very low under arid and semiarid climate. Field experiment was conducted to evaluate the impact of phosphorus (0, 30, 60 and 90 kg P ha-1) and organic sources [sole animal manure (10 t ha-1), sole legume residues (10 t ha-1), and integration of animal manures + legume residue (5 t ha-1 each)] on the phenological development, growth, yield and yield components of mung bean (Vigna radiata L.) in comparison to mash bean (Vigna mungo L.) under rainfed/moisture stress condition at the Agronomy Research Farm of The University of Agriculture, Peshawar-Pakistan. The results revealed that increase in P levels resulted in earlier phenological development, improved growth, increased number of nodules plant-1, yield and yield components of both crops. Combined application of animal manures and legume (gram or chickpea) residues (5 t ha-1 each) ranked first in terms of better growth and higher yield and yield components of both crops, followed by sole animal manure (cattle manure), while sole legume residues stood at the bottom in the ranking.
Key words: Mung bean, mash bean, phosphorus levels, organic sources, dry land.
Malnutrition is one of the major problems in many parts of the world and is mainly due to protein deficiency in the diet. Pulses (grain legumes) are the major and cheaper source of protein as compared to animal protein. Grain legumes crops cultivated especially for their mature seeds for human consumption are called pulses (Amanullah, 2016). Pulses are important food crops that can play a major role in achieving food security, nutrition, and human health, contributing to the sustainability of agriculture and aiding the mitigation and adaptation to climate change. However, despite the importance given to pulses by the establishment of the International Year of Pulses 2016 (UN, 2013), pulses are not well known to most people (FAO, 2016). In terms of nutrition and food security, pulses provide a good source of plant based protein as well as fibre, vitamins (e.g., B vitamins) and minerals such as iron, potassium, magnesium and zinc (FAO, 2016). Pulses seeds have high protein content (19 to 33%) (Werner, 2005), which make them an asset in achieving food security worldwide (FAO, 2016).
According to Campos-Vega et al. (2010), consumption of pulses may positively impact human health as they can reduce the risk of cardiovascular diseases, prevent diabetes and may protect against obesity, among other things. Mung bean (Vigna radiata L., Wilczek), commonly known as green gram, contains 51% carbohydrate, 24 to 26% protein, 4% mineral, and 3% vitamins (Afzal et al., 2008). Mash bean (Vigna mungo L., Hepper) known as black gram is one of the most important leguminous crops and its seeds contain about 24% protein, 60% carbohydrates, and 1.3% fats (Ali et al., 2002). Both mung bean and mash bean also contain high amount of vitamins A, B, C and minerals such as potassium, phosphorus and calcium, which are necessary for human body (Rattanawongsa, 1993; Sarwar et al., 2004).
Pulses cultivation loses its importance because of low yield (Amanullah, 2016). However, the low yields and overall production of many pulse crops in many parts of the world is attributed to major constraints which include: (1) strong competition from cereals (wheat, maize and rice), cash and industrial crops (cotton, sugarcane, tobacco, oilseed crops, etc.) which gave better economic returns, (2) lack of modern pulses production technologies designed to maximize resource use and so ineffective crop management practices, (3) shortage of experienced personnel and lack of effective research and extension programmes, and (4) lack of high yielding pulses varieties and the poor state of seed multiplication, certification, distribution systems, etc. (Amanullah, 2016). Due to the high population pressure, the total cultivable land of pulses is also decreasing day by day. That is why pulses cultivation has been shifted to marginal lands because farmers are not interested to use their fertile land for pulse crops cultivation.
Phosphorus unavailability (Amanullah and Khan, 2015; Amanullah and Khalid, 2015) and low organic matter in the soils (Iqbal et al., 2015; Amanullah and Khalid, 2016; Amanullah and Hidaytullah, 2016) decline crop productivity under semiarid climate. Phosphorus fertilization to legumes is more important than that of nitrogen and phosphorus is a major component of compounds whose functions relate to growth, root development, flowering, and ripening and favorably influences the nodulation in legumes crops (Tang et al., 2001; Abel et al., 2002; Raboy, 2003; Shu-Jie et al., 2007). Application of organic manures enhance the fertility of soil and crop production by increasing bioavailability of nutrients, water holding, cation exchange capacity and microbial population and activity (Walker et al., 2004; Clemente and Bernal, 2006; Muhammad and Khattak, 2009). Organic manures remain for longer time in the soil, the nutrients releases slowly and become available to the plants gradually (Malival, 2001; Das, 2005).
The ability of the organic materials to supply nutrients differs, as they relate to the rates of decomposition, nutrient release rates and patterns (Kumar and Goh, 2004). The role of pulses in the N and P cycles is ultimately important to adapt to and mitigate climate change, helping to achieve the sustainable development goals (FAO, 2016). When the soil is exploited for crop production without restoring the organic matter and nutrient content, the nutrient cycles are broken, soil fertility declines and the balance in the agro-ecosystem is destroyed (FAO, 2015). Therefore, sustainable agricultural management such as incorporation of different organic sources in soils is urgently needed to enhance crop production under cereal based cropping systems (Amanullah et al., 2015, Amanullah and Khalid, 2016; Amanullah and Hidyatullah, 2016). The objective of this research was to investigate the differences in growth and yield of mung bean and mash bean under various levels of phosphorus and organic sources under semiarid climate.
Site description
Field experiments were conducted at the Agronomy Research Farm of University of Agriculture, Peshawar, during summer 2015 with the objective to investigate the effects of organic sources (OS) [sole animal manure, sole chickpea residues, and combined animal manure + chickpea residues] and phosphorus (P) levels (30, 60 and 90 kg P ha-1) along with one control (OS and P non applied) on the growth, yield and yield components of mung bean and mash bean under dry land condition. The Agronomy Research Farm is located at 34.01°N, 71.35°E, at an altitude of 350 m above sea level in the Peshawar valley.
Peshawar is located at about 1600 km north of the Indian Ocean and has semiarid climate. The research farm is irrigated by the Warsak canal from the Kabul River. Soil texture is clay loam, low in organic matter (0.87%), extractable phosphorus (6.57 mg kg−1), exchangeable potassium (121 mg kg−1), and alkaline (pH 8.2) and is calcareous in nature (Amanullah et al., 2009). The climate of the area is semiarid where the mean annual rainfall is very low (300 to 500 mm), 60 to 70% rainfall occurs in summer, while the remaining 30 to 40% rainfall occurs in winter (Amanullah et al., 2012).
Experimentation
Two separate field experiments were conducted one on mung bean and second on mash bean. The experiment for each crop was laid out in RCB design using three replications. Each replication consisted of 10 treatments (three OS × three P levels plus one control plot). A sub-plot size of 4 m × 4 m, having 5 rows, 2 m long and 30 cm apart was used. Organic sources used as main plot factor were applied and incorporated in their respective plots one month before sowing. The two sole organic sources (animal manure and chickpea residues) were applied at the rate of 10 t ha-1, while in the case of combined animal manures + chickpea residues treatment, both organic sources were applied at the rate of 5 t ha-1 each. The required P levels as single super phosphate (SSP) (18% P2O5) were applied at seedbed preparation just before sowing for each crop (each experiment).
Mung bean variety “NM-54” and mash bean variety “Mash 48” were used as test crops and each were sown at the rate of 25 to 30 kg ha-1 on June 23, 2015. A uniform basal dose of 30 kg N ha-1 as urea (46% N) was applied and mixed with the soil during seedbed preparation to all plots for each crop. All other agronomic practices were carried out equally during the growing season. Both crops were harvested in the month of September 2015. Data were recorded on emergence m-2, plant height (cm), number of leaves plant-¹, number of branches plant-¹, number of nodules plant-¹, days to flowering, days to pod formation, number of pods plant-¹, number of seeds pod-¹, pod length (cm), days to physiological maturity, thousand grains weight (g), biological yield (kg ha-1), grain yield (kg ha-1), and harvest index (%).
(1) Emergence m-²: Emergence rate was recorded when all 50% of the sub-plots seedling appeared.
(2) Plant height (cm): Data on plant height (cm) at physiological maturity was recorded from the base to the tip of the plant with the help of meter rod by selecting five plants randomly from each sub-plot and average was worked out.
(3) Number of leaves plant-¹: Number of leaves per plant was found by taking five plants randomly from each sub-plot and mean was worked out.
(4) Number of branches plant-¹: Number of branches plant-1 was numbered by taking five plants randomly in each sub-plot and mean was worked out.
(5) Number of nodules plant-¹: Number of nodules plant-1 at the time of pod initiation was counted by uprooting five plants randomly from each subplot.
(6) Days to flowering: Days to flowering date counting until 50% of the plants have flowering in each sub-plot.
(7) Days to pod formation: Days from date of emergence to the pod formation counting until 50% of the plant produced pods in each sub-plot.
(8) Number of pods plant-¹: Number of pods plant-1 of five randomly selected plants for each sub-plot was counted and the average was calculated.
(9) Number of seeds pod-¹: Ten pods selected from five plants from each subplot. The seeds were counted and the average was calculated.
(10) Pod length (cm): The pod lengths of 10 pods were measured by scale which was randomly selected from five plants from each plot and then the average was calculated.
(11) Days to physiological maturity: Days to first physiological maturity were observed when 50% of the pods in each sub-plot change their color to light brown or dark brown.
(12) Thousand grains weight (g): Grains weight was calculated by taking thousand grains from the seed lot of each sub-plot and weighed with the help of electronic balance.
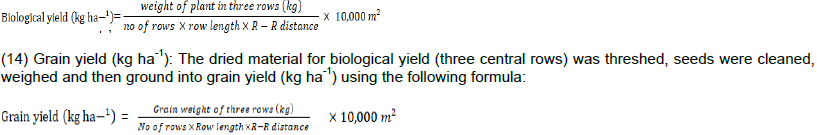
(13) Biological yield (kg ha-1): Data on biological yield was recorded on the three central rows. The three central rows were harvested, the material was dried up to constant weight under sun light weight and then converted into biological yield (kg ha-1) using the following formula:
Statistical analysis
The collected data on various parameters were subjected to the analysis of variance according to split plot design (Steel et al., 1996) combined over the two crops and means between treatments were compared using least significance difference (LSD) test at 5% level of probability (P≤0.05).
Emergence m2
Emergence m2 was significantly by legumes, but phosphorous, organic sources, OS × P, L × P, L × OS, and L × OS × P interactions have no significant effect on days to emergence m2 (Table 1). Mash bean emergence was 24 plants m2 and mung bean 30 plants m2. The control plots have 25 while the rest treated plots have 28 plants m2.
Plant height
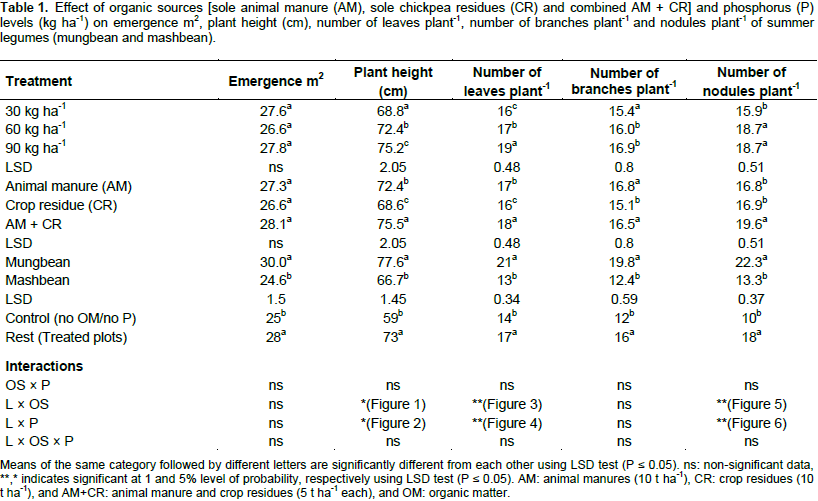
Plant height was significantly affected by legumes, phosphorous levels, organic sources, L × OS and L × P. The interactions of OS × P and L × OS × P have no significant effect on plant height (Table 1). Mash bean plant height (66.7 cm) was smaller than mung bean (77.6 cm). The rest (treated plots) produced significantly taller plants (73 cm) than control (59 cm). Among the P levels, the highest plant height (75.2 cm) was recorded for the highest P level 90 kg P ha-1. Plots treated with the lowest P level 30 kg P ha-1 produced the lowest plant height (68.8 cm). Among the organic sources, combined application of AM + CR produced the tallest plants (75.5 cm), followed by sole animal manure (72.4 cm), while the shortest plant height (68.6 cm) was recorded with the application of sole crop residues. In case of OS × L interaction, plant height increased with sole animal manure or combined application of AM + CR than sole crop residues application in both crops (Figure 1). In case of L × P interaction, plant height increased with increase in P levels in both legume crops and the increase was more for mung bean than mash bean (Figure 2).

Number of leaves plant-1
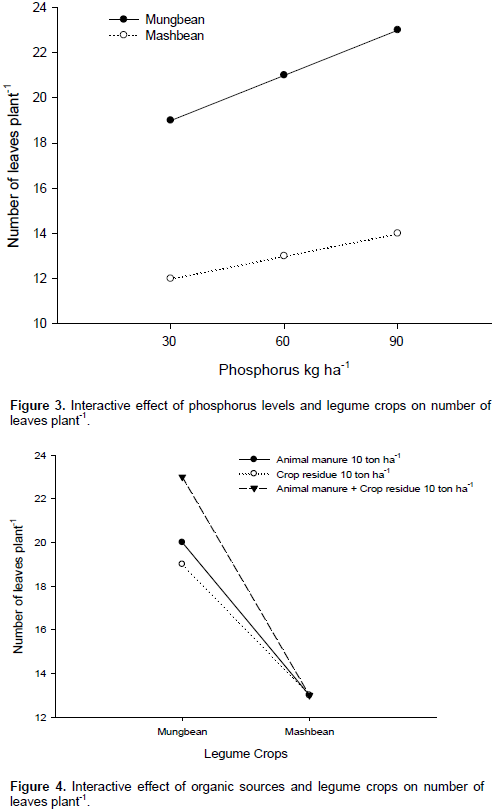
Number of leaves plant-1 was significantly affected by legumes, phosphorous, organic sources, L × P and L × OS interactions (Table 1). The interaction of OS × P and L × OS × P have no significant effect on number of leaves plant-1 in legumes. Mash bean have less number of leaves plant-1 (13) than mung bean (21). The rest (treated plots) produced significantly high number of leaves plant-1 (17) than control (14). In case of P, more number of leaves plant-1 was observed with 90 kg P ha-1 (19). Plots treated with 30 kg P ha-1 have minimum (17) leaves plant-1 followed by 60 kg P ha-1 has 16. Among the organic sources, animal manure treated plots have maximum number of leaves plant-1 (17), crop residues have 16, while 18 leaves plant-1 were recorded in their combination (AM + CR). In case of L × P interaction, number of leaves plant-1 increases with increase in P levels under both legume crops (mash bean and mung bean) (Figure 3). In case of L × OS interaction, number of leaves plant-1 increases with increase in sole animal manure and combination of AM + CR residue as compared to sole crop residue (Figure 4).
Number of branches plant-1
Number of branches plant-1 was significantly affected by legumes, phosphorous levels and organic sources. The interactions of L × OS, L × P, OS × P and L × OS × P have no significant effect on number of branches plant-1 (Table 1). Mash bean number of branches plant-1 observed 19.8 which is lesser in number than mung bean (12.4). The rest (treated plots) produced significantly high number of branches plant-1 (16) than control (12). Among the P levels, high number of branches (16.9) was recorded for the highest P level 90 kg P ha-1. Plots treated with the lowest P level 30 kg P ha-1 produced the lowest number of branches plant-1 (15.4). Among the organic sources, sole animal manure produced the highest branches plant-1 (16.8), followed by combined application of AM + CR (16.5), while the lowest number of branches plant-1 (15.1) was recorded with the application of sole crop residues.
Nodules plant-1
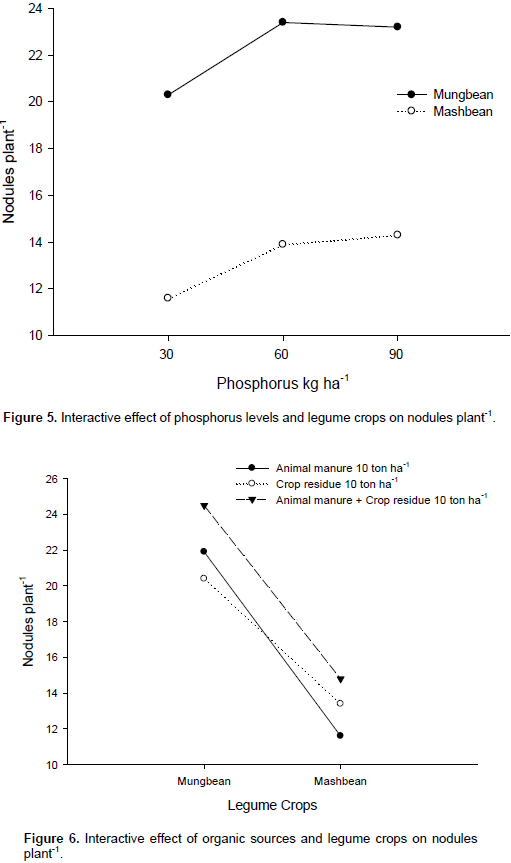
Nodules plant-1 was significantly affected by legumes, phosphorous, organic sources, L × P and L × OS interactions (Table 1). The interactions of OS × P and L × OS × P were found non-significant for nodules plant-1. Mung bean as maximum number of nodules plant-1 (22.3) than mash bean (13.3 days). The rest (treated plots) produced significantly high number of nodules plant-1 (18) than control (10). In case of P, more number of nodules plant-1 was observed at 90 kg and 60 kg P ha-1 (18.7). Plots treated with 30 kg P ha-1 have less number of nodules plant-1 (15.9). Among the organic sources, animal manure and crop residues have less number (16), while the maximum number of nodules plant-1 (19) was recorded in their combination (AM + CR). In case of L × P interaction, maximum number of nodules plant-1 was noted with the increase in P levels under both legume crops (mash bean and mung bean) Figure 5. In L × OS interaction, maximum number of nodules plant-1 resulted in the combine effect of AM + CR followed by sole (AM) with P levels at 90 kg ha-1 (Figure 6).
Days to first flowering
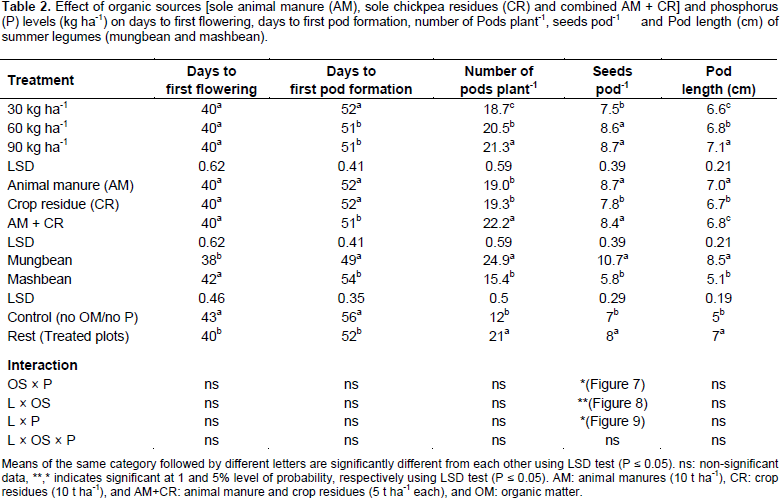
Days to first flowering were significantly affected by legumes but organic sources and phosphorous levels have no significant effect on days to first flowering. All the interactions L × OS, L × P, OS × P and L × OS × P were also found non-significant (Table 2). Mash bean took (42 days) to flowering as compared to mung bean (38 days). The rest (treated plots) cause early flowering (40 days) than control (43 days).
Days to first pod formation
Days to first pod formation was significantly affected by legumes, phosphorous, and organic sources (Table 2). OS × P, L × P, L × OS and L × OS × P interactions were found non-significant for days to first pod formation. Mash bean took maximum days to first pod formation (54) as compared to mung bean (49 days). The rest (treated plots) took maximum days (52) as compared to control (56 days). In case of P, first pod formation was observed with 90 kg and 60 kg P ha-1 (51 days). Plots treated with 30 kg P ha-1 took more days to pod formation (52 days). Among the organic sources, animal manure and crop residues took maximum days to first pod formation (52), while minimum (51) days were recorded in their combination (AM + CR).
Number of pods plant-1
Number of pods plant-1 was significantly affected by legumes (L), phosphorous (P), organic sources and L × OS (Table 2). The interactions of OS × P, L × P and L × OS × P have no significant effect on the number of pods plant-1 in legumes. Mash bean have less number of pods plant-1 (15.4) as compared to mung bean (24.9). The rest (treated plots) produced significantly high number of pods plant-1 (21) than control (12). In case of P, more number of pods was observed with 90 kg P ha-1 (21.3). Plots treated with 30 kg P ha-1 have less number of pods plant-1 (18.7) followed by 60 kg P ha-1 (20.5). Among the organic sources, animal manure treated plots have 19.0 pods, crop residues have 19.3, while maximum (22.2 pods plant-1) was recorded in their combination (AM + CR).
Number of seeds pod-1
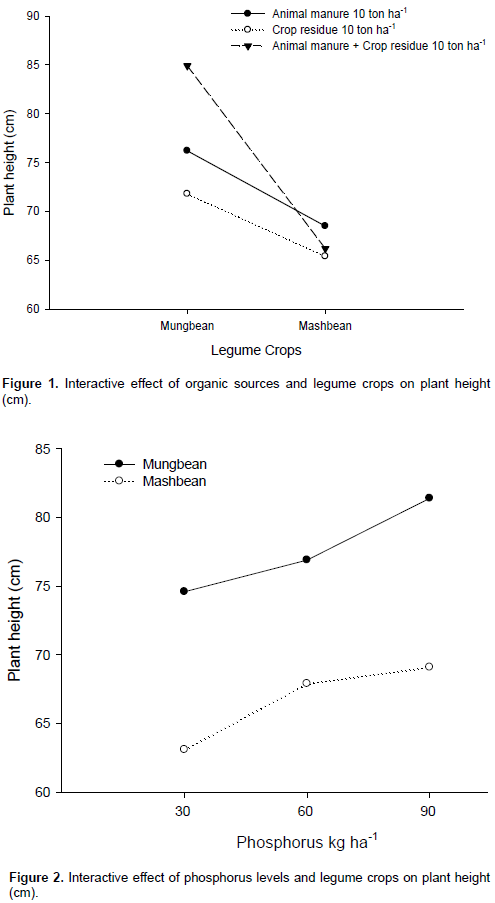
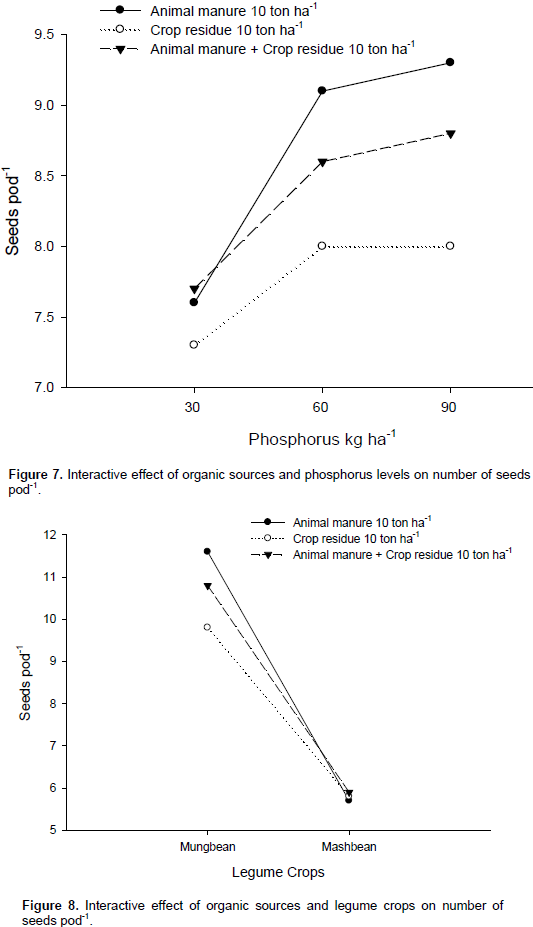
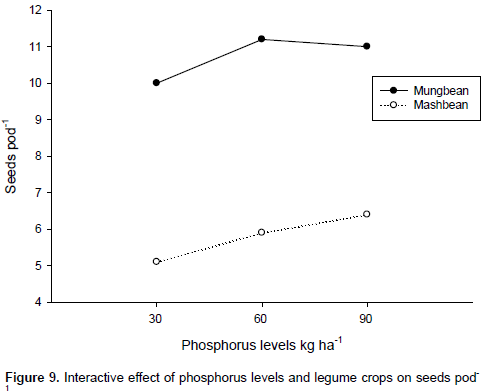
Number of seeds pod-1 was significantly affected by legumes, phosphorous levels, and organic sources. The interactions of OS × P, L × P and L×OS have significantly affected the seeds pod-1, while L × OS × P interaction was found non-significant (Table 2). Mash bean produced 5.8 seeds pod-1 as compared to mung bean (10.7). The rest (treated plots) produced higher seeds pod-1 (8) than control (7). Among the P levels, the highest seeds (8.7) were recorded for the highest P level 90 kg P ha-1. Plots treated with the lowest P level (30 kg P ha-1) produced the lowest seeds pod-1 (7.5). Among the organic sources, application of sole animal manure produced the highest seeds pod-1 (8.7), followed by combined application of AM + CR (8.4), while the lowest seeds (7.8) were recorded with the application of sole crop residues. In case of OS × P interaction, increase in seeds pod-1 was observed with increase in P level, and the highest increase was obtained under sole animal manure and least increase under sole crop residues (Figure 7). In case of OS × L interaction, seeds increased with sole animal manure, combine application of AM + CR with high level of phosphorus 90 kg ha-1 and declined with sole crop residues application for both crops (Figure 8). In case of L × P interaction, seeds pod-1 increased at a higher rate with increase in P levels in both legume crops, and the increase was more for mung bean than mash bean (Figure 9).

Pod length
Pod length was significantly affected by legumes (L), phosphorous (P) and organic sources (Table 2). The interactions of OS × P, L × p, L × OS and L × OS × P were found non-significant for pod length. Mash bean have smaller pod length (5.1 cm) than mung bean (8.5 cm). The rest (treated plots) produced significantly longer pods length (7 cm) than control (5). In case of P, the highest pod length was observed with 90 kg P ha-1 (7.1 cm). Plots treated with 30 kg P ha-1 have smaller pod length of 6.6 cm followed by 60 kg P ha-1 with 6.8 cm. Among the organic sources, animal manure treated plots have pod length (7.0 cm), crop residues have 6.7 cm, while pod length of 6.8 cm was recorded in their combination (AM + CR).
Days to physiological maturity
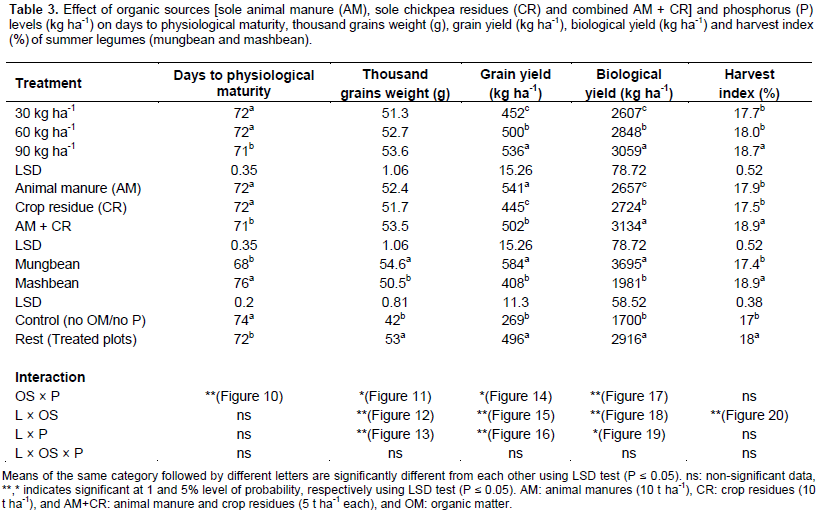
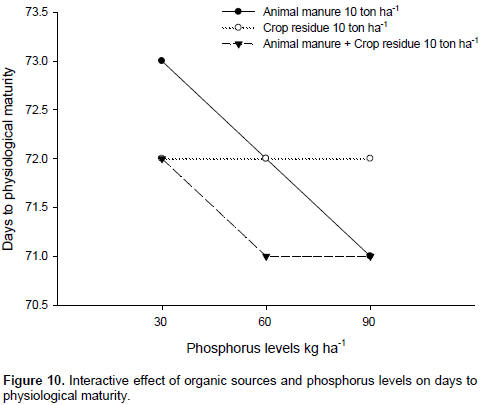
Days to physiological maturity were significantly affected by legumes, phosphorous, organic sources and OS × P interaction (Table 3). The interactions of L × P, L × OS and L × OS × P have no significant effect for days to physiological maturity. Mash bean took maximum days to physiological maturity (69) as compared to mung bean (67 days). In case of P, early physiological maturity was observed with 90 kg P ha-1 (71 days). The rest (treated plots) cause early physiological maturity (72 days) than control (74). Plots treated with 30 kg P ha-1 and 60 kg P ha-1 took more days to physiological maturity (72 days). Among the organic sources, animal manure and crop residues took maximum days to first physiological maturity (72), while minimum days to physiological maturity (71 days) were recorded in their combination (animal manure + crop residues). In case of OS × P interaction, early physiological maturity was observed in combine application of AM + CR and sole (AM) with the increase in P levels under both legume crops(mash bean and mung bean) (Figure 10).


Thousand grains weight
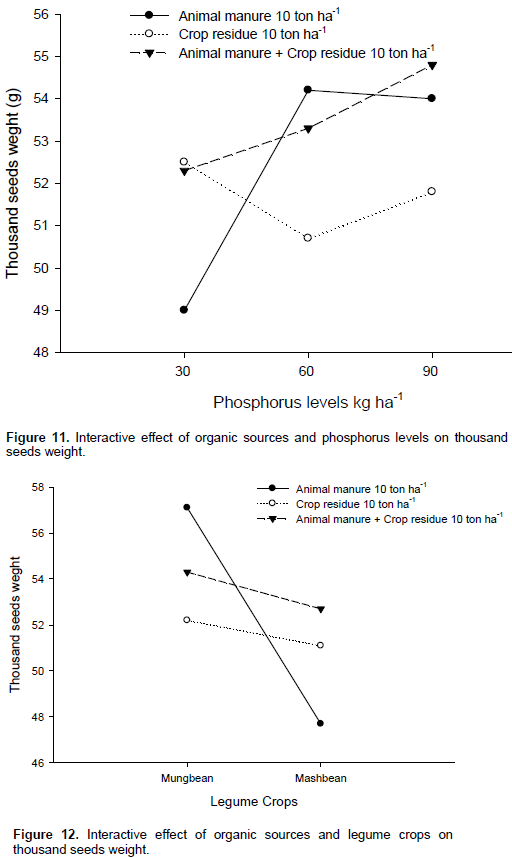
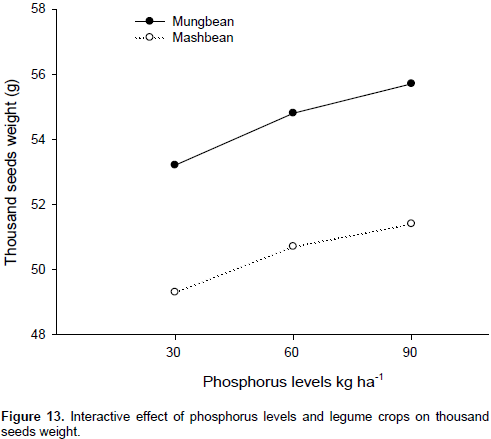
Thousand grain weight was significantly affected by legumes, phosphorous, organic sources, OS × P and L × P and L × OS (Table 3). The interaction of L × OS × P has no significant effect on thousand grain weight in legumes. Mash bean have less thousand grain weight (48.0) than mung bean (53.7). The rest (treated plots) produced significantly high grains weight (53 g) than control (42 g). Among the P levels, the highest grain yield (53.6 g) was recorded for the highest P level (90 kg P ha-1). Plots treated with the lowest P level (30 kg P ha-1) produced the lowest grain weight (51.3 g). Among the organic sources, combined application of animal manure + crop residue produced the highest grains weight (53.5 g), followed by application of sole animal manure (52.4 g), while the lowest grain weight (51.7 g) was recorded with the application of sole crop residues. In case of OS × P interaction, increase in grain weight observed with increase in P level and the highest increase was obtained under combined application of AM + CR and least increase under sole crop residues (Figure 11). In case of OS × L interaction, grain weight increased with sole animal manure application, followed by combine application of AM + CR and declined with sole crop residues application for both crops (Figure 12). In case of L × P interaction, grain yield increased at a higher rate with increase in P levels in both legume crops and the increase was more for mung bean than mash bean (Figure 13).
Grain yield
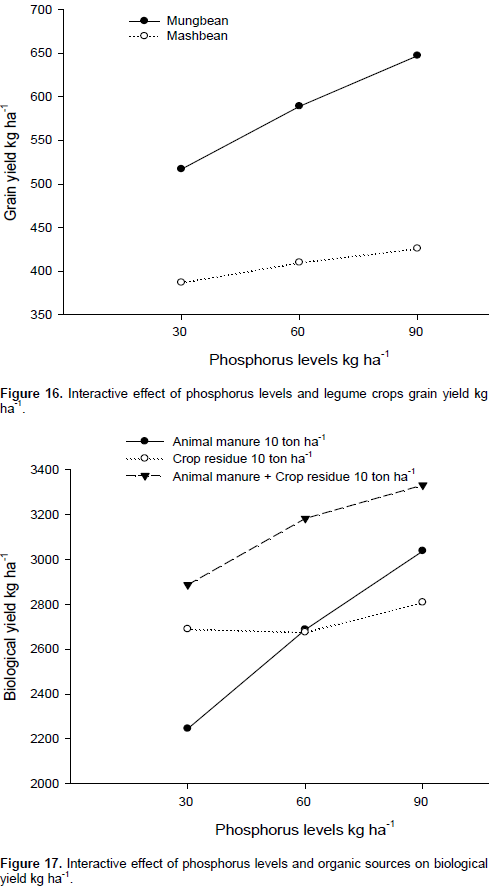
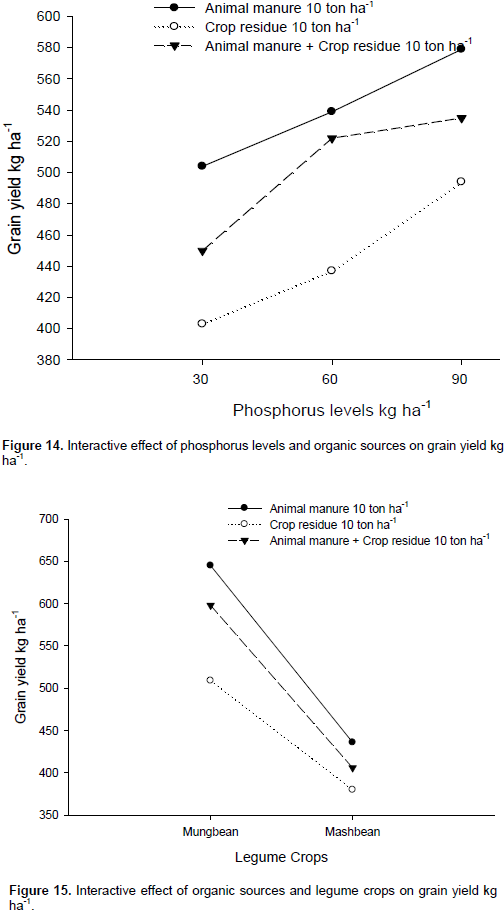
Grain yield was significantly affected by legumes, phosphorous levels, organic sources, OS × P, L × P and L × OS, while L × OS × P interaction has non-significant effect on grain yield (Table 3). Mash bean produced lower grain yield (408 kg ha-1) than mung bean (584 kg ha-1). The rest (treated plots) produced significantly higher grain yield (496 kg ha-1) than control (269 kg ha-1). Among the P levels, the highest grain yield (536 kg ha-1) was recorded for the highest P level (90 kg P ha-1). Plots treated with the lowest P level (30 kg P ha-1) produced the lowest grain yield (452 kg ha-1). Among the organic sources, application of sole animal manure produced the highest grain yield (541 kg ha-1), followed by combined application of AM + CR (502 kg ha-1), while the lowest grain yield (445 kg ha-1) was recorded with the application of sole crop residues. In case of OS × P interaction, increase in grain yield was observed with increase in P level, and the highest increase was obtained under sole animal manure and least increase under sole crop residues (Figure 14). In case of OS × L interaction, grain yield increased with sole animal manure application and declined with sole crop residues application for both crops (Figure 15). In case of L × P interaction, grain yield increased at a higher rate with increase in P levels in both legume crops, and the increase was more for mung bean than mash bean (Figure 16).
Biological yield
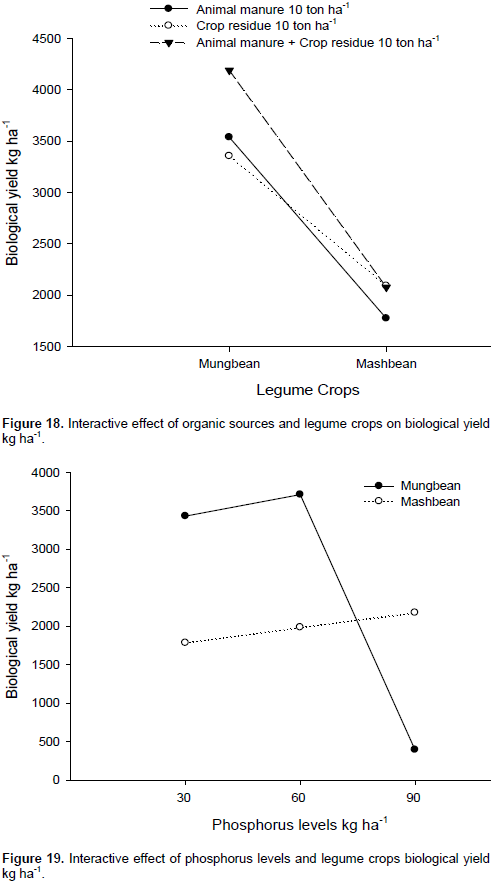
Biological yield was significantly affected by legumes, phosphorous levels and organic sources (Table 3). The interactions OS × P, L × P, and L×OS significantly affected the biological yield, while L × OS × P had no significant effect on biological yield. Mash bean produced lower biological yield (1981 kg ha-1) as compared to mung bean (3695 kg ha-1). The rest (treated plots) produced significantly higher biological yield (2916 kg ha-1) than control (1700 kg ha-1). Among the P levels, the highest biological yield (3059 kg ha-1) was recorded for the highest P level (90 kg P ha-1). Plots treated with the lowest P level (30 kg P ha-1) produced the lowest yield (2607 kg ha-1). Among the organic sources, combined application of AM + CR produced the highest biological yield (3134 kg ha-1), followed by application of sole animal manure (2657 kg ha-1), while the lowest biological yield (2724 kg ha-1) was recorded with the application of sole crop residues. In case of OS × P interaction, increase in biological yield was observed with increase in P level, and the highest increase was obtained under (AM + CR) and least increase under sole crop residues (Figure 17). In case of OS × L interaction, biological yield increased with sole animal manure application, and declined with sole crop residues application for both crops (Figure 18). In case of L × P interaction, grain yield increased at a higher rate with increase in P levels in both legume crops, and the increase was more for mung bean than mash bean (Figure 19).


Harvest index
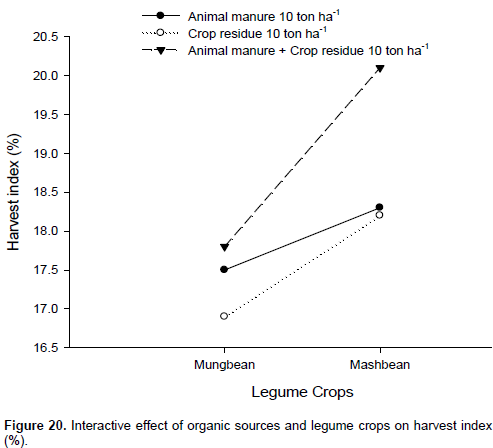
Harvest index was significantly affected by legumes, phosphorous, organic sources and L × OS (Table 3). The interactions of OS × P, L × P and L × OS × P have no significant effect on harvest index in legumes. Mash bean has minimum harvest index (17.4 kg) than mung bean (18.9 kg). The rest (treated plots) produced significantly higher harvest index (18 kg ha-1) than control (17 kg ha-1). In case of P, more yields were observed with 90 kg P ha-1 (18.7 kg). Plots treated with 30 kg P ha-1 have minimum (17.7 kg) harvest index and 60 kg P ha-1 has 18.0 kg. Among the organic sources, animal manure treated plots have 17.9 kg harvest index, chickpea residues have minimum harvest index of 17.5 kg, while maximum (18.9 kg) was recorded in their combination (AM + CR). In case of OS × L interaction, harvest index increased with sole animal manure application and declined with sole crop residues application for both crops (Figure 20).
Effect of phosphorus
There was delay in phenological development (days to first flowering, pod formation and physiological maturity) in both summer pulses (mung bean and mash bean) with no P application or the use of lower P rate (30 kg P ha-1). Early phenological development was recorded with higher P rates (60 and 90 kg ha-1). Delayed heading and physiological maturity was observed when P was not applied (P control plots). Early flowering, pods formation and physiological maturity in mung bean were observed with the application of the highest rate of 90 kg P ha-1 (Amanullah et al., 2014). Khalil et al. (2010) described that increase in P level results in earlier phonological development. Decrease in P levels caused delay in phenological development of both crops. These results agree with those of Amanullah et al. (2014) who reported that mung bean applied with no P (P-control) had delayed flowering and pods formation. Likewise, delayed maturity in the P-control plots was observed in mung bean (Jan et al., 2012a) and chickpea (Jan et al., 2012b).
Growth parameters in this study, viz. plant height, number of leaves, branches and nodules per plant, increased with increase in P level and the P-control had negative impact on all these parameters as compared to the rest (P treated plots). Ram and Dixit (2001) also found that the application of P at 60 kg ha-1 significantly increased the plant height, branches per plant, leaves per plant and dry matter accumulation as compared to control in green gram. Kumar et al. (2000) revealed that application of phosphorus at the rate of 40 kg ha-1 significantly increased the growth attributes of urd bean, viz., plant height, number of branches, leaves and leaf area plant-1 over preceding levels of phosphorus. Karwasra et al. (2006) reported that application of 50 kg P ha-1 enhanced the plant height and branches plant-1 over control. Shahid et al. (2009) reported that soybean plant height was significantly increased with increasing P application rate. Moreover, Moniruzzaman et al. (2008) noted that plant height of French bean was significantly increased up to 80 kg P ha-1 and then remained constant.
The promotion effect of P fertilization on corn plant height was attributed to better development of root system and nutrient absorption (Hussain et al., 2006). The increase in the number of nodules per plant with application of P over control probably may be due to the increase in the root lengths, number and weight of mung bean with P application. Brady (1984) reported favorable effects of P application on the number and weight of effective nodules on the root system of leguminous crops. Hussain et al. (2014) reported a maximum of 8.67 nodules plant-1 in mung bean which received P along with Rhizobium inoculation under semiarid condition. Gowda and Gowda (1978) reported that mung bean requires P to increase N fixation and to improve the yield and quality of grain. Hussain et al. (2014) reported that application of P increased N uptake in mung bean. Chattopadhyay and Dutta (2003) reported that the number of nodules plant-1 in cowpea increased with increasing level of phosphorus up to 80 kg P ha-1.
Increase in P level increased pods plant-1 and maximum pod plant-1 were obtained with 90 kg P ha-1. However, P control plots produced minimum pods plant-1. Increase in yield components of both crops probably may be due to the availability of more P from the soil had positive impact on the growth (Malik et al., 2002; Amanullah et al., 2014) and thereby produced more yield components. Maqsood et al. (2001) recorded that lowest number of seeds plant-1 was recorded without phosphorus application (0 kg P ha-1) and highest 1000-seed weight was obtained with phosphorus at the rate 75 kg ha-I, while the lowest 1000-seed weight was recorded with no phosphorus application. The findings of Ali (1993) also stated that 1000-seed weight was significantly affected by application of 84 kg P ha-I. The application of phosphate fertilizer at the rate 84 kg ha-1 gave the maximum number of pods plant-1, number of grains pod-1 and 1000-grains weight resulting ultimately in maximum grain yields (Ali et al., 2010).
Kumar and Sharma (2005) studied that increase in level of phosphorus up to 40 kg P2O5 ha-1 significantly increased the number of pods plant-1 and number of seeds pod-1. Moniruzzaman et al. (2008) reported that pod length in French bean was significantly increased as P application rate increased from 0 to 80 kg P2O5 ha-1 and remained relatively constant at higher P rates (120 kg P2O5 ha-1). The results also agree with the findings of Turuko and Mohammed (2014), who reported that the highest pod number plant-1 in common bean was recorded with P rates of 20 kg ha-1. Similarly, Moniruzzaman et al. (2008) reported that the number of pods plant-1 in French bean was increased up to 120 kg P2O5 ha-1 in 2005 to 2006 and up to 80 kg P2O5 ha-1 in 2006 to 2007 growing seasons. This may be due to the fact that P increases flower formation and improves fruit setting. Moshtaght (2015) concluded that total pod yield was significantly increased by 32% when P application rate increased from 0 to 100 kg ha-1. Moniruzzaman et al. (2008) and Srinivas and Naik (1990) reported that significantly the highest pod yield was recorded at 80 kg P2O5 ha-1.
Phosphorus is an essential macronutrient that improves plant growth and yield through the following: (1) P promotes root growth and stimulates lateral root branching that, in turn, increases nutrients absorption from the soil; (2) it plays a vital role in flower formation and fruit setting; (3) it is involved in sugar and starch utilization, photosynthesis, and cell division; (4) it stimulates leaf cell division and elongation, and leaf number, thus increases leaf area index (Assuero et al., 2004; Kavanova et al., 2006), and this improves light interception and photosynthesis and, therefore, increases plant biomass accumulation, and (5) it is a crucial element for nodule formation in legume crop and improves nitrogen fixation (Bhuiyan et al., 2008). Ram and Dixit (2001) reported that phosphorus fertilization at 60 kg P2O5 ha-1 significantly increased the grain yield and pods plant-1 summer green gram in comparison with 20 kg P2O5 ha-1. Singh and Agarwal (2001) found that the number of pods plant-1, pod length, number of grains pod-1, 1000 grains weight and grain yield in black gram increased significantly with increasing levels of phosphorus up to 60 kg P2O5 ha-1.
Increase in P level increased seeds pod-1 and thousand grains weight. Maximum seeds pod-1 and thousand grains weight were recorded with 90 kg ha-1. However, P control plots produced minimum seeds pod-1 and thousand grains weight. These results are in line with that of Malik et al. (2002), who reported that the application of phosphorous at the rate of 50 to 75 kg ha-1 to mung bean crop significantly increase the number of pods plant-1, seeds pod-1 and thousand grains weights. The crop fertilized with phosphorus gave significantly higher seed yield than obtained from control treatment. The differences in seed yield among the different phosphorus levels might be due to their variable effects on seed yield components (Maqsood et al., 2001). Rao et al. (1990) and Singh and Tripathi (1992) concluded that application of 40 to 60 kg P ha-1 increased the seed yield. Ali et al. (2010) reported that phosphate fertilizer showed significant impact on mung crop compared to that in control plots, but the treatment of phosphate fertilizer at the rate of 84 kg ha-1 out yielded rest of the treatments.
Emsley (2000) reported that phosphatic fertilization has increasing influence in relation to growth and yield. Higher yields of mung bean have been reported by application of phosphorous at the rate of 90 kg ha-1 under field conditions (Lange et al., 2007). Sharma et al. (2003) observed significant improvement in seed yield of mung bean and black gram with the successive increase in the phosphorus level up to 60 kg P2O5 ha-1. Kumar and Kushwaha (2006) observed that seed yield and net returns of pigeon pea were increased significantly with phosphorus levels up to 40 kg P2O5 ha-1 as compared to the control. The increase in grain yield with phosphorus application was due to better plant growth and well development of yield contributing parameters. These results are in line with the findings of Malik et al. (2002), who reported that increase in P level increased grain yield. These results are in line with the findings of Ahmad et al. (1992) who also reported an increase in harvest index of mung bean in response to application of P and N. Maqsood et al. (2001) concluded that harvest index in response to phosphorus differed significantly from one another. The harvest index for 75 kg P ha-l was significantly higher from that of 50 kg P ha-1. These results are in conformity with the findings of Sudhakar et al. (1989) who reported that the application of phosphorus increased the harvest index.
Effect of organic sources
Khadem et al. (2010) reported that manure application affects phenological development. Improvement in branches plant-1 of mung bean in farm yard manure amended plots could be attributed to timely and slowly release of nutrient throughout the growing season (Jama et al., 1997). Das (2014) concluded that the number of nodules plant-1 was higher in farm yard manure treated plots in comparison with the other treatments without plant growth-promoting rhizobacteria (PGPR). It might be due to higher microbial activity in the soil by the combined application. Das (2014) concluded that number of pods plant-1 were higher in farm yard manure treated plots. The input of organic matter increases water holding capacity and permeability of the soil (Hussain et al., 2004). Das (2014) observed that higher pod yield (15 q/ha) was found in farm yard manure treated plot. Ramesh et al. (2006) reported that application of cattle dung manure (4 t ha-1) recorded the highest seed yield on pigeon pea.
Combined effect of organic sources and phosphorus
Maximum seeds pod-1 were obtained by the combine effect of phosphorus 90 kg ha-1 in combination with animal manure 10 t ha-1 followed by 60 kg phosphorus ha-1 in mung bean while in mash bean maximum pods plant-1, pod plant-1, pod length and thousand grain weight was observed on 90 kg phosphorus ha-1 along with 10 ton ha-1 animal manure followed by 90 kgha-1 along with crop residue and animal manure 10 tonha-1. In both crops, high grain yield was observed with the combine application of phosphorus and animal manures treated plots; this might be due to timely and slowly release of nutrients from farm yard manure throughout the growing season and might be the possible reason for improving grain yield in farm yard manure amended plots. Biyan (2014) showed that synergistic effect of farm yard manure and chemical fertilizer increased the grain yield. The increase in grain yield was attributed to the increase in pods plant-1. Farm yard manure contained high amounts of organic matter which increased the moisture retention of soil and improved dissolution of nutrients, particularly phosphorus (Singh et al., 2010). Application of farm yard manure and chemical fertilizer significantly increased grain yield of mung bean (Choudhary et al., 2011). Increase in phosphorous levels enhanced harvest index and maximum harvest index was obtained with 90 kg P ha-1 in mash bean while phosphorus 90 kg ha-1 with combination of crop residues and animal manures of 5 ton ha-1 each increase the yield in mung bean.
It was concluded from this research work that integrated use of animal manures (cattle manure) and legume (chickpea) residues (5 t ha-1 each) improved growth and resulted in higher yield and yield components of both mung bean and mash bean over sole application cattle manure and chickpea residues. The higher P levels resulted in earlier phenological development, improved growth, increased number of nodules plant-1, pods plant-1, thousand grains weight, grain and biological yield as well as harvest index of both crops (90 = 60 > 30 > 0 kg P ha-1). Changing the cereal-cereal system (wheat-rice and wheat-maize) to cereal-pulses system (wheat-mung bean or wheat-mash bean) could provide a long-term benefit for resource conservation due to their ability to fix N, withstand drought and their lower dependence on external inputs like fertilizer.
The authors declare that there is no conflict of interest.
REFERENCES
|
Abel S, Ticconi CA, Delatorre CA (2002). Phosphorus sensing in higher plants. Physiol. Plant 115:1-8.
Crossref
|
|
|
|
Afzal MA, Murshad ANM, Bakar MA, Hamid A, Salahuddin ABM (2008). Mungbean Cultivation in Bangladesh, Pulse Research Station, Bangladesh Agricultural Research Institute, Gazipur, Bangladesh.
|
|
|
|
|
AIi A (1993). Effect of different planting methods and phosphorus levels on the performance of Vigna radiate. Pak. J. Agric. Res. 14:162-168.
|
|
|
|
|
Ali MA, Abbas G, Mohy-ud-Din Q, Ullah K, Abbas G, Aslam M (2010). Response of mungbean (Vigna radiata) to phosphatic fertilizer under arid climate. J. Anim. Plant Sci. 20(2):83-86.
|
|
|
|
|
Ahmad N, Masood T, Jamil M, Afzal CM (1992). Response of mungbean to NPK fertilizers under irrigated condition. J. Agric. Res. 30(4):485-488.
|
|
|
|
|
Amanullah (2016). International Year of Pulses 2016. EC Agriculture ECO. 01:05-07.
View
|
|
|
|
|
Amanullah, Khalid S (2016). Integrated use of phosphorus, animal manures and biofertilizers improve maize productivity under semiarid condition. In: Marcelo L. Larramendy and S. Soloneski (ed.) Organic Fertilizers - From Basic Concepts to Applied Outcomes. InTech, Rijeka,
Crossref
|
|
|
|
|
Amanullah, Hidayatullah (2016). Influence of organic and inorganic nitrogen on grain yield and yield components of hybrid rice in Northwestern Pakistan. Rice Sci. 23(6):326-333.
Crossref
|
|
|
|
|
Amanullah IK, Jan A, Jan MT, Khalil SK, Shah Z, Afzal M (2015). Compost and nitrogen management influence productivity of spring maize (Zea mays L.) under deep and conventional tillage systems in Semi-arid regions. Comm. Soil Sci. Plant Anal. 46(12):1566-1578.
Crossref
|
|
|
|
|
Amanullah, Khalid S (2015). Phenology, growth and biomass yield response of maize (Zea mays L.) to integrated use of animal manures and phosphorus application with and without phosphate solubilizing bacteria. J. Microb. Biochem. Technol. 7:439-444.
|
|
|
|
|
Amanullah, Khan A (2015). Phosphorus and compost management influence maize (Zea mays L.) productivity under semiarid condition with and without phosphate solubilizing bacteria. Front. Plant Sci. 6:1-8.
|
|
|
|
|
Amanullah, Majidullah, Imran K (2014). Pheno-morphological traits of mungbean as influenced by phosphorous and tillage under irrigated and un-irrigated conditions. Pure Appl. Biol. 3(2):55-59.
Crossref
|
|
|
|
|
Amanullah, Asif M, Almas LK (2012). Agronomic efficiency and profitability of P-fertilizers applied at different planting densities of maize in Northwest Pakistan. J. Plant Nutr. 35: 331-341.
Crossref
|
|
|
|
|
Assuero SG, Mollier A, Pellerin S (2004). The decrease in growth of phosphorus-deficient maize leaves is related to a lower cell production. Plant, Cell Environ. 27: 887-895.
Crossref
|
|
|
|
|
Bhuiyan MMH, Rahman MM, Afroze F, Sutradhar GNC, Bhuiyan MSI (2008). Effect of phosphorus, molybdenum and rhizobium inoculation on growth and nodulation of mungbean. J. Soil Nat. 2(2):25-30.
|
|
|
|
|
Biyan SC, Dhuppar P, Rao DS (2014). Integrated nutrient management assessment for increased mungbean crop yield. Crop Res. 48 (1-3):38-41.
|
|
|
|
|
Campos-Vega R, Loarca-Pi-a G, Oomah BD (2010). Minor components of pulses and their potential impact on human healthoh. Food Res. Int. 43(2):461-482.
Crossref
|
|
|
|
|
Chattopadhyay A, Dutta D (2003). Response of vegetable cowpea to phosphorus and biofertilizers in old alluvial zone of west Bengal. Legume Res. 26(3):196-199.
|
|
|
|
|
Choudhary HR, Sharma OP, Yadav LR, Choudhary GL (2011). Effect of organic Sources and chemical fertilizers on productivity of mungbean. J. Food Legumes 24:324-26.
|
|
|
|
|
Clemente R, Bernal MP (2006). Fractionation of heavy metals and distribution of organic carbon in two contaminated soils amended with humic substances. Chemosphere 64:1264-1273.
Crossref
|
|
|
|
|
Das I, Pradhan AK, Singh AP (2014). Yield and yield attributing parameters of organically cultivated mungbean as influenced by PGPR and organic manures. J. Crop Weed 10(1):172-174.
|
|
|
|
|
Emsley J (2000). The Shocking History of Phosphorus. London: Macmillan.
View
|
|
|
|
|
FAO (2015). Status of the World's Soil Resources (SWSR). Food and Agriculture Organization of the United Nations, Rome Italy.
|
|
|
|
|
FAO (2016). Soil and Pulses: Symbiosis for Life. Food and Agriculture Organization, Rome.
|
|
|
|
|
Hussain N, Khan AZ, Akbar H, Akhtar S (2006). Growth factors and yield of maize as influenced by phosphorus and potash fertilization. Sarhad J. Agric. 22(4):579-583.
|
|
|
|
|
Hussain N, Abid M, Raza I (2004). Response of wheat (Triticum aestivm L.) to phosphorus in the presence of farmyard manure. Indus. J. Plant Sci. 3:298-302.
|
|
|
|
|
Jama B, Swinkles RA, Buresh RJ (1997). Agronumbermic and econumbermic evaluation of organic and inorganic phosphorus in western Kenya. Agron. J. 89:597-604.
Crossref
|
|
|
|
|
Jan A, Alam K, Amanullah, Stewart BA (2012a). Mungbean response to tillage systems and phosphorus management under moisture stress condition. J. Plant Nutr. 35(1):21-33.
Crossref
|
|
|
|
|
Jan A, Amanullah, Akbar H, Blaser BC (2012b). Chickpea response to tillage systems and phosphorus management under dryland condition. J. Plant Nutr. 35(1):64-70.
Crossref
|
|
|
|
|
Karwasra RS, Kumar Y, Yadav AS (2006). Effect of phosphorus and sulphur on greengram (Phaseolus radiatus). Haryana J. Agron. 22(2):164-165.
|
|
|
|
|
Kavanova´ M, Lattanzi FA, Grimoldi AA, Schnyder H (2006). Phosphorus Deficiency Decreases Cell Division and Elongation in Grass Leaves. Plant Physiol 141:766-775.
Crossref
|
|
|
|
|
Khalil SK, Khan S, Rahman A, Khan AZ, Khalil IH, Amanullah, Wahab S, Mohammad F, Nigar S, Zubair M, Parveen S, Khan A (2010). Seed priming and phosphorus application enhance phenology and dry matter production of wheat. Pak. J. Bot. 42(3):1849-1856.
|
|
|
|
|
Kumar K, Verma AK, Srivastava GP (2000). Yield attributing characters and grain yield of urdbean (Vigna mungo (L.) Hepper) as influenced by levels of phosphate application. J. Res. Birsa Agric. Univ. 12:233-234.
|
|
|
|
|
Kumar K, Goh KM (2004). Crop residues and management practices: Effects on soil quality, soil nitrogen dynamics, crop yields and nitrogen recovery. Adv. Agron. 68:197-317.
Crossref
|
|
|
|
|
Kumar J, Sharma M (2005). Effect of phosphorus and molybdenum on yield and nutrient uptake by chickpea (Cicer arietinum L.). Adv. Plant Sci. 18:869-873.
|
|
|
|
|
Kumar A, Kushwaha HS (2006). Response of pigeonpea to sources and levels of phosphorus under rainfed condition. Indian J. Agron. 51(1):60-62.
|
|
|
|
|
Lange S, Peer S, Tom N (2007). Phosphorus: An easy access to higher yields of pulses. Inorg. Chem. 46:4028.
Crossref
|
|
|
|
|
Malik MA, Hussain S, Warraich EA, Habib A, Ullah S (2002). Effect of seed innoculation and phosphorus application ongrowth, seed yield and quality of mungbean (Vigna radiata L.) CV. NM-98. Int. J. Agric. Biol. 4(4):515-516.
|
|
|
|
|
Malival PL (2001). Agronomy at a glance. Agrotech Publishing Academy, Udaipur. India. pp. 3-15.
|
|
|
|
|
Maqsood M, Hassan M, Hussain MI, Mahmood MT (2001). Effect of different levels of phosphorus on agronomic traits of two mashbean genotypes (Vigna mungo L.). Pale. J. Agri. Set. 38(1-2):81-83.
|
|
|
|
|
Moniruzzaman M, Islam MR, Hassan J (2008). Effect of N P K S Zn and B on yield attributes and yield of french bean in south eastern hilly region of Bangladesh. J. Agric. Rural Dev. 6(1-2):75-82.
Crossref
|
|
|
|
|
Moshtagh S (2015). Effects of Phosphorus Rate and iron foliar application on green bean (Phaseolus vulgaris L.) growth and yield. Agric. Conspec. Sci. 80(3):139-146.
|
|
|
|
|
Muhammad D, Khattak RA (2009). Growth and nutrient concentration of maize in pressmud treated saline-sodic soils. Soil Environ. 28:145-155.
|
|
|
|
|
Raboy V (2003). Molecules of interest: myo-inositol-1, 2, 3, 4, 5, 6-hexakisphosphate. Phytochemistry 64:1033-1043.
Crossref
|
|
|
|
|
Ram SN, Dixit RS (2001). Growth, yield attributing parameters and quality of summer green gram as influenced by dates of sowing and phosphorus. Indian J. Agric. Res. 35:275-277.
|
|
|
|
|
Ramesh P, Singh M, Panwar NR, Singh AB, Ramana S (2006). Response of pigeonpea (Cajanus cajan) varieties to organic manures and their influence on soil fertility and enzyme activity of soil. Indian J. Agric. Sci. 76:252-54.
|
|
|
|
|
Rao KH, Kumari GK, Pillai RN (1990). Effect of phosphate application on nutrient composition and yield of black gram grown on a vertisol. J. Indian Soc. Soil. Sci. 38:546-547.
|
|
|
|
|
Rattanawongsa N (1993). The 19th International mungbean nursery trial. ARC-AVRDC Training Report.
|
|
|
|
|
Sarwar G, Sadiq MS, Saleem M, Abbas G (2004). Selection criteria in F3 and F4 population of mungbean (Vigna radiata L.). P. J. Bot. 36:297-310.
|
|
|
|
|
Shahid MQ, Saleem MF, Khan HZ, Anjum SA (2009). Performance of Soybean (Glycine max L.) under Different Phosphorus Levels and Inoculation. Pak. J. Agric. Sci. 46(4):237-241.
|
|
|
|
|
Sharma S, Upadhyay RG, Sharma CR, Rameshwar (2003). Response of various levels of nitrogen and phosphorus application of growth, physiological parameters and yield of Vigna radiata (L.) Wilczek under rainfed and mid-hill conditions of Himachal Pradesh. Indian J. Agric. Res. 37(1):52-55.
|
|
|
|
|
Shu-Jie M, Yun-Fa Q, Xiao-Zeng H, An M (2007). Nodule formation and development in soybean (Glycine max L.) in response to phosphorus supply in solution culture. Pedosphere 17(1):36-43.
Crossref
|
|
|
|
|
Singh G, Aggrawal N, Khanna V (2010). Integrated nutrient management in lentil with organic manures, chemical fertilizers and biofertilizers. J. Food Legumes 23:149-151.
|
|
|
|
|
Singh RN, Tripathi HP (1992). Effect of irrigation schedules and phosphorus levels on summer blackgram (Vigna mungo L.). Narendra Deva J. Agric. Res. 7:34-40.
|
|
|
|
|
Singh YP, Agarwal RL (2001). Effect of sulphur and phosphorus levels on yield and quality of balckgram. Ann. Plant Soil Res. 3:298-300.
|
|
|
|
|
Srinivas K, Naik LB (1990). Growth, yield and nitrogen uptake in vegetable French bean (Phaseolus vulgaris L.) as influenced by nitrogen and phosphorous fertilization. Haryana J. Hortic. Sci. 19(1-2):160-167.
|
|
|
|
|
Steel RGD, Torrie JH, Dickey D (1996). Principles and procedures of Statistics, McGraw-Hill, NY, USA.
|
|
|
|
|
Sudhakar P, Singh BG, Rao LM (1989). Effect of rhizobium and phosphorus on growth parameters and yield of black gram. Indian J. Agric. Sci. 59:402-404.
|
|
|
|
|
Tang C, Hinsinger PJ, drevon JJ, Jaillerd B (2001). Phosphorus deficiency impairs early nodule functioning and enhance proton release in roots of Medicago truncatula L. Ann. Bot. 88:131-138.
Crossref
|
|
|
|
|
Turuko M, Mohammed A (2014). Effect of Different Phosphorus Fertilizer Rates on Growth, Dry Matter Yield and Yield Components of Common Bean (Phaseolus vulgaris L.). World J. Agric. Res. 2(3):88-92.
Crossref
|
|
|
|
|
Walker DJ, Clemente R, Bernal MP (2004). Contrasting effects of manure and compost on soil pH, heavy metal availability and growth of Chenopodium album L. in a soil contaminated by pyritic mine waste. Chemosphere 57:215-224.
Crossref
|
|
|
|
|
Werner D (2005). Production and biological nitrogen fixation of tropical legumes. In D. Werner & W.E. Newton, eds. Nitrogen fixation in agriculture, forestry, ecology, and the environment, Dordrecht, the Netherlands, Springer pp. 1-13.
Crossref
|
|