Full Length Research Paper

ABSTRACT
Genotype x environment interaction (GEI) and stability of protein content across locations could be helpful in identifying wheat lines with premium quality. The protein contents of 25 selected durum wheat genotypes tested over six environments in 2017 to evaluate genotype by environment interactions and identify stable genotypes for protein content. Protein content was determined based on Mini-infra Smart T Grain Analyzer. The combined analysis of variance indicated that highly significant variations were observed among genotypes, environments and their interactions on grain protein. The largest variation accounted by environments, followed by GEI and then genotypes. The stability analysis using parametric measures identified as G23 the most stable genotype followed by G1 with above average grain protein content of 14.5 and 15.1%. The additive main effects and multiplicative interaction (AMMI) analysis showed that the first two (Interaction Principal Component Axes Scores (IPCAs) explained about 70% of the variations in GEI. Genotype main effect and genotype by Environment Interaction (GGE) biplot analysis categorized the environments in to three mega environments where Akaki and Gimbichu grouped together and that Debre-Zeit light soil and Alemtena with in the second mega environment. The genotypes respond similarly for protein content at Minjar and Debre-Zeit black soil environment.
Key words: AMMI, AMMI Stability Value (ASV), durum wheat, genotype by Environment Interaction (GGE) biplot, protein content, stability.
INTRODUCTION
Durum wheat is among the major cereal crops in Ethiopia cultivated since ancient times due to its wide adaptation to different agro-ecologies. It is primarily suitable for the manufacture of pasta products (Macaroni, Spaghetti, noodles) and it is also used for making bread, “injera” and other local foods and drinks (Tesemma et al., 1998).
Currently, quality has become among the major concern in both durum wheat production and area of research in Ethiopia. Protein content is one of the most important qualities to be considered in durum wheat production. The nutritional value of grain and for influencing the technological property of flour was explained by Blanco et al. (2006). Test weight, 1000 kernel weight and kernel virtuousness are all affected by protein content. Pasta quality is principally determined by protein content and gluten strength. Durum wheat protein usually ranges from 9-18% (Simmonds, 1989). Protein content is highly influenced by genetic and environmental factors (Gashawbeza et. al. 2003; Williams’s et al., 2008, Marina et al., 2018; Graziano et al., 2019). Protein content like other traits in Ethiopia is highly influenced by genetic and environmental factors mainly location. Technological quality and nutritional value of durum wheat depend on both genetic and environmental factors. The negative association of protein content with grain yield has been reported by Blanco et al. (2006); Salvatore et al. (2018); Fatiukha et al. (2019). The challenges of G x E interactions were reported in different crops and has become among the major priorities for the countries like Ethiopia where environmental variations are very high and unpredictable. Study on genotype main effect (G) plus genotype-by-environment (GE) interaction answer a number of questions related to varietal adaptation and stability. Understanding G x E is useful, amongst others for developing different cultivars in different agro- ecologies, effective allocation of resources and for the characterization of genotypes to variable productivity levels (Yau, 1995).
The methods of partitioning G x E interaction into components assignable to each genotype would be useful to breeders. Several parameters are now available for estimating stability of genotypes tested over a range of environments. Additive main effects and multiplicative interaction (AMMI) analysis combines (analysis of variance) ANOVA and Principle Component Analysis (PCA) into a single analysis with both additive and multiplicative parameters (Zobel et al., 1988; Gauch et al., 2008). The data of each trial were analyzed using this model because this model partitions the genotype x environment interaction sum of squares into interaction principal component (IPCA) axes. The AMMI analysis of variance summarizes most of the magnitude of genotype x environment interaction into one or few IPCA. AMMI analysis lacks effectiveness to evaluate test environments and indicate the contribution of genotypes and environment to GEI. On the other hand, the GGE bilplot is superior to AMMI 1 graph in mega environment analysis and genotype evaluation since it explains more on genotypes plus genotypes by environment interaction and has the inter-product property of the biplot (Weikai et al., 2007). Furthermore, other stability parameters proposed by Finlay and Wilkinson (1963) and Eberhart and Russell (1966) use the regression of average genotype yield on an environmental index and deviation from the regression as secondary estimate of stability to evaluate stability of genotypes across environments. The ecovalence stability index of Wricke (1962) and stability variance developed by Shukla (1972) have also been used to measure the contribution of each genotype to G x E interaction. Hence, studies associated to genotype by environment interaction and evaluating genotypes performances across different durum wheat growing environment is important to identify genotypes that shows stable performance. The objectives of this study were to evaluate the genotype, environment and G x E effect and identify stable durum wheat genotypes for protein content.
MATERIALS AND METHODS
Plant materials and experimental management
Twenty five durum wheat breeding lines selected from moisture stress trials including two standard checks (Tesfaye and Alemtena) were used in this study (Table 1). The experiments were conducted in six sites namely; Alemtena (AT), Minjar (MJ), Debre-Zeit sandy soil (DZLS), Debre-Zeit clay soil (DZBS), Akaki (AK) and Chefe- Donsa (CD) (Table 2). These environments are the main multi- location variety testing sites for the national durum wheat improvement program and representative of different durum wheat agro-ecologies of Ethiopia. The experiments were arranged in lattice square design in three replications. The plot size of 2.0 m2 with four rows of 2.5 m length and 0.20 cm spacing between rows were kept at 5 cm. Plant density, planting time and other management practices were used according to specific recommendations made for each location. 100 kg of urea were used half after emergence and the remaining half at tillering and all 100 kg of DAP applied at planting across environments.
Data collection
Data were recorded for Protein content. It was estimated from the whole hand trashed grains of each genotype per replication at each environment. Protein content was determined based on Mini infra Smart T Grain Analyzer (Mini infra Smart T Grain Analyzer Operating Manual, 2013).
Data analysis
Data analysis was carried out using SAS statistical software version 9.0 (SAS, 1989) and was used for analysis of variances of the individual location and the combined data over environments. Homogeneity of variances was also checked following Leven’s test of the SAS statistical procedures before combined analysis of variance over environments. AMMI and GGE biplot was made to graphically evaluate the relationship between environments and genotypes. Stability statistical methods including linear regression (bi) of genotype mean yield on environmental index, the deviation mean square from the regression of Eberhart and Russell (1966), and coefficient of determination (r2) between average yield of each genotype and environmental index were determined using R Gears statistical software. The variance of genotype (S2i) across environments (Lin et al., 1986) and the coefficient of variability (CV) of each genotype (Francis and Kannenberg, 1978; the ecovalence stability index (W2i) developed by Wricke (1962) and stability variance developed by Shukla (1972) were also used to determine stability of genotypes (Tables 1 and 2).


RESULTS AND DISCUSSION
Combined and AMMI Analysis of variances
The analysis of variance for protein content (%) of 25 durum wheat genotypes tested at six environments is given in Table 3. The combined analysis of variance (ANOVA) showed significant variation at 0.01% among genotypes on protein content. Environments and GEI also varied significantly at 0.01% on protein content. This suggested that that there were differential responses among durum wheat genotypes across the test environments and the existence of strong genotypes by environments interactions. Similarly, highly significant variations on wheat genotypes were reported in previous studies (Haile et al., 2007; William et al., 2008; Marina et al., 2018; Graziano et al., 2019; Fatiukha et al., 2019). The partition of total sum of squares revealed that the locations effect explained the largest sources of variations on protein content (81.2%) followed by genotype x environment interactions (13.6%) and genotypes (5.3%). The AMMI analysis showed that four of the five interactions of principal components were significant at (p<0.01) and about 85.5% of the total GEI was explained by the first three IPCAs: IPCA-1 (45.3%), IPCA-2(24.7%) and IPCA-3 (14.6%). This finding was comparable and in agreement with the work of Haile et al. (2007). The remaining two IPCAs explained only 14.4% of the total GEI. The first two principal components (IPCAs) were considered to construct the GGE biplot due to their higher contributions to GEI.

The average location protein content across genotypes varied from 10.2% at Akaki to 16.5% at Alemtena while the average genotype protein content across environments ranged from 12.9% for genotype 8 to 15.1% for genotype G1 (Table 4). Protein content of durum wheat varieties depend on both genetic and environmental factors (Graziano et al., 2019).

All, except G-8 showed higher grain protein content than standard 13% recommended in durum wheat for industrial purpose. The genotypes failed to attain the minimum standard protein content of 13% (Table 4) only at Akaki and Gimbichu, that are characterized by high rain fall and low temperature. The presence of high rainfall associated to low temperature during the growing season at Akaki and Chefe-Donsa could be among the major reasons for low protein content. The finding was supported by Salvatore et al. (2018) who reported that protein content was affected by minimum temperature. The study also showed that the sum of squares of genotypes by environments was more than twice higher than for the genotypes sum of squares suggesting that the existence of variable responses of genotypes across environments on protein contents. This indicated that durum wheat protein quality was highly influenced by environments than genotypes and this conditions limit selection efficiency of genotypes while targeting grain yield alone (Williams et al., 2008).
AMMI stability value (ASV)
The interaction principal component one (IPCA-1) scores and the interaction principal component two (IPCA- 2) scores in the AMMI model are indicators of stability. The genotypes with lower ASV value are considered more stable and genotypes with higher ASV are unstable. According to ASV (Table 5), G-17 was the most stable with ASV value of (0.019) followed by G-6 (0.0.232) and G-23 (0.24). The genotypes G-3(1.41) and G-5(1.35) were the most unstable for grain yield. The stable genotypes (G-17, G-6 andG-23) showed mean grain protein above grand mean (13.96%).
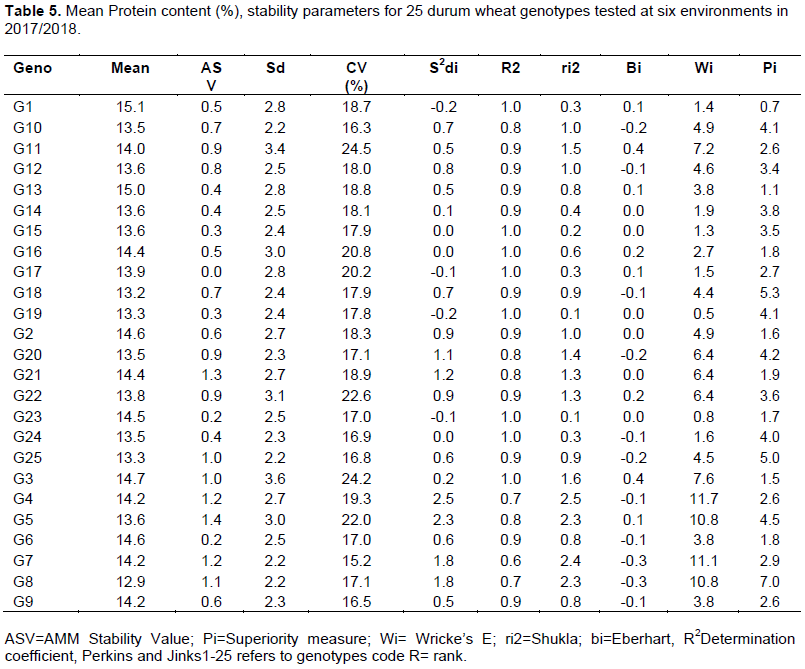
Stability analysis
Estimates of stability parameters should be done when G x E interaction is significant. The mean protein content of each of 25 genotypes and the estimates of different stability parameters are given in Table 5. The regression of average genotype protein content on location index resulted in b1 values of 0.70 to 1.43. According to Eberhart and Russell (1966), ideal genotypes would be one with the highest performance over a wide range of environments, a regression coefficient of one, and deviation mean squares of zero. Genotypes with b1 values greater than one would be adapted to more favorable environments whereas those with b1 values less than one would be adapted to less–favorable environment. Some of the genotypes, for instances, G2, and G21, had mean protein content above the overall mean and the values of b1 were close to unity, suggesting the genotypes performed positively to the testing environments. On the other hand, G5 also had regression coefficient approximately to 1(b1=1.07), but its protein content was below average. Considering the highest b1 and relatively small deviation mean square (S2di), G3 found to be the most responsive and adapted to more favorable environments on protein content. In contrast, G7 with the lowest regression (b1=0.70) were more associated to Akaki and Ginbichu, low responsive than favoring high protein content environment. Coefficient of determination (r2) between average protein content of each genotype and location index were in the range of 0.64-0.98 suggesting small stability differences among genotypes. Accordingly to r2, G1 which showed the highest protein content was the most stable genotypes.
According to, Wrickes’s ecovalence, Shukla, cultivar superiority measures and coefficient of variation a small value indicate high stability of genotype and better genotypes performance (Wricke, 1962). Consequently, in the current study the most stable genotypes would be identified as G19 for Wrickes’s ecovalence and Shukla. G1 and G7 were also identified as stable genotypes based on superiority measures and coefficient of variation, respectively (Table 5).
AMMI Biplot analysis on grain protein content
The genotypes classified as more stable when they are found close to the origin (x and y) in consequence their protein content across environments are similar (Figure 1). The AMMI biplot indicate that G1 gave the highest average grain protein content (15.1%) and had an IPCA- 1value relatively close to zero suggesting that it was stable and widely adapted genotype (Figure 1). Beyond high grain protein content, stability is an important objective for selection of genotypes in any crop breeding program. Hence, G-13 had the lowest IPCA-1 (0.5) and the second top on protein content (14.9%). This was followed by genotype G3, and G16, relatively showed protein content of 14.7 and 14.4% with IPCA-1 of 0.095 and, -0.09 respectively indicating that these genotypes better in their protein with stable performance. Genotypes 17 and 11 were moderately stable with IPCA-1 values of -0.28 and 0.13 compared to the remaining genotypes and found better on grain protein content. These genotypes would be more adapted to specific environments than the other genotypes. On the other hand, Genotypes 25, 8 and 12 were among the lowest in protein content and showed relatively higher IPCA-1 values of –0.42, -0.15 and 0.46 could be considered as both unstable and poor in their grain protein content. Based on the AMMI biplot analysis, the performance of genotypes in each location, for instance, genotypes 16, 3, 23 and 1 had better in their protein concentrations than genotypes 19, 10, 20, and 12 at Debre-Zeit sandy clay soil environment and Alemtena (Figure 1). The environments categorized as similar were Gimbich with Akaki; Debre-Zeit sandy clay soil with Alemtena and Debre-Zeit clay soil with Minjar.

Genotype and genotype by environment interaction (GGE) biplot analysis
GGL biplot of 25 durum wheat genotypes evaluated at six environments are given in Figure 2. In the GGL analysis polygon view of biplot is been used to identify “which wins where” in mega environment trial data analysis. In this study, lines are drawn to connect the furthest genotypes in the biplot and again a line is drawn perpendicular to the other side of the polygon to pass through the origin. The vertex genotypes are the best in performance in the environments included in that sector. Based on the finding of these study six vertex genotypes identified as superior on their protein content compared to the other the genotypes grouped together in each location. According to Yan (2002) vector genotypes has higher yield than the other genotypes which are in the same location. Stable genotypes and environments were found close to the origin with IPCA-1 and IPCA-2 values showed almost zero. Accordingly, G-17 was closer to the origin and their average grain protein content was comparable with mean average protein content of genotypes suggesting that this genotype categorized as the most stable with better protein content and could be considered as for further crop performance evaluations. On the other hand, G5, G1, G8, G21, G20 and G7 were found far from origin indicating that they perform differently across testing environments and could be categorized as unstable genotypes. The GGE biplot grouped the testing environments in to three broad category (mega environments) suggesting that testing the genotypes in limited number of environments resulted in similar findings without losing the precisions of G x E study. Based on this results Akaki with Gimbichu showed IPCAs values very close to the origin indicating that the genotypes consistence performance in maintaining low protein content across these two environments. This study confirmed that durum wheat in areas similar to Gimbich and Akaki where high rainfall with poor soil drainage resulted in poor quality grain production (Gashawbeza et. al. 2003; Haile et al., 2007) and alternative crop management options is required to improve durum quality to meet the manufacturing industry. Similarly, the GGE biplot analysis grouped Alemtena with Debre-Zeit sandy soil and Debre-Zeit clay soil. Debre-Zeit clay soil environment could be used as the most discriminating testing site where as Minjar was lowest as they had long and short vector from the origin respectively.

CONCLUSIONS
The genotype by environment study on durum wheat indicated the existence highly significant variations on environment, genotypes and their interactions on grain protein content. Environment accounted for the majority of the variation followed by GEI. G-1 identified as the most stable genotype followed by G-23 with high grain protein. GGE biplot analysis categorized the environments in to three mega environments where Akaki and Gimbichu grouped together and that of Debre-Zeit light soil and Alemtena in the second mega environment and the genotypes respond similarly for protein content at Minjar and Debre-Zeit black soil environment.
CONFLICT OF INTERESTS
The authors have not declared any conflict of interests.
ACKNOWLEDGMENTS
The authors appreciate the Ethiopian Institute of Agricultural Research (EIAR), and Agricultural Growth Program II, (AGP II) for the execution of the field and laboratory data generation. Authors also appreciate the International Center for Agricultural Research Institute (ICARDA) for providing technical and partial financial support and also appreciate the support provided by Wondo-Genet Research Center and Debre-Zeit Research Center. Research and technical staff members of the crop research process of Debre-Zeit Research Center are highly appreciated for assisting us on field activities.
REFERENCES
|
Blanco A, Simeone R, Gadaleta A (2006). Detection of QTLs for grain protein content in durum wheat. Theoretical and Applied Genetics 112(7):1195-1204. |
|
|
Eberhart SA, Russell WA (1966). Stability Parameters for Comparing Varieties. Crop Science 6(1):36-40. |
|
|
Fatiukha AL, Lupo GL, Klymiuk V, Korol AB, Pozniak C, Fahima T, Krugman T (2019). Grain Protein Content QTLs Identified in a Durum x Wild Emmer Wheat Mapping Population Tested in Five Environments. BioRxiv, 601773. Doi: |
|
|
Finlay KW, Wilkinson GN (1963). The Analysis of Adaptation In Plant Breeding Program. Australian Journal of Agricultural Research 14(6):742-754. |
|
|
Francis TR, Kannenberg LW (1978). Yield Stability Studies in Short Season Maize. I Descriptive Method for Grouping Genotypes. Canadian Journal of plant Science 58(4):1029-1034. |
|
|
Gashawbeza B, Yaekob A, Zemede A, Kifetew J, Tadese T, Mekuria B (2003). Fertilizer N Effects on Yield and Grain Quality of Wheat. Tropical Agriculture 80:164-151. |
|
|
Gauch H, Piepho G, Annicchiaricoc P (2008). Statistical Analysis of Yield Trials by AMMI and GGE. Crop Science 48(3):866-889. |
|
|
Haile J, Serial AK, Solomon A (2007). AMMI Analysis for Stability and locations effect on Grain Protein Content of Durum Wheat Genotypes. Cereal Research Communications 33(4):1661-1673. |
|
|
Graziano S, Marando S, Prandi B (2019). Technological quality and nutritional value of two durum wheat varieties depend on both genetic and environmental factors. Journal of Agricultural and Food Chemistry 67(8):2384-2395. |
|
|
Lin CS, Binnsand MR, Lefkovitch LP (1986). Stability Analysis: Where Do We Stand? Crop Science 26(5):894-900. |
|
|
Marina MF, Costantino CP, Francesco G (2018). From Ancient to Old and Modern Durum Wheat Varieties: Interaction among Cultivar Traits, Management and Technological Quality. Journal of the Science of Food and Agriculture 99(5):2059-2067. |
|
|
Salvatore LC, Emanuele S, Giorgio T, Cristina P, Umberto A, Danilo S (2018). Does post-anthesis heat stress affect plant phenolgy, physiology, grain yield and grain protein content of durum wheat in semi-arid Mediterranean environment? Journal of Agronomy 205(3):309-323. |
|
|
SAS Institute Inc. (1989). SAS/STAT user's guide, Version 6 Cary, NC. |
|
|
Simmonds DH (1989). Inherent quality factors in wheat. Wheat and Wheat Quality in Australia, CSIRO pp. 31-61. |
|
|
Shukla GK (1972). Some Statistical Aspects of Partitioning Genotype x Environment Components of Variability. Heredity 29(2):237-245. |
|
|
Tesemma T, Tsegaye S, Belay G, Bechere E, Mitiku D (1998). Stability of Performance of Wheat landraces in Ethiopian Highland. Euphytica 102(3):301-308. |
|
|
Weikai Y, Manjit S, Kang B, Sheila W, Cornelius PL (2007). GGE Biplot vs. AMMI Analysis of Genotype-by- Environment Data. Crop Science 47(2):641-653. |
|
|
Williams RM, O'Brien DL, Eagles HA, Solah VA, Jayasena V (2008). The Influences of Genotype, Environment and Genotype by Environment Interaction on Wheat Quality. Australian Journal of Agricultural Research 59(2):95-111. |
|
|
Wricke G (1962). Evaluation Method for Recording Ecological Differences in Field Trials. Z Pflanzenzücht 47(1):92-96. |
|
|
Yan W (2002). Singular Value Partitioning In Biplot Analysis of Multi- environment Trial Data. Agronomy Journal 94(4):990-996. |
|
|
Yau SK (1995). Regression and AMMI Analyses of Genotype × Environment Interactions: an Empirical Comparison. Agronomy Journal 87(1):121-126. |
|
|
Zobel RW, Wright MJ, Gauch HG (1988). Statistical Analysis of a Yield Trial. Agronomy Journal 80(3):388-393. |
|
Copyright © 2024 Author(s) retain the copyright of this article.
This article is published under the terms of the Creative Commons Attribution License 4.0


