Full Length Research Paper

ABSTRACT
Coffee Berry Disease (CBD) is a major constraint that limits Coffea arabica production, whose resistance is governed by three genes, T, R that are dominant and recessive k in varieties Hibrido de Timor (HDT), Rume Sudan (RS) and K7 respectively. This study identified the genomic region occupied by R-gene using F2 genotypes from varieties RS and SL28; and Single Nucleotide Polymorphic (SNP) markers obtained through Genotyping by Sequencing. Redundant markers were removed and 699 markers obtained for linkage mapping and quantitative trait loci (QTL) analysis. The Linkage map spread over 5525.39 cM across eleven coffee chromosomes (Chr). The QTL was analyzed by both Interval Mapping (IM) and Inclusive Composite Interval Mapping (ICIM) using SNP markers and CBD resistance mean scores of the F2 genotypes and their parents. Three QTLs, qCBD 1-1 in Chr 1, qCBD 2-1 and qCBD 2-2 in Chr 2 were significantly associated with CBD resistance, detected by both IM and ICIM at LOD ≥ 2.5 (P≤0.05). Two flanking markers that were closer to the three QTLs; 100025973|F|0-59:T>C-59:T>C at a distance of 3 centi Morgans (cM) from qCBD 1-1 and 100034991|F|0-44:C>T-44:C>T, that was flanking in both qCBD 2-1 and qCBD 2-2 at 12.5 cM, whose SNPs were significant (P≤0.05), are recommended for validation and use in marker-assisted breeding.
Key words: Coffee berry disease, linkage map, quantitative trait loci, genotyping by sequencing, single nucleotide polymorphism, SL 28, R-gene.
INTRODUCTION
Coffee Berry Disease (CBD) is caused by the fungal pathogen Colletotrichum kahawae Waller & Bridge (Waller et al., 1993) and is a major constraint to Coffea arabica L. production in African countries with a possibility of occurrence in other coffee-growing countries in the world (Van Der Vossen et al., 2015). CBD epidemics destroy 50-80% of susceptible Arabica coffee varieties during prolonged wet and cool weather conditions (Hindorf and Omondi, 2011) if no control is applied. The preventive control of CBD using programmed fungicide sprays increases production cost by 30-40% and contributes to environmental pollution (Gichuru et al., 2008); and therefore, the need for resistant varieties as the best alternative approach in the management of this disease.
C. arabica L. is a simple tetraploid (2n = 4x = 44) and the only tetraploid species of coffee, formed out of two diploids species, Coffea canephora and Coffea eugenioides (Lashermes et al., 2011). This species is genetically less diverse in comparison to its parental diploid species (Baruah et al., 2003), a situation that has been associated with its susceptibility to diseases (Prakash et al., 2002) and hinders molecular breeding tools development for the breeding process (Sant’Ana et al., 2018). The first case of CBD was reported in 1922, in coffee plantations on the slope of Mt Elgon in Western Kenya (McDonald, 1926), from where it spread to other Arabica coffee producing countries in Africa (Hindorf and Omondi, 2011). Studies on the source and selection for resistance to CBD date back to 1974 (Robinson, 1976) but significant breakthrough on selection was on the discovery of the hypocotyl inoculation test on six-week-old seedlings. This revealed that the mechanism of CBD resistance in the field conditions was similar to the reaction of CBD inoculum in the hypocotyl of a six-week-old seedling (Van Der Vossen et al., 1976).
Initial studies on the inheritance of CBD resistance indicated a continuous variation in a naturally occurring heterozygous population, leading to the belief that CBD resistance is polygenic (Van Der Graaff, 1978). However, this belief was dismissed by the study of Van der Vossen and Walyaro (1980). The study revealed that there are only three genes that confer resistance to CBD in C. arabica. These genes are the R-gene in the variety Rume Sudan, T-gene in HDT and a recessive k-gene found in both K7 and Rume Sudan. The T and R genes are dominant while the k gene is recessive and only confers partial resistance to CBD in a homozygous state. The R-locus has multiple alleles (R1R1) in Rume Sudan and R2R2 that are less effective in Pretoria (Van der Vossen and Walyaro, 1980; Hindorf and Omondi, 2011).
The development of a new coffee variety takes more than 25 years due to the perennial nature of this crop. This period can be reduced drastically by using marker-assisted selection (MAS) and hence the need to identify markers associated with the traits of interest in coffee (Moncada et al., 2016). Genetic resistance to CBD has been characterized by various studies in Kenya. The locus for the T-gene was mapped by Agwanda et al. (1997) using Random Amplified Polymorphic DNA (RAPD) markers. The same locus was identified by Gichuru et al. (2008) using Simple Sequence Repeats (SSR) markers and Amplified Fragment Length Polymorphisms (AFLP) markers and christened it as Ck-1. Similarly, detection and mapping of the R- gene in Rume Sudan is desirable and believed to be realized through QTL mapping using Genotyping-by-Sequencing (GBS) based single nucleotide polymorphism (SNP) markers.
GBS is a powerful, cost-effective method for identifying single-nucleotide polymorphisms (SNPs) on a whole-genome scale. This technique encompasses reduced representation genome sequencing based on partial restriction enzyme digestion, usually with a methylation-sensitive restriction enzyme, followed by barcoded adaptor ligation and next-generation sequencing of highly multiplexed samples, usually 96, samples per lane (Elshire et al., 2011; Vining et al., 2017). The Diversity Array Technology Pty Ltd (DArT, Canberra, ACT, Australia), was developed as a cost-effective sequence-independent ultra-high-throughput marker system. The DArT develops markers through a microarray hybridization method that produces a thousand of polymorphic loci in a single assay (Alam et al., 2018). Various studies have utilized DArT- GBS based SNP markers in coffee (Moncada et al., 2016; Garavito et al., 2016; Sant’Ana et al., 2018). The process of quantitative trait loci (QTL) mapping is useful in the detection of genes that could either have positives, negatives or both effects on the trait of interest. It helps in identifying genomic regions conveying disease resistance in bi-parental populations (Sant’Ana et al., 2018). This process leads to the identification of linked molecular markers that may be used for gene pyramiding in the breeding process for durable resistance to diseases (Kthiri et al., 2019). This study aims to identify the genetic region for R-gene that confers resistance to CBD in Coffea arabica variety Rume Sudan through bi-parental QTL mapping using GBS-based SNP markers.
MATERIALS AND METHODS
Phenotypic and population structure analysis of the mapping genotypes
The study materials comprised 108 Coffea arabica genotypes including 106 F2 genotypes and their parents, Rume Sudan and SL28 maintained at Coffee Research Institute of the Kenya Agricultural and Livestock Research Organization (KALRO-CRI) in Ruiru, Kenya. Ruiru is located within the upper midland (UM2) at 10 06'S and 360 45'E and an altitude of 1620 m above sea level (Jaetzold et al., 2006). Rume Sudan is a Coffea arabica landrace (Scalabrin et al., 2020) with the R gene in the R locus that confers resistance to CBD (Van Der Vossen and Walyaro, 1980); while SL28 is a commercial Kenyan cultivar that is high yielding and of excellent cup quality but highly susceptible to CBD. The F2 individuals were obtained by crossing the parents and subsequent selfing of their F1 generation. The F2 genotypes were classified their resistance to CBD based on their F3 progenies using hypocotyl inoculation method on a standard scale of 1 – 12 of Van der Vossen et al. (1976). The population structure analysis of the study genotypes was carried out by Principal Component Analysis (PCA) based on marker data using the PCA-clustering functionality tool within the KDCompute plugin system (https://kdcompute.igss-africa.org/kdcompute/plugins).
Genotyping of SNP markers
Genomic DNA samples were extracted from fresh leaves of each of the 108 genotypes using a standard cetyltrimethylammonium Bromide (CTAB) protocol of Doyle and Doyle (1987). The quality and quantity of the DNA samples were evaluated through a Spectrophotometer (Specgene, UK; at 260/280 nanometers) and by running it through 0.8% agarose gel electrophoresis. The DNA concentration was adjusted to 50 ηg/μl. The genomic DNA samples were sent to Diversity Arrays Technology (DArT) Pty Ltd, in Canberra-Australia (http://www.diversityarrays.com) for sequencing and identification of SNP markers. The GBS was performed as described by Elshire et al. (2011). The genomic DNA was digested with methylation-sensitive restriction enzyme. This type of enzyme was chosen due to its partial sensitivity to DNA methylation, thus avoiding repetitive element regions and frequency of DNA cutting (Elshire et al., 2011; Brito et al., 2017). After digestion, the DNA was ligated to adapters and then combined into pools of 96 samples and amplified with primers compatible with the adapter sequences (Camacho et al., 2019). After polymerase chain reaction (PCR), the pooled products were purified and quantified for sequencing on the Illumina HiSeq 2500 flow cell (Illumina platform) (Elshire et al., 2011; Akohoue et al., 2020).
The SNP calling was carried out by DArT-soft14 algorithm within the KDCompute pipeline developed by Diversity Arrays Technology (http://www.kddart.org/kdcompute.html). In the primary pipeline, the FASTQ files were first processed to filter poor quality sequences to ensure that the assignments of the sequences to specific samples carried in the barcode split region were consistent and reliable (Barilli et al., 2018; Li et al., 2018; Nemli et al., 2017). The identical sequences were collapsed into FASTQ call files that were used in the secondary pipeline for DArT P/L’s proprietary SNPs calling algorithms (DArT-soft14) pipeline in the processing of the sequence data (Barilli et al., 2018). Since open access genome assembly with reliable sorting of homologous sequences for C. Arabica is not yet available (Scalabrin et al., 2020), the filtered sequence reads were aligned against the C. canephora reference genome (http://coffee-genome.org/coffeacanephora) to determine the corresponding genomic positions.
The genetic linkage map construction
The high-density linkage map for the Rume Sudan x SL28 F2 populations and their parents was carried out using QTL IciMapping version 4.2 (http://www.isbreeding.net/). Before the map was constructed, redundant SNP markers were removed using the BIN functionality tool, implemented within the QTL IciMapping software (Meng et al., 2015). The obtained markers after binning were used in the construction of genetic linkage maps using the MAP functionality tool within the software. The map function was by stepwise regression to select the most significant markers and a likelihood ratio test to calculate the logarithm of odds (LOD) scores for each marker by a criterion of > 2.5 LOD and a maximum distance of 30 cM between two loci. Three steps were involved in building a linkage map: grouping, ordering, and rippling. The grouping was carried out with a LOD score > 2.5 that was used to declare the linkage relationship between two markers such that markers with LOD higher than the threshold were grouped. The Recombination Counting and ORDering (RECORD) algorithm was used for ordering markers while rippling was by the sum of adjacent recombination fractions (SARF) to confirm the marker order (Meng et al., 2015; Sitonik et al., 2019, Awata et al., 2020). The recombination fraction between two linked loci was used to sort the markers with the Kosambi mapping function (Kosambi, 1943) in centi Morgans (cM).
Analysis of the QTL for resistance to CBD
The SNPs markers obtained from BIN together with the phenotypic scores of CBD infection of the F2 genotypes that had strong parental relationships and their parents were used in QTL analysis using the QTL functionality of the QTL Ici-Mapping software v4.2 (Meng et al., 2015). The conventional Interval Mapping for additive QTL (IM-ADD) and inclusive composite interval mapping for additive QTL (ICIM-ADD) methods was adopted in QTL analysis. The QTL Ici-Mapping software carries out QTL analysis by incorporating additive genetic effects (Zhang et al., 2008; Meng et al., 2015). The LOD value of ≥ 2.5 with a window scan step of 1 cM and 1000 permutation test was used as the threshold to declare the significance of the QTLs defined at P≤0.05 (Kim and Reinke., 2019; Awata et al., 2020). Stepwise regression was adopted to determine the percentages of phenotypic variance explained (PVE%) by individual QTL, additive and dominance effects at LOD peaks (Awata et al., 2020). In the QTL naming, the letter “q” indicates QTL followed by the abbreviation of the trait name (CBD), the chromosome and lastly the marker position.
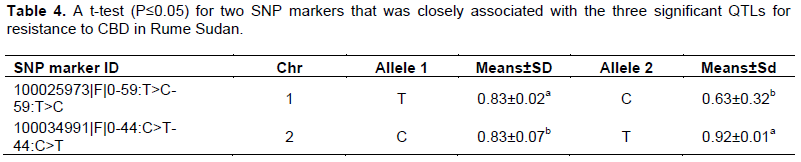
The markers that were closely linked with the significant QTLs were statistically tested using the scores of their alleles, where the alleles with significant differences (P≤0.05) by t-test were confirmed as significant SNP markers (Xiong et al., 2019; Tsai et al., 2020).
RESULTS
Phenotypic and SNP marker data analysis
The GBS based Diversity Arrays sequencing (DArTseq) generated 1635 SNPs markers from the F2 genotypes and their parents. After filtering, 1170 SNP markers were anchored to the 11 coffee chromosomes that were utilized for further analysis in the study. The phenotypic data analysis is described in a recent study by Gimase et al. (2019). The PCA clustering analysis of 108 genotypes revealed three main clusters: A, B and C (Figure 1). The “A” genotypes clustered with SL 28, “B‟ with Rume Sudan while “C‟ was not grouped with any of the two parents.
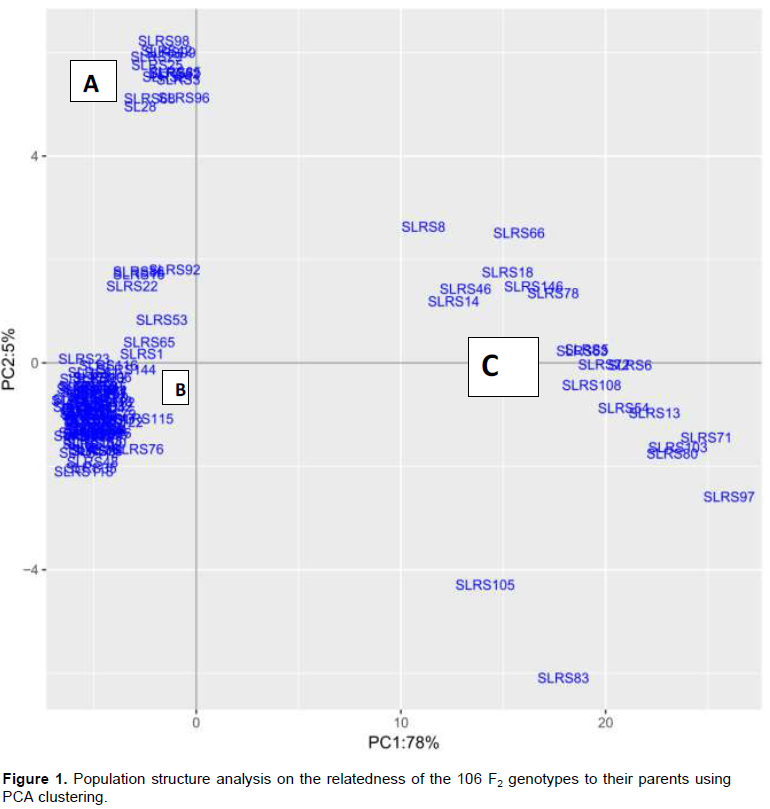
The “C‟ cluster comprising 20 genotypes that portrayed a weak relationship with the rest eliminated to obtain 88 genotypes that were used in QTL analysis. The first principal component (PC1) was the most important, which accounted for 78% of the total variation (Figure 1).
Genetic linkage map construction
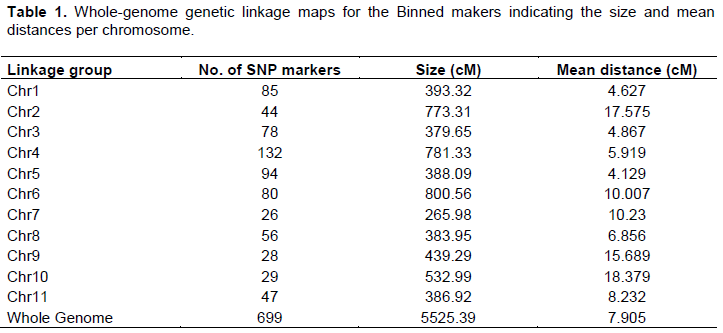
After binning of the 1170 DArT-Seq SNP markers, 471 markers were highly correlated and therefore removed. A total of 699 high-quality SNP markers were obtained and used in the construction of the linkage map. The 699 SNP markers were spread over 5525.39 cM across eleven genetic linkage groups (LG), equivalent to coffee chromosomes with an average marker distance of 7.904 cM and a maximum interval size of 18.378 cM (Table 1). The highest genetic distance was recorded on chr 6 at 800.56 cM while the lowest was at chr 7 at 265.98 cM. The highest mean distance between two markers was in chr 10 at 18.378cM while the lowest was in chr 5 at 4.128cM. The highest numbers of markers were on chr 4 (132) while the lowest number was on chr 7 (26) (Table 1).
QTL analysis
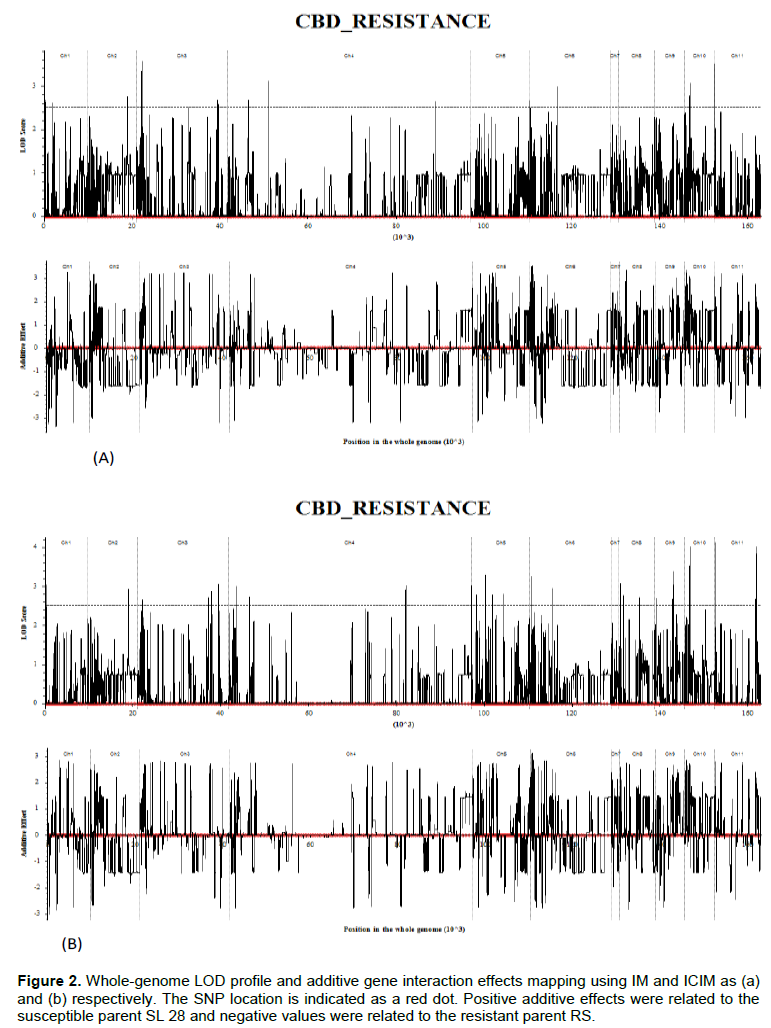
Significant QTLs for CBD resistance were detected by both the conventional Interval Mapping for additive QTL (IM-ADD) and inclusive composite interval mapping for additive QTL (ICIM-ADD) based on LOD threshold value ≥ 2.5 defined at P≤0.05. The IM-ADD detected a total of 19 QTLs at LOD ≥ 2.5 (Figure 2a) that accounted for 56.5% of the total phenotypic variation explained (PVE) by the model. Out of the 19 QTLs, only four QTLs had an admixture of negative additive and dominance effect (Table 2). The three were qCBD 1-1 in Chromosome 1 and qCBD 2-1, qCBD 2-2 in chromosome 2. Similar to IM-ADD, ICIM-ADD detected a total of 41 QTLs at LOD ≥2.5 (Figure 2b) that explained 65% of the total PVE. Out of the 41 QTLs, only five had an admixture of negative additive and dominance effects (Table 3). The individual percentage PVE by the QTLs ranged from 0.8-3.95% for IM and 0.7-2.1 for ICIM.
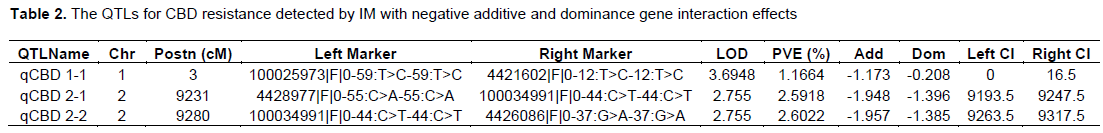
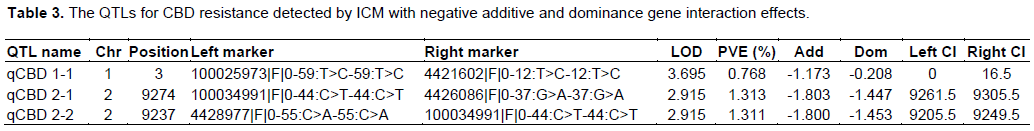
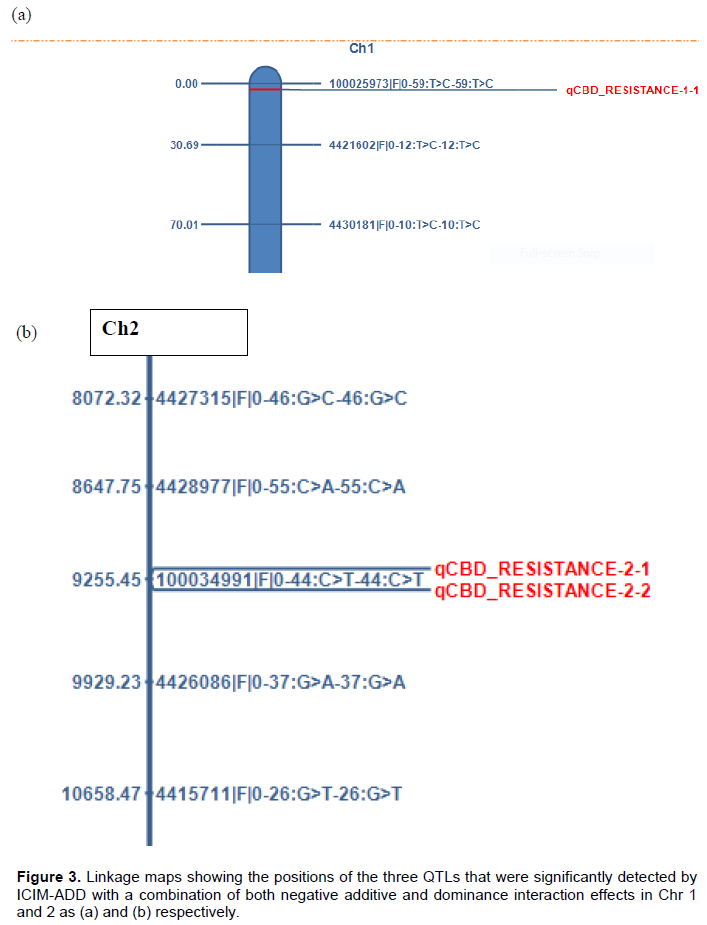
Three QTLs, qCBD 1-1, in Chr 1 and qCBD 2-1, qCBD 2-2 in Chr 2 were detected by both IM-ADD and ICIM-ADD with similar flanking markers/quantitative trait nucleotides(QTNs), where 100025973|F|0-59:T>C-59:T>C and 4421602|F|0-12:T>C-12:T>C were left and right flanking markers for qCBD 1-1 (Figure 3A). The SNP markers 4428977|F|0-55:C>A-55:C>A and 100034991|F|0-44:C>T-44:C>T were flanking as left and right marker in qCBD 2-1 while in qCBD 2-2, 100034991|F|0-44:C>T-44:C>T and 4426086|F|0-37:G>A-37:G>A were flanked as left and right marker respectively (Figure 3b). For the two QTLs in Chr 2, the SNP marker ID 100034991|F|0-44:C>T-44:C>T was flanking as either left or right in qCBD 2-1 and qCBD 2-2 respectively. The three QTLs accounted for 6.4% PVE and 3.4% PVE in IM and ICIM analysis respectively.
The left and right flanking marker for qCBD 1-1 (Figure 3a), was at a distance of 3 cM and 13.5 cM from the QTL in both IM and ICIM analysis (Tables 2 and 3) while in qCBD 2-1 and qCBD 2-2, the SNP marker 100034991|F|0-44:C>T-44:C>T was flanked as left and right marker respectively (Figure 3b), at a distance of 16.5 and 12.5 cM in IM and ICIM respectively while the other flanking markers were at a distance of 37.5 and 31.5 cM for both loci in IM and ICIM respectively (Tables 2 and 3). Two markers, 100025973|F|0-59:T>C-59:T>C and 100034991|F|0-44:C>T-44:C>T in chr 1 and 2 respectively, were very close to the three significant QTLs. The statistical t-test analysis of the two markers revealed significant differences (P≤0.05) in their allelic means (Table 4).
DISCUSSION
The phenotypic variation among the 106 F2 genotypes with their parents and inheritance segregation ratio of the gene for resistance to CBD was reported in an earlier publication (Gimase et al., 2019). Evaluation of population structure on the relatedness of the 106 F2 genotypes and their parents using the PCA revealed that a total of 20 F2 genotypes were weakly related with the rest of the genotypes and were therefore excluded from QTL analysis. The analysis of population structure reduces type I error during association mapping (Camacho et al., 2019). The mapping population was confirmed as a suitable population for genetic mapping of a dominant gene-based and Chi-Square test based on 3:1 Mendelian ratio of segregation (Gimase et al., 2019).
This study generated a genetic linkage map from 699 SNP markers spreading over 5525.39 cM across eleven genetic linkage groups (LG), with an average marker distance of 7.904 cM at maximum interval size of 18.378 cM. Although saturated genetic linkage maps of C. arabica are useful for mapping resistance genes and identification of markers linked to those genes, they are not widely available due to low molecular polymorphism and the polyploidy nature of this species (Pestana et al., 2015). Despite this constraint, several studies attempted to generate these types of maps for Arabica coffee. Pestana et al. (2015) used fewer makers (111) to construct a relatively smaller linkage map with a total length of 976.8 cM. The LG size ranged from 18.4 cM (LG 12) to 234.6 cM (LG 1) with a distance between two adjacent markers varying from 0 cM to 29.4 cM, with the average distance of 9.9 cM; while the mean distance between markers within each linkage group varied from 5.3 cM (LG 5) to 20.1 cM (LG 10). Moncada et al. (2016) constructed a relatively advanced linkage map using 848 (both SSR and SNP) markers that represented all 22 C. arabica linkage groups with a total map length of 3840 cM. The average distance was 4.52 cM between markers and a maximum interval size of 35 cM, where the length of each linkage group ranged from 535.9 cM for LG 1 to 22.7 cM for LG 22 and the number of markers ranged from 129 markers on LG 1 to 8 markers on LG 22. The linkage map in this study equally forms a basis for future research studies on C. arabica since it consists of sequence-based SNPs that can be widely used by the research community (Moncada et al., 2016). Both conventional interval mapping (IM) and Inclusive composite interval mapping (ICIM) were used in this study for QTL analysis. The ICIM is an effective two-step statistical approach that allows separation of co-factor selection from the interval mapping process, to control the background effects and improve the mapping of QTL with additive effects (Horn et al., 2015; Awata et al 2020). ICIM has a proportion of lower False Discovery rate (FDR) than composite interval mapping (CIM).
Three QTLs, qCBD 1-1, qCBD 2-1 and qCBD 2-2 were detected by both IM and ICIM. The qCBD 1-1, detected by both IM-ADD and ICIM-ADD had a LOD score of 3.69 with similar flanking markers,100025973|F|0-59:T>C-59:T>C and 4421602|F|0-12:T>C-12:T>C as left and right flanking markers respectively. This locus was right at the beginning of coffee Chromosome 1, where the left flanking marker was at 0 cM; while the right marker was at 16.5 cM. The QTLs, qCBD 2-1 and qCBD 2-2 detected by ICIM in Chr 2 were similar to two QTLs, detected by IM, with same flanking markers at LOD score 2.8 and 2.9 in IM and ICIM respectively. The SNP marker, 100034991|F|0-44:C>T-44:C>T was flanked in both QTLs, as either left and right respectively. These QTLs were placed towards the end of the second linkage group. All the three QTLs had negative additive and dominance effects implying that the additive-by-additive and dominance-by-dominance interaction effects between the flanking markers for each QTL (Zhang et al., 2008) was acting against the trait that is, reducing CBD infection in the host genotypes (Horn et al., 2015; Kim and Reinke, 2019). Although the PVE% cumulatively by the QTLs was high, the individual score was low. This is attributed to the high number of the significant loci detected by the model (Curtolo et al., 2017) and the small size of the mapping population that was utilized in QTL analysis (Zhang et al., 2008).
The flanking markers for qCBD 2-1 and qCBD 2-2 revealed polymorphic occurrence (presence/ absence of allele) within the parental genotypes; therefore best suited to diagnostic marker design for MAS (Rouet et al., 2019). Abundance and polymorphic occurrence are some of the features for an ideal marker for MAS (Babu et al., 2004). Two SNP markers were closer to the three QTLs where the SNP marker 100025973|F|0-59:T>C-59:T>C was flanked as left marker for qCBD 1-1 at a distance of 3 cM; while 100034991|F|0-44:C>T-44:C>T was flanked in qCBD 2-1 and qCBD 2-2 as either left and right respectively at a distance of 12.5 cM in ICIM. The genetic variation between the alleles of this markers was significantly different (P≤0.05) based on t-test analysis, confirming further that the SNPs were significant. In a related study, Xiong et al. (2019) used a t-test to confirm significant SNP involved in resistance to low nitrogen traits in wheat mutant population; while Zhou et al. (2018) used a t-test to declare SNP significantly associated with plant height (P≤0.05) in maize.
Previous work by Van der Vossen and Walyaro (1980) on the inheritance of CBD resistance based on F2 progenies of 11 C. arabica varieties with different levels of resistance revealed that the variety, Rume Sudan carries two genes for resistance to CBD. The dominant R- gene has multiple alleles occurring as R1R1 and recessive k gene. The study further reported that Rume Sudan transmits high levels of resistance to CBD that was indicated by a high negative General Combining Ability (GCA) effects. In this study, three QTLs significantly associated with CBD resistance, with a combination of both negative additive and dominance gene interactions against CBD infection. The three QTLs are synonymous to the R gene associated with resistance to CBD in C. arabica variety Rume Sudan as described in the previous studies.
CONCLUSION
Coffee Berry Disease remains a limiting factor in the production of Arabica coffee in Africa with the possibility of occurring in other Arabica coffee-growing countries globally. Breeding for resistance to diseases takes up to 30 years, a period that can be reduced significantly by Marker-Assisted selection (MAS). This study identified three genetic regions, one in coffee pseudo-chromosome 1 and two in pseudo-chromosome 2 that are associated with CBD resistance in C. arabica variety Rume Sudan. The study further revealed that two SNP markers were closer to the three QTLs where the SNP marker 100025973|F|0-59:T>C-59:T>C was flanking as left marker for qCBD 1-1 at a distance of 3 cM; while 100034991|F|0-44:C>T-44:C>T was flanking in qCBD 2-1 and qCBD 2-2 as either left and right marker respectively at a distance of 12.5 cM. The SNPs of these markers were significant following a t-test analysis (P≤0.05). These SNPs are likely to co-segregate with the three loci and are identified as candidate DNA markers for the R-gene conferring resistance to CBD in Rume Sudan and recommended for validation and adoption as diagnostic markers in marker-assisted breeding.
CONFLICT OF INTERESTS
The authors have not declared any conflict of interests.
ACKNOWLEDGEMENT
This work was jointly supported by KALRO-CRI, International Livestock Research Institute (ILRI). and National Research Fund. The authors thank the Director General, KALRO (through the Institute Director, CRI), the Director General ILRI and the CEO, National Research Fund. This work is published with permission of the Institute Director, CRI.
REFERENCES
|
Agwanda CO, Lashermes P, Trouslot P, Combes MC, Charrier A (1997). Identification of RAPD markers for resistance to coffee berry disease, Colletotrichum kahawae, in arabica coffee. Euphytica 97:241-248. |
|
|
Akohoue F, Achigan-Dako EG, Sneller C, Van Deynze A, Sibiya J (2020). Genetic diversity, SNP-trait associations and genomic selection accuracy in a west African collection of Kersting's groundnut [Macrotyloma geocarpum (Harms) Mare'chal & Baudet]. PLoS ONE 15(6):e0234769 |
|
|
Alam M, Neal J, O'Connor K, Kilian A, Topp B (2018). Ultra-high-throughput DArTseq-based silicoDArT and SNP markers for genomic studies in macadamia. PLoS ONE 13(8):e0203465. |
|
|
Awata LAO, Beyene Y, Gowda M, Suresh LM, Jumbo MB, Tongoona P, Danquah E, Ifie BE, Marchelo-Dragga PW, Olsen M, Ogugo V, Mugo S, Prasanna BM (2020). Genetic Analysis of QTL for Resistance to Maize Lethal Necrosis in Multiple Mapping Populations. Genes 11(1):32. |
|
|
Babu MM, Luscombe NM, Aravind L, Gerstein M, Teichmann SA (2004). Structure and evolution of transcriptional regulatory networks. Current Opinion in Structural Biology 14(3):283-291. |
|
|
Baruah A, Naik V, Hendre PS, Rajkumar P, Aggarwal RK (2003). Isolation and characterization of nine microsatellite markers from Coffea arabica L. showing wide cross-species amplification. Molecular Ecology Notes 3:647-650. |
|
|
Barilli E, Cobos MJ, Carrillo E, Kilian A, Carling J, Rubiales D (2018). A High-Density Integrated DArTseq SNP-Based Genetic Map of Pisum fulvum and Identification of QTLs Controlling Rust Resistance. Frontiers in Plant Science 9:167. |
|
|
Brito AC, Oliveira AS, Oliveira EJ (2017). Genome-wide association study for resistance to cassava root rot. Journal of Agricultural Science 155:1424-1441. |
|
|
Camacho LFS, Coan MMD, Scapim CA, Pinto RJB, Tessmann DJ, Contrerasâ€Soto RI (2019). A genomeâ€wide association study for partial resistance to southern corn rust in tropical maize. Wiley- Plant Breeding. |
|
|
Curtolo M, Cristofani-Yaly M, Gazaffi R, Takita MA, Figueira A, Machado MA (2017). QTL mapping for fruit quality in Citrus using DArTseq markers. BMC Genomics 18:289. DOI 10.1186/s12864-017-3629-2 |
|
|
Doyle, JJ, Doyle JL (1987). A rapid DNA isolation procedure for small quantities of fresh leaf tissue. Phytochemistry Bulletin 19:11-15. |
|
|
Elshire RJ, Glaubitz JC, Sun, Q., Poland, J. A., Kawamoto, K., Buckler, E., Mitchell, S. (2011). A Robust, Simple Genotyping-by-Sequencing (GBS) Approach for High Diversity Species. PLoS ONE 6(5): e19379. |
|
|
Garavito A, Montagnon C, Guyot R, Bertrand B (2016). Identification by the DArTseq method of the genetic origin of the Coffea canephora cultivated in Vietnam and Mexico. BMC Plant Biology 16:242. |
|
|
Gichuru EK, Agwanda CO, Combes MC, Mutitu EW, Ngugi ECK, Bertrand B, Lasherme, P (2008). Identification of molecular markers linked to a gene conferring resistance to Coffee berry disease (Colletotrichum kahawae) in Coffea arabica. Plant Pathology 57:1117-1124. |
|
|
Gimase JM, Thagana WM, Omondi CO, Ithiru JM (2019). Evaluation of coffee berry disease resistance (Colletotrichum kahawae) in F2 populations derived from Arabica coffee varieties Rume Sudan and SL 28. Journal of Plant Breeding and Crop Science 11(9):225-233. |
|
|
Hindorf H, Omondi CO (2011). A review of three major fungal diseases of Coffea arabica L. in the rainforests of Ethiopia and progress in breeding for resistance in Kenya. Journal of Advanced Research 2(2):109-120. |
|
|
Horn F, Habekuß A, Stich B (2015). Linkage mapping of Barley yellow dwarf virus resistance in connected populations of maize. BMC Plant Biology 15:29. |
|
|
Jaetzold R, Schimidt H, Hornez H, Shisanya C (2006). Farm Management Handbook of Kenya, Vol. II/C: Natural Conditions and Farm Management Information, Central Kenya. Ministry of Agriculture, Nairobi; Kenya. p.573. |
|
|
Kim SM, Reinke RF (2019). A novel resistance gene for bacterial blight in rice, Xa43(t)identified by GWAS, confirmed by QTL mapping using a bi-parental population. PLoS ONE 14(2):e0211775. |
|
|
Kthiri D, Loladze A, N'Diaye A, Nilsen KT, Walkowiak S, Dreisigacker S, Ammar K, Pozniak CJ (2019). Mapping of Genetic Loci Conferring Resistance to Leaf Rust from Three Globally Resistant Durum Wheat Sources. Journal of Advanced Research 10:1247. |
|
|
Kosambi DD (1943). The estimation of map distances from recombination values. Annals of Eugenics 12(1):172-175. |
|
|
Lashermes P, Combes MC, Ansaldi C, Gichuru E, Noir S (2011). Analysis of alien introgression in the coffee tree (Coffea arabica L.) Mol Breeding 27:223-232. |
|
|
Li Q, Guo J, Chao K, Yang J, Yue W, Ma D, Wang B (2018). High-Density Mapping of an Adult-Plant Stripe Rust Resistance Gene YrBai in Wheat Landrace Baidatou Using the Whole Genome DArTseq and SNP Analysis. Frontiers in Plant Science 9:1120. |
|
|
McDonald J (1926). A preliminary account of a disease of green berries in the Kenya colony. Transactions of the British Mycological Society 11(1-2):145-154. |
|
|
Meng L, Li H, Zhang L, Wang J (2015) QTL IciMapping: integrated software for genetic linkage map construction and quantitative trait locus mapping in biparental populations. Crop Journal 3(3):269-283. |
|
|
Moncada MP, Tovar E, Montoya JC, González A, Spindel J, McCouch S (2016). A genetic linkage map of coffee (Coffea arabica L.) and QTL for yield, plant height, and bean size. Tree Genetics and Genomes 12:5. |
|
|
Nemli S, Asciogul TK, Ates D, Esiyok D, Tanyola MB (2017). Diversity and genetic analysis through DArTseq in common bean (Phaseolus vulgaris L.) germplasm from Turkey. Turkish Journal of Agriculture and Forestry 41:389-404. |
|
|
Pestana KN, Capucho AS, Caixeta ET, de Almeida DP, Zambolim EM, Cruz CD, Zambolim L, Pereira AA, Oliveira ACB, Sakiyama NS (2015). Inheritance study and linkage mapping of resistance loci to Hemileia vastatrix in Híbrido de Timor UFV 443-03. Tree Genetics and Genomes 11:72. |
|
|
Prakash NS, Combes MC, Somanna N, Lashermes P (2002). AFLP analysis of introgression in coffee cultivars (Coffea arabica L.) derived from a natural interspecific hybrid. Euphytica 124:265-271. |
|
|
Robinson RA (1976). Plant pathosystems. Advanced Series in Agricultural Sciences, Springer Verlag Berlin, New York 3:184. |
|
|
Rouet C, Lee EA, Banks T, O'Neill J, LeBlanc R, Somers DJ (2019). Identification of polymorphism within the Rosa multifora muRdr1A gene linked to resistance to multiple races of Diplocarpon rosae W. in tetraploid garden roses (Rosa x hybrida). Theoretical and Applied Genetics. |
|
|
Sant'Ana GC, Pereira LFP, Pot D, Ivamoto ST, Domingues DS, Ferreira RV, Pagiatto NF, da Silva BS, Nogueira LM, Kitzberger CS, Scholz MB (2018). Genome-wide association study reveals candidate genes influencing lipids and diterpenes contents in Coffea arabica L. Scientific. Reports 8:465. |
|
|
Scalabrin S, Toniutti L, Gaspero G, Scaglione D, Magris G, Vidotto M, Pinosio S, Cattonaro F, et al (2020). A single polyploidization event at the origin of the tetraploid genome of Coffea arabica is responsible for the extremely low genetic variation in wild and cultivated germplasm. Scientific Reports 10:4642 |
|
|
Sitonik C, Suresh LM, Beyene Y, Olsen MS, Makumbi D, Kiplagat O, Das B, Bright JM, Mugo S, Crossa J, Tarekegne A, Prasanna BM, Gowda M (2019). Genetic architecture of maize chlorotic mottle virus and maize lethal necrosis through GWAS, linkage analysis and genomic prediction in tropical maize germplasm. Theoretical and Applied Genetics 132:2381-2399. |
|
|
Tsai HY, Janss LL, Andersen JR, Orabi J, Jensen JD, Jahoor A, Jensen J (2020). Genomic prediction and GWAS of yield, quality and disease-related traits in spring barley and winter wheat. Scientific Reports 10:3347. |
|
|
Van Der Graaf NA (1978). Selection for resistance to coffee berry disease in arabica coffee in Ethiopia. Evaluation of Selection Methods 84:2055215. |
|
|
Van der Vossen HAM, Cook RTA, Murakaru GNW (1976). Breeding for resistance to Coffee Berry Disease caused by Colletotrichum coffeanum Noack sensu Hindorf in Coffea arabica L. I. Methods of pre-selection for resistance. Euphytica 25:733-756. |
|
|
Van der Vossen HAM, Walyaro DJ (1980). Breeding for resistance to coffee berry disease in coffea arabica L. II. Inheritance of the resistance. Euphytica 29:777-791. |
|
|
Van der Vossen H, Bertrand B, Charrier A (2015). Next-generation variety development for sustainable production of arabica coffee (Coffea arabica L.): a review. Euphytica 204:243. |
|
|
Vining KJ, Salinas N, Tennessen JA, Zurn JD, Sargent DJ, Hancock J, Bassil NV (2017). Genotyping-by-sequencing enables linkage mapping in three octoploid cultivated strawberry families. Peer Journal 5:e3731. |
|
|
Waller JM, Bridge PD, Black R, Hakiza G (1993). Characterization of the coffee berry disease pathogen, Colletotrichum kahawae sp. nov. Mycological Research 97(8): 989-94. |
|
|
Xiong H, Guo H, Zhou C, Guo X, Xie Y, Zhao L, Gu J, Zhao S, Ding Y, Liu L (2019) A combined association mapping and t-test analysis of SNP loci and candidate genes involving in resistance to low nitrogen traits by a wheat mutant population. PLoS ONE 14(1): e0211492. |
|
|
Zhang L, Li H, Li Z, Wang J (2008). Interactions between markers can be caused by the dominance effect of quantitative trait loci. Genetics 180:1177-1190. |
|
|
Zhou Z, Zhang C, Lu X, Wang L, Hao Z, Li M, Zhang D, Yong H, Zhu H, Weng J, Li X (2018) Dissecting the Genetic Basis Underlying Combining Ability of Plant Height Related Traits in Maize. Frontiers in Plant Science 9:1117. |
|
Copyright © 2024 Author(s) retain the copyright of this article.
This article is published under the terms of the Creative Commons Attribution License 4.0


