African Journal of
Agricultural Research

  • Abbreviation: Afr. J. Agric. Res.
  • Language: English
  • ISSN: 1991-637X
  • DOI: 10.5897/AJAR
  • Start Year: 2006
  • Published Articles: 6853

Full Length Research Paper

Gross antibodies, chemical composition of bovine milk and its influence by thermal stability

K. M. El-Zahar
  • K. M. El-Zahar
  • Food Science Department, Faculty of Agriculture, Zagazig University, Egypt.
  • Google Scholar
M. M. El-Loly
  • M. M. El-Loly
  • Dairy Science Department, National Research Centre, Dokki, Giza, Egypt.
  • Google Scholar
Azza S. Abdel-Ghany
  • Azza S. Abdel-Ghany
  • Food Science Department, Faculty of Agriculture, Zagazig University, Egypt.
  • Google Scholar


  •  Received: 28 August 2014
  •  Accepted: 17 December 2014
  •  Published: 14 May 2015

 ABSTRACT

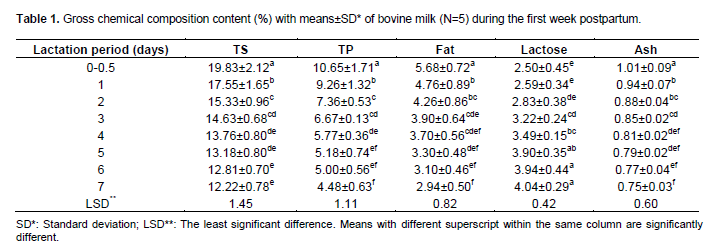
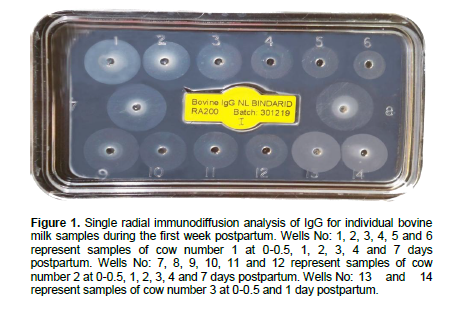
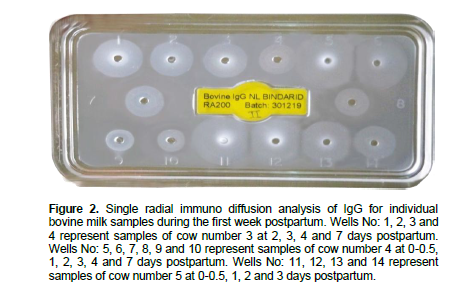
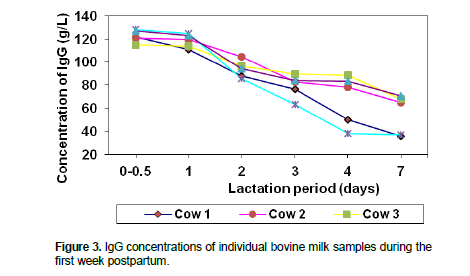
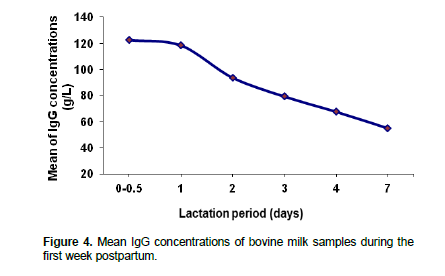
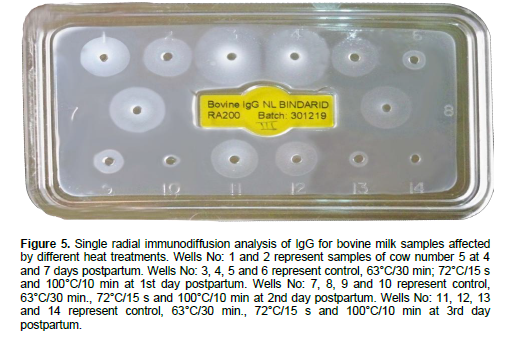
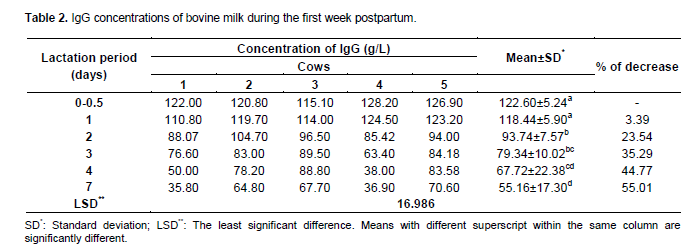
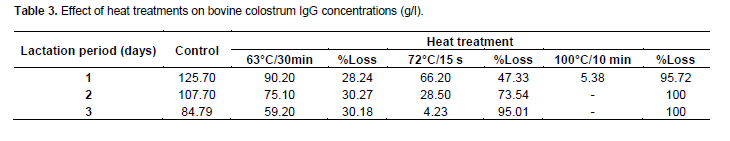
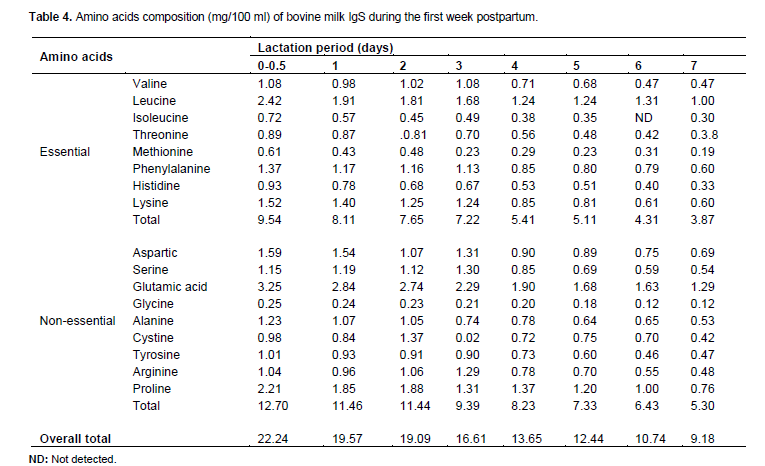
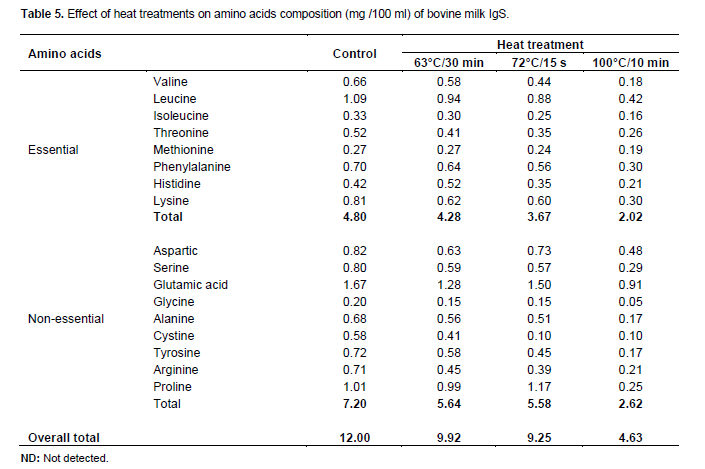
Immunoglobulin G (IgG), chemical composition contents of bovine milk during the first week of postpartum and the effect of heat treatments on bovine colostrum IgG contents were evaluated. Individual milk samples were collected from five cows at 0 to 0.5, 1, 2, 3, 4, 5, 6 and 7 days postpartum. The obtained results showed that the total solids, total protein, fat and ash contents decreased irregular with time after parturition, while the lactose content had an opposite trend. IgG concentrations were higher significantly during 0 to 0.5 and 1st days than those of other days postpartum, where the mean±SD of IgG concentrations were 122.60±5.24 and 118.44±5.90 g/L during 0-0.5 and 1st days postpartum, respectively. However, IgG concentrations dropped markedly with time progress of lactation at the end of the first week (7th day); it was 55.16±17.30 g/L that had dropped ratio of 55.01% when compared with its concentrations at 0 to 0.5 day. The IgG concentrations of thermally treated colostrum were decreased to 28.24, 30.27 and 30.18% at 63°C/30 min as well as 57.33, 73.54 and 95.1% at 72°C/15 s during 1, 2 and 3 days postpartum, respectively. On the other hand, the most thermal influence on IgG was at 100°C/10 min, where the percentage losses were 95.72% at 1st and 100% at 2 and 3 days postpartum. The total amino acids values of bovine milk immunoglobulins (IgS) were highest at 0 to 0.5 day and dropped markedly with time progress of lactation.


Key words: Bovine milk, colostrum, immunoglobulin G (IgG), heat treatments, amino acids.


 INTRODUCTION

Colostrum is very important part of milk and lays down the immune system and confers growth factors and other protective factors for the young ones in mammals. Also, it is a unique food created by nature to sustain and protect the new born mammal. It is a pre-milk made available by the mother to the newborn in the first few days after birth has  taken  place.  Colostrum   contains   high   levels   of immunoglobulins, the self-defense mechanism by which the body fights infection as well as valuable growth factors to nourish the newborn (Radu Dragomirescu, 2013). Vetter et al. (2013) mentioned that the provision of quality colostrum with a high concentration of immunoglobulin S is critical for newborn calf health, because   first    colostrum    may    be    low    in    overall concentration to effectively reduce the risk of newborn infections.
 
The nutritional and physiological needs of the neonate during this period of very early life are typically quite specialized. The composition of the maternal colostrum is tailored to meet these unique requirements (Tsioulpas et al., 2007; Chistiansen et al., 2010; Abd El-Fattah et al., 2012). The colostrum composition and its quality are influenced by a variety of factors, including maternal age, parity, breed, nutritional status, season, premature parturition, premature lactation, colostral handling factors, induction of parturition and health status. During transition from colostrum to normal milk, gradual or sometimes sudden changes may occur in composition and properties (Gulliksen et al., 2008; Abd El-Fattah et al., 2012; Morrill et al., 2012). Colostrum is not only a source of nutrients such as proteins, carbohydrates, fat, vitamins and minerals, but it also contains several biologically active molecules that are essential for specific functions. Most of the biologically active substances in complete bovine colostrum that can convey significant health benefits are proteins (Pakkanen and Aalto, 1997).
 
In recent years, bovine colostrum has become popular as a product for human consumption, because it is an excellent source of bioactive proteins. The latter would have the ability to prevent bacteria and viruses as well as to improve the gastrointestinal and body condition. Really, the exploitation of the beneficial properties of colostrum is not a new concept (Conte and Scarantino, 2013). The immunoglobulins S (IgS), or antibodies, found in colostrum or milk are the same as those found in the blood or mucosal secretions. They are used by the immune system to identify and neutralize foreign objects, such as bacteria and viruses. For cattle, IgS are grouped into four isotypes, IgG (IgG1 and IgG2), IgM, IgA, and IgE, based on the heavy chain they possess (Korhonen et al., 2000a, b; Gapper et al., 2007). IgG, IgM and IgA are present in high levels in milk, especially in colostrum. The IgG is dominant in colostrum, milk and blood (about 80 to 90%, 60 to 70% and 90% of total IgS, respectively) (Mix et al., 2006; Zhao et al., 2010).
 
IgG concentrations change throughout the first six milking’s postpartum. The relatively high levels of IgG in early bovine colostrum thus provide an essential source of this nutrient to the calf immediately following parturition and until it can establish immunosufficiency. IgG antibodies express multifunctional activities, including complement activation, bacterial opsonisation and agglutination as well as act by binding to specific sites on the surfaces of most infectious agents or products, either inactivating them or reducing infection (Lilius and Marnila, 2001; Gapper et al., 2007).
 
Interest has arisen on the effect of heat treatments on different Ig classes. Detectable IgG in colostrum or colostral whey are reduced by heat treatment at a slower rate than the isolated IgG. Thermal Protestants  such as sugars or glycerol can increase the stability of isolated IgG to heat treatment (Chen et al., 2000; Zagorska and Ciprovica, 2012). According to Chen and Chang (1998) IgS are thermo labile. Exposure to temperatures of 75°C/5 min can reduce detectable isolated bovine IgG by 40%, and by 100% at 95°C/15 s. The explanation of it is conformational changes in the IgG molecule caused by heat exposure (Calmettes et al., 1991). Donahue et al. (2012) demonstrates that batch heat treatment of colostrum at 60°C/60 min can be successfully conducted on commercial dairy farms by farm staff to decrease colostrum microbial counts while maintaining colostrum IgG concentrations. Also, Gelsinger et al. (2014) reported that heat treatment significantly reduced all types of bacteria and IgG concentration in colostrum at 60°C/30 min.
 
The aim of the current study was to analyze gross IgS, chemical composition of bovine milk during the first week postpartum and evaluate the effect of heat treatments on bovine milk IgG content.


 MATERIALS AND METHODS

Sample collection
 
This study was conducted from February 2010 till December 2012 aiming at estimation of the concentrations of total protein and IgG in bovine milk during the first week postpartum. Individual milk samples were collected from five Frisian cows  of El-Sadeen village, Menia Al-kamh Center, Sharkia Governorate, Egypt. Milk samples were obtained at 0 to 0.5, 1, 2, 3, 4, 5, 6 and 7 days postpartum. Samples were collected in sterilized bottles by supervised manual expression at the end of the milking and transported to the laboratory in an ice box. All samples were stored at -20°C immediately on arrival and kept frozen till analysed.
 
Determination of gross chemical composition
 
The total solids (TS), total protein (TP) and fat contents, lactose and ash contents were determined according to AOAC (2000).
 
Determination of immunoglobulins in bovine milk
 
Samples preparation
 
Bovine milk samples were defatted by centrifugation at 4000 rpm/3 min. Milk whey was prepared from the skim milk by adjusting pH to 4.6 using 1 N HCl solution and centrifuging at 10000 rpm/15 min to remove casein precipitate. Total IgS were prepared from whey samples by using saturated ammonium sulphate solution according to the method described by Hebert (1974). The ammonium sulphate extract was dialysed against distilled water for 24 h, at refrigerator with several changes of distilled water during this period. The dialysed extract was kept at -20°C until analysed.
 
Immunoglobulin quantification by single radial immunodiffusion (SRID)
 
The immunoglobulin G (IgG) content was quantified using Single Radial Immuno Diffusion Technique (SRID) as described by Fahey and Mckelvey (1965).  SRID   plates   containing antibodies  to  IgG and IgM (Cat. No. RL 200.3, RN 278.3, the Binding Site LTTDR, UK) were used.
 
Heat treatments
 
To investigate the effect of heating methods on the IgG content of bovine milk, the milk samples were collected from individual cow’s milk during the first three days of postpartum (colostrum) and defatted, the skim milk was heat treated as follows: Heating was carried out at 63?C / 30 min, 72?C / 15 s and 100?C / 10 min; then followed by rapid cooling to 37?C for all samples.
 
Amino acids analysis
 
Amino acids content were determined as described by Folkertsma and Fox (1992). The analysis was performed in Central Service Unit, National Research Centre, Egypt, using LC3000 amino acid analyzer (Eppendorf-Biotronik, Germany). The technique was based on the separation of the amino acids using strong cation exchange chromatography followed by the ninhydrine color reaction and photometric detection at 570 nm. Samples were hydrolysed with 6 N HCl at 110?C in Teflon capped vials for 24 h. After vacuum removal of HCl, the residues were dissolved in a lithium citrate buffer, pH 2.2. 20 µl of the solution were loaded on to the cation exchange column (pre-equilibrated with the same buffer), then four lithium citrate buffers with pH values of 2.2, 2.8, 3.3 and 3.7 respectively, were successively applied to the column at flow rate 0.2 ml/min. The ninhydrine flow rate was 0.2 ml/min and pressure of 0 to 150 bar. The pressure of buffer was from 0 to 50 bars and reaction temperature was 130ºC.
 
Statistical analysis
 
Statistical analysis for the obtained data was carried out using SPSS version 20 computer program (Dominick and Derrick, 2001). All data were expressed by means and standard deviations of 3 replicates and were compared using One- way ANOVAs and least significant difference (LSD). Values with different letters within the same column differ significantly at p<0.01 to 0.05.


 RESULTS AND DISCUSSION

Gross chemical composition of bovine milk
 
It was noticed that the mean±SD concentration of TS was 19.83±2.12% during 0 to 0.5 day postpartum. TS  Total solids content decreased to reach a mean±SD 17.55±1.65% at 1st day postpartum. While gradual decreases of TS could be noticed on the following days at 2, 3, 4, 5, 6 and 7 postpartum, respectively. The mean concentrations of TS were higher significantly during 0 to 0.5 day than other days postpartum. But no significant differences were found between 3, 4 and 5 days. No significant differences were found between 4, 5, 6 and 7 days postpartum, in the same order (Table 1). Similar results have been reported by Abd El-Fattah et al. (2012) who observed that the TS contents decreased irregularly with time after parturition. TS content at 1st day postpartum in the present study was higher than those reported by Kleinsmith (2011).
 
 
Bar et al. (2010) found that the mean of TS contents in bovine colostrum were 27.6 and 23.6% with ranges 18.3 to 43.3 and 21.6 to 29.15%, respectively, while in mature milk (0.0.5H) were 12.7 and 12.9%; Walstra et al. (2006) and Kleinsmith (2011) found that the TS contents in bovine colostrum were 27, 20.5, 14.5, 12.8, 12.2 and 11.5% at 0, 6, 12, 24, 36 and 48 h postpartum, respectively. Also, Abd El-Fattah et al. (2012) stated that the mean of TS content in bovine colostrum at calving was 24.2%. TP concentration of bovine milk was higher significantly during 0 to 0.5 day postpartum (10.7±1.7%) than other days, followed by 1st day postpartum (9.3±1.3%). No significant differences were found between the mean±SD concentrations of TP at 2nd day (7.4±0.5%) and 3rd day (6.7±1.1%), but significant differences were found between 2nd (7.4±0.5%) and 4th days (5.8±0.4%). However, no significant differences were found between the mean±SD concentrations of TP at 5 (5.2±0.7%), 6 (5.00±0.6%) and 7 (4.5±0.6%) days postpartum (Table 1). These results are in agreement with those found by Tsioulpas et al. (2007); Kleinsmith (2011) and Abd El-Fattah et al. (2012) who found that the protein content decreases gradually with time after parturition. Protein content at 1st day postpartum in this study was higher than those reported by Klimes et al. (1986) and lower than those reported by Tsioulpas et al. (2007).
 
The mean of TP content in bovine colostrum was 14.92% with range 7.1 to 22.6% within 4 h of calving (Kehoe et al., 2007); 9.5% with range 6.6 to 11.7% at first milked after calving (Bar et al., 2010); 13.45% at calving (Abd El-Fattah et al., 2012) and 12.2% with range 8.9 to 21.9% after 2 to 3 days postpartum (Conte and Scarantino, 2013), while in mature milk, the protein contents were 3.4% (Gopal and Gill, 2000), 2.9% (Fox and McSweeney, 2003) and 3.3% (Walstra et al., 2006). The mean ± SD concentration of fat was 5.7 ± 0.7% during 0 to 0.5 day postpartum and dropped to a mean ± SD 4.8 ± 0.9% at 1st day postpartum. Thereafter, a gradually decreasing could be noticed on the following days, where the means ± SD of fat concentrations were 4.3 ± 0.9, 3.9 ± 0.6, 3.7 ± 0.6, 3.3 ± 0.5, 3.1 ± 0.5 and 3 ± 0.5% at 2, 3, 4, 5, 6 and 7 days postpartum, respectively (Table 1). These results indicate that a significant difference was found between the fat content during 0 to 0.5 day and other days, but no significant differences were found between 1 and 2; 2, 3 and 4 and 4, 5, 6 and 7 days postpartum. Also, the results are in quite agreement with those of Abd El-Fattah et al. (2012) who observed that the fat content decrease with time after parturition, but in contrast with the study of Tsioulpas et al. (2007) and Kleinsmith (2011).
 
Fat content at 1st day postpartum in the present study was higher than those reported by Tsioulpas et al. (2007). Fat content of the first milking colostrum varies over a wide range and was reflected in values for TS (Elfstrand, et al., 2002). The mean of fat contents in bovine colostrum were 6.7% with range 2.0 to 26.5% within 4 h of calving (Kehoe et al., 2007), 3.5 (4.6 to 5.8%) of first milked after calving (Bar et al., 2010), 8.0% at calving (Abd El-Fattah et al., 2012) and 7.9 (2.6 to 16.1%) after 2 to 3 days postpartum (Conte and Scarantino, 2013), while in mature milk, it was 3.7% (Jensen, 1995), 4.6% (Gopal and Gill, 2000), 4.5% (Fox and McSweeney, 2003) and 4.0% (Walstra et al., 2006).
 
It is evident from Table 1 that the mean ± SD of lactose concentrations at 0 to 0.5, 1st and 2nd days were 2.50±0.45, 2.59±0.34 and 2.83±0.38%, respectively without significant differences between the first two days of lactation. The lactose content increased to a mean ± SD 3.2±0.2% at 3rd day, 3.5±0.2% at 4th day and 3.90±0.3% at 5th day. On the other hand, the mean ± SD concentrations of lactose at 6 and 7 days were 3.9±00.4and 4.04±0.3%, respectively without significant differences between them. Our results are closely similar with those of Kleinsmith (2011) and Abd El-Fattah et al. (2012) who observed that the lactose content increase with time after parturition. This difference is an advantage because lactose can induce the young to scour (diarrhea) with subsequent death or unthiftiness (Roy, 1970). In contrast with the study of Elfstrand et al. (2002) who found that the lactose contents were 3.0, 2.9, 3.5, 3.2, 3.5, 3.5 and 3.8% during 0 to 6, 7 to 10, 11 to 20, 21 to 30, 31 to 40, 41 to 50 and 51 to 80 h, respectively.
 
Changes in  lactose  content  of  colostrum showed  the opposite trend than the corresponding values in the mature milk, probably due to the knowledge of the mechanisms of lactose synthesis. Kuhn (1983) suggested that the lower availability of plasma glucose and colostral Lactalbumin is a possible cause of the lower percentage of lactose in colostrum immediately after parturition. Lactose contents in the present study were lower than those reported by Tsioulpas et al. (2007) at 1st to 5th day; Kleinsmith (2011) at 1st and 2nd days; Klimes et al. (1986) at 3rd and 5th days postpartum. But, it was higher than those reported by Klimes et al. (1986) at 1st day postpartum. Bar et al. (2010) and Conte and Scarantino (2013) showed that the mean of lactose contents in bovine colostrum were 2.49, 3.5 and 2.04% with ranges 1.2 to 5.2, 3.37 to 3.94 and 1.46 to 3.19%, in the same order, while in mature milk, it were 4.1 and 4.6% (Walstra et al., 2006).
 
The mean ± SD concentrations of ash were higher significantly during 0 to 0.5 day (1.0 ± 0.1%) than those of other days postpartum, then dropped to range from 0.8 to 1.0% at 1st day postpartum with a mean ± SD 0.9±0.1%, while at 2nd day postpartum had a mean ± SD 0.9 ± 0.04%, without significant differences between 1st and 2nd day. A gradual decrease could be observed on the following days namely, 0.9±0.02, 0.8±0.02, 0.8±0.02, 0.8±0.04 and 0.75 ± 0.03% at 3, 4, 5, 6 and 7 days postpartum, in order. There were significant differences between ash content at 2nd and 4th days postpartum, but insignificant variations were found between 4, 5, 6 and 7 days postpartum (Table 1). These results are in agreement with the previous reports by Klimes et al. (1986), Tsioulpas et al. (2007) and Abd El-Fattah et al. (2012) who observed that the ash content decrease with time after parturition. This may be attributed to increase of mineral in colostrum compared to mature milk. However, in colostrum, high protein and salt, low sugar content are ideal for the neonate’s immature digestive system (Hamosh, 1996). Bar et al. (2010) showed that the mean values of ash content in bovine colostrum were 0.05 and 1.5% with ranges 0.02 to 0.1 and 1.10 to 1.3%, respectively, while in mature milk were 0.7 and 0.8% (Fox and McSweeney, 2003).
 
IgG concentrations of bovine milk during the first week postpartum
 
Individual milk samples were taken from five cows within 7 days postpartum. The IgG concentrations of bovine milk samples were quantified by the SRID technique at 0 to 0.5, 1, 2, 3, 4 and 7 days postpartum. The relation between the IgS concentrations and the diameter of the precipitated antigen-antibody reaction are found in Figures 1, 2, 3, 4 and 5 (wells No. 1 and 2). It is clear that the IgG concentrations were highest in colostrum, which falls drastically with the first few days of lactation. The IgG concentrations were higher  significantly  during 0  to 0.5 and 1st days than those of other days postpartum, where the mean±SD of IgG concentrations were 122.6±5.2 and 118.4±5.9 g/L during 0 to 0.5 and 1st days postpartum, respectively (Table 2). However, IgG concentrations dropped markedly with time progress of lactation. At 2nd, 3rd and 4th days, the mean ± SD values of IgG were 93.7±7.6, 79.3 ± 10.0 and 67.7±22.4 g/L, respectively, which had dropped ratios of 23.5, 35.3 and 44.8%, in order.


At the end of the first week (7th day), the mean ± SD of IgG concentration was 55.2±17.3 g/L that had dropped ratio 55.0% when compared with its concentrations at 0 to 0.5 day. This change in IgG content indicates that the significance of colostrum for the health of the newborn calf where the absorption of IgG during the first 24 h, after birth was reported occur excessively (Butler, 1971). These results are in good agreement with those of Saucedo-Quintero and Avendano-Reyes (2004) and Abd El-Fattah et al. (2012). Elfstrand et al. (2002) stated that the major IgS present in bovine milk are IgG with 85% ratio, among which 95% belong to the sub classes IgG1 and 5% to the IgG2. The mean concentrations of IgG (IgG1+IgG2) were 92.8, 80.9, 66.8, 25.1, 31.5, 17.7 and 12.2 g/L during 0 to 6, 7 to 10, 11 to 20, 21 to 30, 31 to 40, 41 to 50 and 51 to 80 h, respectively. Similar results were reported by Bar et al. (2010), Morrill et al. (2012) and Quigley et al.  (2013), while in mature milk, it was 0.72 and 0.556 mg/ml (Zagorska and Ciprovica, 2012).
 
Effect of heat treatments on bovine colostrum IgG
 
It could be noticed that the concentrations of IgG during thermal treatments were reduced from 125.7, 107.7 and 84.8 g/L in control individual milk samples at 1, 2 and 3 days postpartum to 90.2, 75.1 and 59.20 g/L in thermally treated milk at 63°C/30 min, in order, it were decrease to 28.2, 30.3 and 30.2%, respectively (Table 3). Increasing temperature to 72°C/15 s, the IgG concentrations of heated individual milk samples were reduced to 66.2, 28.5 and 4.2 g/L, it were decreased by 52.7, 26.5 and 5% at 1, 2 and 3 days postpartum, respectively. On the other hand, the most influence on IgG content at 100°C/10 min, where the percentage losses were 95.7% at 1st and 100% at 2 and 3 days postpartum. It could be concluded that the stability of IgG in bovine milk was influenced by thermal treatments. These results are in accordance with those reported by El-Loly (1996) and Zagorska and Ciprovica (2012). While Mainer et al. (1997) had different research results, HTST pasteurization (72°C/15 s) led to 25 to 40% loss of IgG concentration.
 
 
Amino acids composition of bovine milk IgS during the first week postpartum
 
The essential and non-essential amino acids composition of bovine milk IgS from parturition to 7th day postpartum are presented in Table (4) Threonine, leucine, phenylalanine, histidine, aspartic, glutamic, glycine and tyrosine concentrations were gradually decreased during the first week of lactation, values being 0.9 to 0.4, 2.4 to 1.0, 1.4 to 0.6, 0.9 to 0.3, 1.6 to 0.7, 3.25 to 1.3, 0.25 to 0.1 and 1.0 to 0.5 mg/100 ml at 0-0.5 and 7 days postpartum, respectively. Whereas, valine, methionine, isoleucine, lysine, serine, alanine, cystine, arginine and proline concentrations were the highest at 0 to 0.5 day that then decreased at 7th day postpartum, but these decreases were progressively. These values at 0 to 0.5 and 7th days postpartum were valine (1.1 and 0.5), methionine (0.6 and 0.2), isoleucine (0.7 and 0.3), lysine (1.5 and 0.6), serine (1.15 and 0.54), alanine (1.2 and 0.5), cystine (01.0 and 0.4), arginine (1.04 and 0.5) and proline (2.2 and 0.8) mg/100 ml, respectively. From the obtained data, it is evident that the generally total of amino acids values were highest at 0 to 0.5 day and gradually decreased at the following days, these values were 22.2, 19.6, 19.1, 16.6, 13.65, 12.4, 10.7 and 9.2 mg/100 ml at 0 to 0.5, 1, 2, 3, 4, 5, 6 and 7 days postpartum, respectively.
 
 
Furthermore, it is very clear that glutamic acid (non-essential) was found in the largest amount of bovine milk IgS in amount 2.2 mg/100 ml of the generally total amino acids with a ratio 14.25% of them. While in the essential amino acids, the leucine acid was presented in the highest content with ratio 10.2% of the generally total in a mean 1.6 mg/100 ml. These results are in contrast with those reported by El-Loly (1996) who observed that buffalo's milk IgS at the first 12 h postpartum contained higher values of all essential amino acids except leucine and lysine.
 
Effect of some heat treatments on amino acids contents of bovine colostrum IgS
 
Composite colostrum samples collected throughout the first milking (1, 2 and 3 days) after calving in dairy cows. Heating was carried out at 63?C /30 min, 72?C / 15 s and 100?C /10 min., and then followed by rapid cooling to 37?C for all samples. As known, milk is a heat labile material and the thermal treatments of milk are to improve quality. Therefore, it is very important to understand the changes happening in the amino acids composition of milk IgS during the applied thermal treatments. It could be noticed that the values of all essential amino acids were reduced in thermal treated milk samples at 63°C/30 min, 72°C/15 s and 100°C/10 min. compared to control sample except histidine value at 63°C/30 min. Non-essential amino acids values were decreased in thermal treated milk samples at 63°C/30 min., 72°C/15 s and 100°C/10 min. compared to  control sample except proline value at 72°C/15 s.
 
On the other hand, the highest influence on all amino acids values was at 100°C/10 min. because this protein is sensitive to heating. The effect of heat treatment at 72°C/15 s on values of aspartic, glutamic and glycine were lower than that effect of heated samples at 63°C/30 min. (Table 5). El-Loly (1996) observed that the lysine concentration of the IgS content of buffalo's milk was decreased at sterilization treatment (130ºC/15 s), while aspartic and glutamic values were increased at the boiling and sterilization methods. Isoleucine, leucine and phenylalanine values were increased, but glycine and alanine were decreased from control to sterilized milk samples.


 CONCLUSION

Immunoglobulins an important component of the immunological activity found in colostrum and milk. They are central to the immunological link that occurs when the mother transfers passive immunity to the offspring. Cattle provide a readily available immune rich colostrum and milk in large quantities, making those secretions important potential sources of immune products that may benefit humans.


 CONFLICT OF INTEREST

The authors have not declared any conflict of interest.


 REFERENCES

Abd El-Fattah AM, Abd Rabo, FHR, El-Dieb SM, El-Kashef HA (2012). Changes in composition of colostrum of Egyptian buffaloes and Holstein cows. BMC Veter. Res. 8:1-7.
Crossref
 
Aoac, Official Methods of Analysis. (2000). 17th ed., Association of Official Analytical Chemists. Gaithersburg, MD, USA.
 
Bar E, Tiris I, Sarbu D, Iridon C, Ochea I Bratu I (2010). Full characterization of bovine colostrum, raw material for dietary supplements. His beneficial effect on the human immune system. Acta Universitatis Cibiniensis Series E: Food Technol. 14(2):33-40.
 
Butler JE (1971). Characteristics of bovine immunoglobulins and related molecules - Review of the bovine immunoglobulins. J. Dairy Sci. 54:1315-1316.
PMid:5094693
 
Calmettes P, Cser L, Rajnavolgy E (1991). Temperature and pH dependence of immunoglobulin G conformation. Arch. Biochem. Biophys. 291:277-283.
Crossref
 
Chen CC, Chang HM (2000). Effect of thermal protectants on the stability of bovine milk immunoglobulin G. J. Agric. food Chem. 46:3570-3576.
Crossref
 
Chen CC, Tu YY, Chang HM (2000). Thermal stability of bovine milk immunoglobulin G (IgG) and the effect of added thermal protectants on the stability. J. Food Sci. 64:188-193.
Crossref
 
Chistiansen S, Guo M, Kjelden D (2010). Chemical composition and nutrient profile of low molecular weight fraction of bovine colostrum. Int. Dairy J. 20:630-636.
Crossref
 
Conte F, Scarantino S (2013). A study on the quality of bovine colostrum: physical, chemical and safety assessment. Int. Food Res. J. 20(2):925-931.
 
Dominick S, Derrick R (2001). Theory and problems of statistics and econometrics. Second ed., New York, P. 202.
 
Donahue M,  Godden SM,  Bey R,  Wells S,  Oakes JM, Sreevatsan S, Stabel J, Fetrow J (2012). Heat treatment of colostrum on commercial dairy farms decreases colostrum microbial counts while maintaining colostrum immunoglobulin G concentrations. J. Dairy Sci. 95(5):2697-2702.
Crossref
 
Elfstrand L, Lindmark-Mansson H, Paulsson M, Nyberg L, Akesson B (2002). Immunoglobulins, growth factors and growth hormone in bovine colostrum and the effects of processing. Int. Dairy J. 12:879-887.
Crossref
 
El-Loly MM (1996). Detailed studied on the bound minor proteins of buffalo milk. Ph.D. Thesis, Fac. Agric., Ain Shams Univ. Egypt.
 
Fahey TL, Mckelvey EM (1965). Quantitative determination of serum immunoglobulins in antibody-agar plate. J. Immunol. 94:84-90.
 
Folkertsma B, Fox PF (1992). Use of the Cd-ninhydrin reagent to assess proteolysis in cheese during ripening. J. Dairy Res. 59:217–224.
Crossref
 
Fox PF, Mcsweeney PLH (2003). Advanced Dairy Chemistry, Vol. 1. Proteins (Part A). 3rd. ed. Kluwer Academic/Plenum Publ., NY.
 
Gapper LW, Copstake DEJ Otter DE, Indyk HE (2007). Analysis of bovine immunoglobulin G in milk, colostrum and dietary supplements - A review. Anal. Bioanal. Chem. 389:93-109.
Crossref
 
Gelsinger SL, Gray SM, Jones CM, Heinrichs AJ (2014). Heat treatment of colostrum increases immunoglobulin G absorption efficiency in high-, medium-, and low-quality colostrum. J. Dairy Sci. 97(4):2355-2360.
Crossref
 
Gopal PK, Gill HS (2000). Oligosaccharides and glycoconjugates in bovine milk and colostrum. British J. Nut. 84:69-74.
Crossref
 
Gulliksen SM, Lie KI, Solverod L, Osteras O (2008). Risk factors associated with colostrum quality in Norwegian dairy cows. J. Dairy Sci. 91:704-712.
Crossref
 
Hamosh M (1996). Breast-feeding: Unraveling the mysteries of mother's milk. Medscape Women's Health. 1:4-20.
 
Hebert GA (1974). Ammonium sulphate fractionation of sera: Mouse, Hamster, Guinea pig, Monkey, Chimpanzee, Swine, Chicken and Cattle. Appl. Microbiol. 27:389-393.
 
Kehoe SI, Jayarao BM, Heinrichs AJ (2007). A survey of bovine colostrum composition and colostrum management practices on Pennsylvania dairy farms. J. Dairy Sci. 90:4108-4116.
Crossref
 
Kleinsmith A (2011). Scientific and medical research related to bovine colostrum. Its relationship and use in the treatment of disease in humans. True bovine colostrum for the practitioner.
 
Klimes J, Jagos P, Bouda J, Gajdusek S (1986). Basic qualitative parameters of cow colostrum and their dependence on season and postpartum time. Acta Vet. Hno. 55:23-39.
Crossref
 
Korhonen H, Marnila P, Gill HS (2000a). Bovine milk antibodies for health. British J. Nut. 84:135-146.
Crossref
 
Korhonen H, Marnila P, Gill HS (2000b). Milk immunoglobulins and complement factors. British J. Nut. 84:75-80.
Crossref
 
Lilius EM, Marnila P (2001). The role of colostral antibodies in prevention of microbial infections. Curr. Opin. Infect. Dis. 14:295-300.
Crossref
 
Mainer G, Sanchez L, Ena JM, Calvo M (1997). Kinetic and thermodynamic parameters for heat denaturation of bovine milk IgG, IgA and IgM. J. Food Sci. 62:1034-1038.
Crossref
 
Mix E, Goertsches R, Zettl UK (2006). Immunoglobulins-basic considerations. J. Neurol. 253:9-17.
Crossref
 
Morrill KM, Conrad E, Polo J, Lago A, Campbell J, Quigley J, Tyler H (2012). Estimate of colostral immunoglobulin G concentration using refractometry without or with caprylic acid fractionation. J. Dairy Sci. 95:3987-3996.
Crossref
 
Pakkanen R, Aalto J (1997). Growth factors and antimicrobial factors of bovine colostrum. Int. Dairy J. 7:285-291.
Crossref
 
Quigley JD, Lago A, Chapman C, Erickson P, Polo J (2013). Evaluation of the Brix refractometer to estimate immunoglobulin G concentration in bovine colostrum. J. Dairy Sci. 96:1148-1155.
Crossref
 
Radu Dragomirescu. (2013). http://www.scribd.com/doc/141011021/Colostrum-Review
 
Roy JHB (1970). Management and feeding. The Calf. Butterworth and Co., Toronto. P. I.
 
Saucedo-Quintero JS, Avendano-Reyes L (2004). Colostrum immune-globulin transference in Holstein cattle according the age and the dam. Am. Soc. Anim. Sci. 55:322-324.
 
Tsioulpas A, Grandison AS, Lewis MJ (2007). Changes in physical properties of bovine milk from the colostrum period to early lactation. J. Dairy Sci. 90:5012-5017.
Crossref
 
Vetter A, Argüello A, Baumrucker C, Bruckmaier RM (2013). Short communication: Fractional milking distribution of immunoglobulin G and other constituents in colostrum. J. Dairy Sci. 96(9):5919-5922.
Crossref
 
Walstra P, Wouters JTM, Geurts TJ (2006). Dairy Science and Technology. 2nd ed. Boca Raton, FL, CRC Press.
 
Zagorska J, Ciprovica I (2012). The influence of heat treatment on antimicrobial proteins in milk. World Acad. Sci., Eng. Technol. 64:832-836.
 
Zhao S, Zhang C, Wang J, Liu G Bu D, Cheng J, Zhou L (2010). Variations of immunoglobulins in colostrum and immune milk as affected by antigen releasing devices. Asian-Aust. J. Anim. Sci. 23:1184-1189.


          */?>