ABSTRACT
Globally, banana is the fourth most important fruit crop and is grown in more than 130 countries across the world. Traditional procedure to characterize banana plants by morphological descriptors has many limitations, and different communities refer to the same local cultivars by different names due to lack of clear clone identity resulting in unnecessary duplication with regard to cultivation, conservation and research. To alleviate this problem application of modern finger printing technology through DNA studies have been recommended for accurate selection of banana clones. Here, 16 genotypes of banana collected from different districts of West Bengal and other parts of India were characterized by RAPD analysis to assist the selection of characters for banana breeding. It was observed that among the 25 randomly selected markers, OPE 1, 4, 7, 9, 20 and 25 showed 100% polymorphism under annealing temperatures of 27 and 29°C. Their genetic diversity study revealed that sixteen germplasms were grouped into eight clusters namely Malbhog, Martaman, Kalibhog and Sobri in Cluster-I; Alapan, Poovan and Champa in Cluster-II; Amritpani, Bamandeshi in Cluster-III; Dudhsagar, Rasthali in Cluster-IV; Krishna Vazai, Manohar in Cluster-V; Chang Monua in Cluster VI; Kanai Bansi in Cluster VII and Nendran in Cluster VIII.
Key words: Banana, molecular characterization, genetic diversity.
Banana (Musa sp.) is the maximum distributed fruit crop and is the fourth most important commodity in the world. It is grown in more than 130 countries across the world, continuously exhibiting a spectacular growth pattern worldwide, producing 120 million tonnes (Anonymous, 2014) of which 56% is shared by Asia. India is the largest producer of banana in the world with the production of 29.72 million tonnes during 2013-14 (Anonymous, 2015). There are diverse germplasms of banana traditionally cultivated in different regions of India having remarkable genetic differences, in spite of their overall genomic grouping variations still existing in the same group. Despite the importance of bananas in trade and commerce, there is little information on the genetics for its agronomically important traits (Loh et al., 2000). Traditional procedure to characterize banana plants by morphological descriptors has many limitations. Many improved varieties released have a complex genealogy involving several wild species and landraces. However, barriers such as intractable fertilization, moderate to high levels of female sterility and triploidy have made the identification of desired banana cultivars a key issue for these crop improvement programmes (Bhat et al., 1995). In view of developing efficient breeding schemes, additional data needs to be generated on the complex genome structure of hybrids and cultivars. To this end, the characterization of indigenous germplasms will offer a precise means of formulating taxonomic, phylogenetic and heterotic groupings within the family Musaceae (Crouch et al., 1998).
Cheesman (1948) first suggested that cultivated bananas originated from intra and interspecific hybridization between the two wild diploid species Musa acuminata Colla and Musa balbisiana Colla, each contributing the A and B genomes, respectively. The identification of Musa cultivars has traditionally been based upon various combinations of morphological, phenological and floral criteria. Simmonds and Shepherd (1955) devised a scoring technique based on 15 diagnostic morphological characters to differentiate M. acuminate clones from M. balbisiana cultivars and their hybrids into 6 genome groups. The taxonomy of cultivated bananas has long been a contentious issue and because it relies heavily on morphology, the literature shows many contradictions. For instance, based on molecular data, Pillay et al. (2000) showed that the clones ‘Monthan Saba’ and ‘Bluggoe’, previously classified as BBB based on morphological characteristics but, actually belong to the ABB group. Similarly, tetraploid ‘KlueTiparot’ (ABBB) is reclassified as a triploid ABB (Jenny and Carreel, 1997; Horry et al., 1998). The difficulties associated with the use of whole plant or floral morphology has led researchers to develop other techniques for the correct identification of Musa species and cultivars.
Different communities refer to the same local cultivars by different names, and lack of clear clone identity in the crop has resulted in unnecessary duplication in cultivation, conservation and research (Onguso et al., 2004). To alleviate this problem, application of modern finger printing technology through DNA studies have been recommended for accurate selection of banana clones (Robinson, 1996).
As a more reliable alternative, various DNA fingerprinting techniques have been used to study the genetic diversity and taxonomy of cultivated bananas which include disozyme analysis (Bhat et al., 1992), restriction fragment length polymorphism (RFLP) (Bhat et al., 1994; Jarret et al., 1992: Kaemmer et al., 1992), rRNA spacer length heterogeneity (Lanaud et al., 1992), inter simple sequence repeat (ISSR) markers (Godwin et al., 1997), sequence tagged microsatellite sites (STMS) (Grapin et al., 1998; Kaemmer et al., 1997) and amplified fragment length polymorphism (AFLP) (Loh et al., 2000; Wong et al., 2001).
To make the collection useful for plant breeders, morphological and molecular characterization of the germplasms is necessary. The disadvantages of phenotype-based assays can be overcome by direct identification of genotypes with DNA-based markers (Nsabimana and Staden, 2007). Molecular markers have been employed in Musa genotypes to assess ploidy (Oselebe et al., 2006), phylogenetic relationships (Jain et al., 2007; Nsabimana and Staden, 2007; Uma et al., 2006) and genetic diversity because of somaclonal variation (Lakshmanan et al., 2007; Bairu et al., 2006; Ray et al., 2006) or mutation induction (Hautea et al., 2004; Finalet et al., 2000; Toruan-Mathius and Haris, 1999). Polymorphis generated by RAPD analysis has been used for fingerprinting and classification of the Musa genotypes. Linkage of RAPD markers to specific traits such as disease resistance has been possible (Damasco et al., 1996) and RAPD markers are usually preferred as the technique is simple, versatile, relatively inexpensive and able to detect minute differences (Pillay et al., 2000; Williams et al., 1990; Welsh and McClelland, 1990; Howell et al., 1994). RAPD based fingerprinting has been successfully applied to the characterization of diverse Musa germplasms (Bhat and Jarret, 1995; Onguso et al., 2004), analysis of Musa breeding populations (Crouch et al., 1999) and detection of somaclonal variants (Grajal-Martin et al., 1998). A proper classification of Musa clones and cultivars is important in assisting the selection of characters for banana breeding. This research work therefore describes the use of RAPD markers to evaluate the genetic diversity and relationships amongst sixteen different Mauritian Musa germplasms collected from different parts of India.
Plant materials
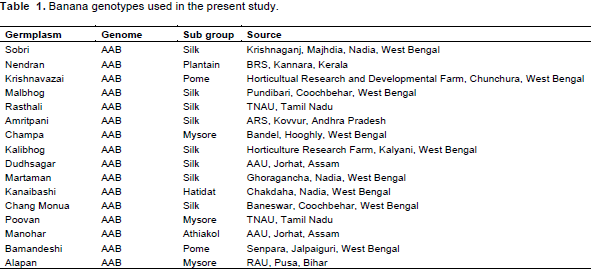
The present study was made at the Department of Fruits and Orchard Management, Faculty of Horticulture, Bidhan Chandra KrishiViswavidyalaya, Nadia, West Bengal, India. Sixteen germplasms of banana collected from various states of India (Table 1) were studied for their genetic diversity and relationship. Young leaves from nursery grown randomly selected plant as well as its donor plants, were taken for genomic DNA isolation.
Plant DNA isolation
Fresh, green tender leaf samples were collected from the field and were immediately wrapped in aluminum foil and stored until the material reached the laboratory. The samples were washed thoroughly and dried with tissue paper. Approximately, 100 mg of laminae (with partially intact petioles) was taken and immediately transfer to precooled (-50°C) mortar following excision from the plant and the tissue stored at –50°C for at least 30 min. The leaf tissue was grinded as quickly as possible and DNA was extracted following the standard procedure of CTAB method with slight modification. The samples were then preserved in a refrigerator (4°C) and quantified accordingly.
Optimization of PCR primers
RAPD amplification was performed in 25 µl of reaction mixture that contained template DNA 2.0 µl, 10x PCR buffer 2.5 µl, 2.5 mMdNTPs 2.0µl, primer 1.0 µl, 2.5 mM MgCl2 2.0 µl, Taq polymerase enzyme 0.3 µl, and ddH2O 13.0 µl. The PCR reaction mixture of 25 µl was then set for the reaction in PCR machine. The amplification was performed in a thermal cycler (Mastercycler, Eppendorff, AG22331, Germany). The gel was photographed under UV light transillumination (Gel Doc, Biotech, Yercaud, Salem, India). The 20 ng DNA sample and 30 µl polymerase enzyme was used.
Screening of primers
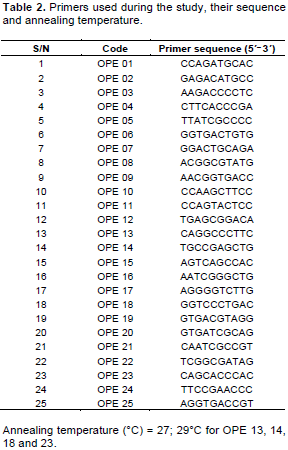
Altogether, 25 random decamer oligonucleotide primers (Eurofins Genomics, Bengaluru, India) were screened for the study (Table 2).
Agarose gel preparation and gel electrophoresis
Agarose (SRL, India, cat≠ 01441Q) was dissolved in 100 ml of IX TAE buffer which was then boiled in microwave oven (Godrej, GMG22B) for 3 min and allowed to cool to 60°C and solidified on gel tray (GeneiTM). In each PCR tube, 2.5 µl of 10x gel loading dye was added. The tube was spinned for 3 s in a centrifuge (Mastercycler, Eppendorff, AG22331, Germany) and loaded onto the agarose gel. The gel was run at constant 80 volts till the dye front moved a distance of about 2/3 from the loading point. The photograph was taken in Geldoc (Biotech, Yercaud,Salem, India).
1% agarose gel was used to perform this operation.
Statistical analysis
Cluster analysis was done to identify a smaller number of groups such that the genotypes residing in a particular group were more similar to each other than to genotypes belonging to other groups (Singh and Chowdhury, 1985). Grouping in the present study was done by Tocher method (Rao, 1952) with the help of Mahalanobis (1936) method. The dendrogram was generated using unweighted pair group arithmetic mean method (UPGMA) using NTSYS pc version 2.1 software for classifying under several clusters.
Evaluation of parameters for PCR
Initially, three different parameters namely, Taq DNA polymerase concentration, MgCl2 concentration and primer concentration were examined with fixed amount of Musa spp. template DNA (2.0 µl). Optimum concentration was selected based on clear banding pattern. It was observed that a combination of 1.0 µl of primer and 0.3 µl of Taq DNA polymerase gave the best results with addition of 2.0 µl MgCl2 (25 mM) in the reaction mixture which improved the banding pattern.
Annealing temperature
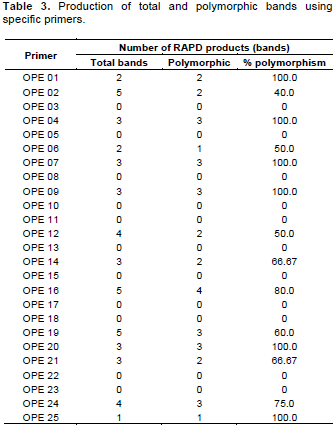
In a separate set of experiments, a regime of two different annealing temperatures (27 and 29°C) were tested (Table 2) with four standardized concentration primers (OPE-01, OPE-02, OPE-04 and OPE-07) and Taq DNA polymerase with cultivars of Musa spp. A clear and prominent banding pattern was recorded at these two different annealing temperatures (Table 3), and it was observed that OPE 1, 4, 7, 9, 20 and 25 showed 100% polymorphism.
Template DNA
For optimization of template DNA, concentrations such as 1.0, 2.0 and 3.0 µl reaction mixtures were used. Among the different reaction mixtures, 2.0 µl performed best amplification. Lower or higher concentrations either reduced amplification or produced smearing. Therefore, in the subsequent experiments 2.0 µl template DNA concentration was used. In all the aforementioned reactions, a control was set up, which contained all the constituents of reaction mixture except template DNA that was replaced by the exact amount of sdH2O.
Screening of primers
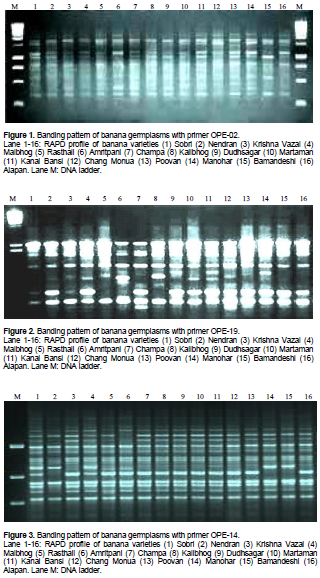
As mentioned earlier, 25 random decamer (10 base pair) oligonuclieotide sequences (primers) were screened for sixteen germplasms of banana to study the robustness of amplification, reproducibility, and scorability of banding patterns. As a result from the 25 primers, 11 did not produce any polymorphic bands and 1 gave only one band. The RAPD primers showed that higher degree of polymorphism (Table 3 and Figures 1 to 3) were used to identify the genotypes under study and those showing no polymorphism were not suitable for study purpose.
Grouping of varieties into cluster
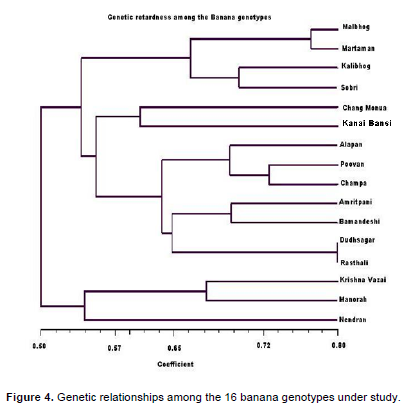
The dendrogram (Figure 4) was generated using unweighted pair group arithmetic mean method (UPGMA) using NTSYS pc version 2.1 software and resulted in eight major clusters. From the clustering pattern of the genotypes, it revealed that the 16 genotypes were grouped into eight clusters that is, Malbhog, Martaman, Kalibhog and Sobri- Cluster-I; Alapan, Poovan and Champa- Cluster II; Amritpani, Bamandeshi- Cluster III; Dudhsagar, Rasthali- Cluster IV; Krishna Vazai, Manohar- Cluster V; Chang Monua- Cluster VI; Kanai Bansi- Cluster VII and Nendran- Cluster VIII.
Analysis of polymorphism
The 25 random 10-mer primers yielded more than 327 scorable polymorphisms. However, the 10 decamer oligonucleotide primers produced reproducible bands (Table 3). They generated 46 amplification products of which 34 bands (73.91%) were polymorphic. The number of bands per primer varied between 1 to 5, with an average of 3.29 bands per primer. However, the range of polymorphic bands per primer was 1 to 4, with a mean of 2.43 polymorphic bands per primer (Table 3). The representative RAPD patterns generated by primers OPE-01, OPE-02, OPE-04, OPE-06, OPE-07, OPE-09, OPE-12, OPE-14, OPE-16, OPE-19, OPE-20, OPE-21, OPE-24 and OPE-25 are illustrated in this research article.
The number of individual samples considered in this study might not truly represent the total available diversity of Musa of this region; nevertheless, the percentage of polymorphic bands (73.91%) of RAPD marker in the species was higher than some other plants such as Changium smyrnioides (69%) (Fu et al., 2003), Lactoris fernandeziana (24.5%) (Brauner et al., 1992), Cathaya argyrophylla (32%) (Wang et al., 1996). The numerical value also suggested that the species genetic diversity was high and hence enables it to adapt to environmental variations.
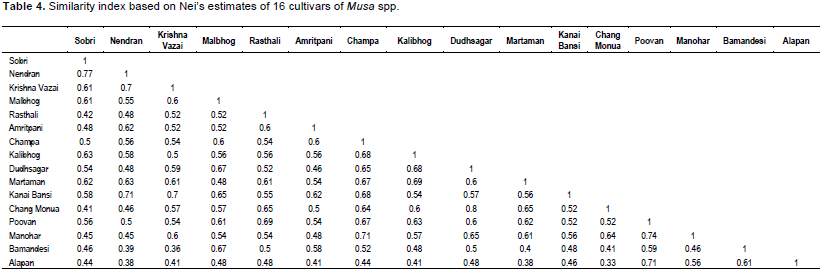
The isolates of banana were subjected to PCR analysis where 14 universal primers resulted in robust and reproducible DNA fragment patterns. The selected primers generated numerous bands but, 327 distinct and reproducible were considered for analysis. Each primer showed polymorphic banding pattern. The genetic similarity between the isolates of banana was determined on the basis of Jaccard’s similarity coefficient. The highest genetic similarity was observed between Dudhsagar and Rasthali isolates, ranging from 80%. Malbhog and Martaman showed 77% similarity, whereas Poovan and Champa depicted high level of similarity i.e, 74%. Amritpani and Bamandeshi showed 69% similarity. Krishna Vazai and Manohar showed 67% similarity which may be a potential of such a high degree of similarity. There was 65% similarity between the two sub clusters Malbhog and Martaman (familiar in West Bengal and also originated here) and Kalibhog and Sobri (also collected from West Bengal). There was 60% similarity depicted between Chang Monua and Kanai Bansi, both of them made a sub cluster (Figure 4). Kanai Bansi and Chang Monua gave just 60% similarity. The lowest degree of similarity was shown between Nendran and Chang Monua i.e. 50% (high degree of dissimilarity) which is in broad agreement with the geographical distribution of these two genotypes (These two were collected from various location, Nendran from Kerala and Chang Monua were collected from West Bengal) and moreover, this can be attributed to the broad genetic base in the origin of the species. This similarity coefficient values of banana in this study is higher or in the same range with respect to other reported species such as Panax ginseng (19.7 to 49.1%) (Um et al., 2001), Poa trivialis (7 to 74%) (Rajasekar et al., 2006), Rhododendron spp. (26.2-90.6%) (Lanying et al., 2008), Lathyrus sativus (13-66%) (Sedehi et al., 2008), Common bean (19 to 91%) (Tiwari et al., 2005), Ensete ventricosum (16 to 85%) (Birmeta et al., 2002).
The degree of polymorphism revealed in populations by amplification with arbitrary primers is extensive. The degree of polymorphism in this study might be due to the wide geographical origin of the genotypes. A dendrogram constructed based on shared fragments revealed broad existence of clusters. In general, the clustering concurs with the place of collection of different genotypes. It can also be opined that Dudhsagar and Rasthali are same genotypes as revealed by their maximum similarity coefficient. Essentially little morphological variation between then misleads us to treat them as different landraces.
The present study addressed the utility of RAPD markers in revealing genetic relationships at molecular level among landraces of Musa spp. of North Bengal and North Eastern, Southern and Eastern part of India. The RAPD polymorphism may be attributed to the outcome of a nucleotide change that alters the prime-binding site or an insertion or deletion within the amplified region (Williams et al., 1993). The RAPD markers were able to distinguish groups among the banana cultivars in different clusters. The polymorphism showed by RAPD has been problematic due to their dominance. As heterozygotes are not normally detectable, the results are not readily usable for computing Hardy Weinberg equilibrium or Nei’s standard genetic distance (Lynch and Milligan, 1994). The level of polymorphism observed in the present study (Table 4) was moderately high, indicating a wide and diverse genetic base for the banana landraces in various parts of India. The 73.91% RAPD polymorphic bands suggest that banana landraces maintain a higher intra-specific genetic diversity which is very important for future breeding programme to generate good quality germplasms in the context of climate change and environmental hazards (Maji and Das, 2008; Maji, 2013; Singh et al., 2013; Soni et al., 2013a, b; Kumar et al., 2013). The conventional classification of banana genotypes into distinct genome combinations based on their morphological similarity is as follows Musa acuminate Colla or Musa balbisiana Colla. The difficulty faced in the identification of banana cultivars, which are mostly sterile, therefore highlights the need for a DNA marker system for classification (Loh et al., 2000). The DNA fingerprinting pattern would help in the identification of duplications among accessions in the field.

The present study clearly concluded that there was a wide genetic variation in the banana germplasms collected from various parts of India. 14 RAPD markers (OPE-01,OPE-02, OPE-04, OPE-06, OPE-07, OPE-09, OPE-12, OPE-14, OPE-16, OPE-19, OPE-20, OPE-21, OPE-24 and OPE-25) were best among the 25 markers screened. The RAPD markers were able to distinguish groups among the banana cultivars in eight different clusters among the selected genotypes namely Cluster I- Malbhog, Martaman, Kalibhog and Sobri; Cluster II- Alapan, Poovan and Champa; Cluster III-Amritpani, Bamandeshi; Cluster IV- Dudhsagar, Rasthali; Cluster V- Krishna Vazai, Manohar; Cluster VI- Chang Monua; Cluster VII- Kanai Bansi and Cluster VIII- Nendran.
The authors have not declared any conflict of interests.
Authors would like to express their sincere thanks to Dr. J. Tarafdar for availing the molecular lab facility and Mr. Govind, Research Scholar, Babasaheb Bhimrao Ambedkar University, Uttar Pradesh, India for preparing the manuscript.
REFERENCES
|
Anonymous (2014). FAO Database.
View
|
|
|
|
Anonymous (2015). NHB Database. pp. 34-40.
View
|
|
|
|
|
Bairu MW, Fennell CW, Van Staden J (2006). The effect of plant growth regulators on somaclonal variation in Cavendish banana (Musa AAA cv. 'Zelig'). Sci. Hort. 108:347-351.
Crossref
|
|
|
|
|
Bhat KV, Bhat SR, Chandel KPS (1992). Survey of isozyme polymorphism for clonal identification in MusaEsterase, acid phosphatase and catalase. J. Hort. Sci.67:501-507.
Crossref
|
|
|
|
|
Bhat KV, Jarret RL, Liu ZW (1994). RFLP characterization of Indian Musa germplasm for clonal identification and classification. Euphytica. 80:95-103.
Crossref
|
|
|
|
|
Bhat KV, Jarret RL (1995). Random amplified polymorphic DNA and genetic diversity in Indian Musa germplasm. Genet. Res. Crop Sci. 42:107-118.
Crossref
|
|
|
|
|
Bhat KV, Jarret RL, Chandel KPS, Lakhanpaul S, Ali S (1995). DNA fingerprinting in Musa cultivars with oligodeoxyribonucleotide probes specific for the simple repeat motifs. Genet. Anal.12:45-51.
Crossref
|
|
|
|
|
Birmeta G, Nybom H, Bekele E (2002). RAPD analysis of genetic diversity among clones of the Ethiopian crop plant Enseteventricosum. Euphytica 124:315-325.
Crossref
|
|
|
|
|
Brauner S, Crawford DJ, Stuessy TF (1992). Ribosomal DNA and RAPD variation in the rare plant family Lactoridaceae. Am. J. Bot. 79:1436-1439.
Crossref
|
|
|
|
|
Cheesman EE (1948). Classification of bananas IIIc Musa paradisiaca Linn. And Musa sapientum Linn.Kew Bull. 2:146-153.
|
|
|
|
|
Crouch HK, Crouch JH, Jarret RL, Cregan PB, Ortiz R (1998). Segregation of microsatellite loci from haploid and diploid gametes in Musa. Crop Sci. 38:211-217.
Crossref
|
|
|
|
|
Crouch JH, Crouch HK, Constandt H, Van Gysel A, Breyne P, Van Montagu M, Jarret RL, Ortiz R (1999). Comparison of PCR-based molecular marker analyses of Musa breeding populations. Mol. Breed. 5:233-244.
Crossref
|
|
|
|
|
Damasco OP, Graham GC, Henry RJ, Adkins SW, Smith MK, Godwin ID (1996). Random amplified polymorphic DNA (RAPD) detection of dwarf off-types in micropropagated Cavendish (Musa spp. AAA) bananas. Plant Cell Reports. 16:118-123.
Crossref
|
|
|
|
|
Finalet J, Peteira B, Leon O, Ventura JCM, Lopez J (2000). Application of RAPD markers to the differentiation of Musa spp. mutants.Revista de Proteccion Vegetal. 15:60-63.
|
|
|
|
|
Fu C, Qiu Y, Kong H (2003). RAPD analysis for genetic diversity in Changiumsmyrnioides (Apeaceae) and endangered plant. Botanical Bull. Academic Sinica. 44:13-18.
|
|
|
|
|
Godwin ID, Aitken EAB, Smith LW (1997). Application of inter simple sequence repeat (ISSR) markers to plant genetics. Electrophoresis.18:1524-1528.
Crossref
|
|
|
|
|
Grajal-Martin M, Siverio-Grillo G, Marrero-Dominguez A (1998). The use of randomly amplified polymorphic DNA (RAPD) for the study of genetic diversity and somaclonal variation in Musa. Acta Hort. 490:445-454.
Crossref
|
|
|
|
|
Grapin A, Noyer JL, Carreel F, Dambler D, Baurens FC, Lanaud C, Lagoda PJL (1998). Diploid Musa acuminate genetic diversity assayed with sequence tagged microsatellite sites. Electrophoresis 19:1374-1528.
Crossref
|
|
|
|
|
Hautea DM, Molina GC, Balatero CH, Coronado NB, Perez EB, Alvarez MTH, Canama AO, Akuba RH, Quilloy RB, Frankie RB, Caspillo CS (2004). Analysis of induced mutants of Philippine with molecular markers, in: Jain, S.M., Swennen, R. (Eds.). Banana Improvement: Cellular, Molecular Biology and Induced Mutations.
|
|
|
|
|
Horry JP, Dolozel J, Dolezelova M, Lysak MA (1998). 'Do natural A X B tetraploid bananas exist?'. Infomusa. 7:5-6.
|
|
|
|
|
Howell EC, Newbury HJ, Swennen RL, Withers LA, Ford-Lloyd BV (1994). The use of RAPD for identifying and classifying Musa germplasm. Genome 37:328-332.
Crossref
|
|
|
|
|
Jain PK, Saini ML, Pathak H, Gupta VK (2007). Analysis of genetic variation in different banana (Musa species) variety using random amplified polymorphic DNAs (RAPDs). Afr. J. Biotechnol. 6:1987-1989.
Crossref
|
|
|
|
|
Jarret RL, Gawel NJ, Wittermore A 1992. RFLP- based phylogeny of Musa species in Papua New Guinea. Theor. Appl. Genet. 84:579-584.
Crossref
|
|
|
|
|
Jenny C, Carreel F (1997). Revision on banana taxonomy: 'KlueTiparot' (Musa spp.) reclassified as a triploid. Fruits. 52:83-91.
|
|
|
|
|
Kaemmer D, Afza R, Weising K, Kahl G, Novak FJ (1992). Oligonucleotide and amplification fingerprinting of wild species and cultivars of banana (Musa spp.).Biotec. 10:1030-1035.
Crossref
|
|
|
|
|
Kaemmer D, Fischer D, Jarret RL, Baurens FC, Grapin A, Dambier D, Noyer JL, Lanaud C, Kahl G, Lagoda PJP (1997). Molecular breeding in the genus Musa: a strong case for STMS marker technology. Euphytica 96:49-63.
Crossref
|
|
|
|
|
Kumar D, Ram RB, Kumar S, Maji S, Kumar M (2013). Variability and physio-chemical studies in snap melon (Cucumismelovar. Momordica). The Asian J. Hort. 8:751-753.
|
|
|
|
|
Lakshmanan V, Sreedhar RV, Bhagyalakshmi N (2007). Molecular analysis of genetic stability in long-term micropropagated shoots of banana using RAPD and ISSR markers. Elec. J. Biotechnol. 10:17-22.
Crossref
|
|
|
|
|
Lanaud C, Tezenas du Montcel H, Jolivot MP, Glaszmann JC, Gonzalez De Leon D (1992). Variation in ribosomal gene spacer length among wild and cultivated bananas. Heredity 68:148-156.
Crossref
|
|
|
|
|
Lanying Z, Yongqing W, Li Z (2008). Genetic diversity and relationship of Rhododendron species based on RAPD analysis.American-Eurasian J. Agric. Environ. Sci. 3:626-631.
|
|
|
|
|
Loh JP, Kiew K, Set O, Gan LH, Gan YY (2000). Amplified fragment length polymorphism fingerprinting of 16 banana cultivars (Musa cvs.). Mol. Phylogenet. 17:360-366.
Crossref
|
|
|
|
|
Lynch M, Milligan BG (1994). Analysis of population genetic structure with RAPD markers. Mol. Ecol. 3:91-99.
Crossref
|
|
|
|
|
Mahalanobis PC (1936). On the generalized distance in statistics. Proceeding of National Institute of Sci. (India) 2:49-55.
|
|
|
|
|
Maji S, Das BC (2008). Quality improvement of guava: an organic approach. J. Asian Hort. 4(3):191-195.
|
|
|
|
|
Maji S (2013).Different Farming Options to Reduce Pesticide Load in Crop and Environment, in: Chattopadhyay, T., Bhowmik, B. (Eds.) Green Chemistry and sustainable Agriculture Practices: a Step towards a Better Future, E-Publishing Inc., Council for MS Academic pp. 45-65.
|
|
|
|
|
Nsabimana A, Van Staden J (2007). Assessment of genetic diversity of highland bananas from the National Banana Germplasm Collection at Rubona, Rwanda using RAPD markers.Sci. Hort. 113:293-299.
Crossref
|
|
|
|
|
Onguso JK, Kahangi ME, Ndiritu WD, Mizutani F (2004). Genetic Characterization of cultivated bananas and plantains in Kenya by RAPD markers. Sci. Hort. 99:9-20.
Crossref
|
|
|
|
|
Oselebe HO, Tenkouano A, Pillay M, Obi IU, Uguru MI (2006). Ploidy and genome segregation in Musa breeding populations assessed by flow cytometry and randomly amplified polymorphic DNA markers. J. Am. Soc. Hortic. Sci.131, 780-786.
|
|
|
|
|
Pillay M, Nwakanma DC, Tenkouano A (2000). Identification of RAPD markers linked to A and B genome sequences in Musa L. Genome. 43:763-767.
Crossref
|
|
|
|
|
Rajasekar S, Fei S, Christians NE (2006). Analysis of genetic diversity in rough bluegrass determined by RAPD markers. Crop Sci. 46:162-167.
Crossref
|
|
|
|
|
Rao CR (1952). Advanced Statistical Methods in Biometric Reaserch.John Willey and sons, New York.
|
|
|
|
|
Ray T, Dutta I, Saha P, Das S, Roy SC (2006). Genetic stability of three economically important micropropagated banana (Musa spp.) cultivars of lower Indo-Gangetic plains, as assessed by RAPD and ISSR markers.Plant Cell Tiss. Org. Cul. 85:11-18.
Crossref
|
|
|
|
|
Robinson JC (1996). Bananas and Plantains.Crop production Science in Horticulture. 5- Willingford, U.K., CAB International.
|
|
|
|
|
Sedehi AAV, Solooki M, Arzani A, Ghanbari A, Lotfi A, Lmamjomeh AA, Bahrami S (2008). Comparative ananlysis of genetic diversity among grass pea landraces as detected by random, semi random and morphological markers. Asian J. Plant Sci. 7:454-460.
Crossref
|
|
|
|
|
Simmonds NW, Shepherd K (1955). Taxonomy and origins of cultivated bananas. J. Linn. Soc. Bot. 55:302-312.
Crossref
|
|
|
|
|
Singh P, Kumar S, Maji S, Singh A (2013). Genetic variability, heritability and genetic advance in cauliflower (Brassica oleracea var. botrytis L.). Int. J. Plant Sci. 8:179-182.
|
|
|
|
|
Singh RK, Chowdhury BD (1985). Biometrical methods in quantitative genetic analysis.Kalyani Publishers pp. 224-252.
|
|
|
|
|
Soni S, Kumar S, Maji S (2013a). Correlation and path coefficient analysis studies for the yield and its traits in cabbage (Brassica oleraceavar Capitata L.). Annals Hort. 6:331-336.
|
|
|
|
|
Soni S, Kumar S, Maji S, Kumar A (2013b). Heritability and genetic advance in Cabbage (Brassica oleraceavar. Capitata L.) under Lucknow condition.HortFlora Res. Spectrum 2:274-276.
|
|
|
|
|
Tiwari M, Singh NK, Rathore M, Kumar N (2005). RAPD markers in the analysis of genetic diversity among common bean germplasm from central Himalaya.Genet.Resour. Crop Evol. 52:315-324.
Crossref
|
|
|
|
|
Toruan-Mathius N, Haris N (1999). Induction of genetic variation of banana cv. Nangka by gamma Co-60 irradiation and fusaric acids. Menara Perkebunan 67:13-22.
|
|
|
|
|
Um JY, Chung HS, Kim MS, Na HJ, Kwon HJ, Kim JJ, Lee SJ, Lim JP, Do KR, Hwang WJ, Lyu YS, An NH, Kim HM (2001). Molecular authentication of Panax ginseng species by RAPD analysis and PCR-RFLP. Biol. Pharmaceut. Bull. 24:872-875.
Crossref
|
|
|
|
|
Uma S, Siva SA, Saraswathi MS, Manickavasagam M, Durai M, Durai P, Selvarajan R, Sathiamoorthy S (2006). Variation and intraspecific relationships in Indian wild Musa balbisiana (BB) population as evidenced by random amplified polymorphic DNA. Genet. Resour. Crop Evol. 53:349-355.
Crossref
|
|
|
|
|
Wang XQ, Zou YP, Zhang DM, Hong DY (1996). RAPD analysis for genetic polymorphisms in Cathaya argyrophylla Sci. China 26:437-441.
|
|
|
|
|
Welsh J, McClelland M (1990). Fingerprinting genomes using PCR with arbitrary primers. Nucleic Acids Res.18:7213-7218.
Crossref
|
|
|
|
|
Williams JGK, Hanafey MK, Rafalski JA, Tingey SV (1993). Genetic analysis using random amplified polymorphic DNA markers. Methods Enzymol. 218:704-740.
Crossref
|
|
|
|
|
Williams JGK, Kubelik AR, Livak KJ, Rafalski JA, Tingey SV (1990). DNA polymorphisms amplified by arbitrary primers as useful genetic markers. Nucleic Acids Res.18:6531-6535.
Crossref
|
|
|
|
|
Wong C, Kiew R, Loh JP, Gan LH, Set O, Lee SK, Lum S, Gan YY (2001). Genetic diversity of the wild banana Musa acuminate Colla in Malaysia as evidenced by AFLP. Ann. Bot. 88:1017-1025
Crossref
|
|