ABSTRACT
Wheat is grown worldwide because it is a major diet component. The aim of this study was to investigate the genetic variation in bread wheat (Triticum aestivum L.) when grown in the Wollo highland areas, applying agro-morphological data and gliadin content. A total of twenty accessions of bread wheat received from Ethiopian Biodiversity Institute (EBI), Sirinka Agricultural Research Centre (SARC) and also newly collected accessions were planted in a randomized complete block design, starting mid-January, 2014, using irrigation. Agro-morphological data was recorded following the International Plant Genetic Resources Institute (IPGR) descriptors list, and the gliadin content was examined by acid page electrophoresis. Analysis of variance showed that most agro-morphological data varied significantly between accessions. By using both dendrogram based on agro-morphological traits and cluster analyses of gliadin, the accession 226944 and the landrace Debalit were found to cluster closely. Newly collected accessions and EBI accessions showed higher diversity than released varieties applying Nei’s genetic distance and gene diversity (H*) analysis. Accessions originating from the West part of the South Wollo province were found to be grouped together, applying principal component analysis. It can be concluded that high genetic variability exists on the bread wheat genotypes, some of them holding exceptionally promising values, making them interesting for further selection.
Key words: Acid page electrophoresis, agro morphological traits, Ethiopia, genetic variability, gliadin, Triticum aestivum.
Wheat is grown on more land area worldwide than any other crop and is rated third to rice and corn in total world
production (Western Organization of Resource Councils (WORC), 2002). Wheat is grown on more than 240 million ha and the world trade is greater than for all other crops combined. Wheat is a major diet component due to the wheat plant’s agronomic adaptability, ease of grain storage and ease of converting grain into flour for making edible, palatable, interesting and satisfying food (Food and Agricultural Organization (FAO), 2002; Asif et al., 2005). Considering all the Triticum species (as will be seen later), it is a major food crop and supporting 35% of the world population (Schuster et al., 2009; Sehgal et al., 2012). In Ethiopia, the crop ranks third in terms of total production, next to teff and maize (Hailegiorgis et al., 2011).
Ethiopian wheat belongs to the following species: Triticum (T) diccoccum, T. turgidum, T. polonicum, T. durum, T. aestivum, T. compactrim and T. abyssinicum. Nowadays, most of the wheat grown in Ethiopia is bread wheat (T. aestivum (Central Statistics Agency (CSA), 2013). Ethiopia is the second largest wheat producer in sub-Saharan Africa after South Africa. Most parts of Ethiopia are wheat producing, however, the most suitable area falls between 1900 to 2700 m.a.s.l (Hailu et al., 2006). Wheat is mainly grown in the highlands, planted in the summer before the main rainy season, and harvested in October to November. Seventy-five percent of the wheat is grown in Arsi, Bale, Shoa and Wollo provinces (CSA, 2013). Wheat production in Ethiopia in the 2012 to 2013 season accounted for 3,434,706 tons, with 888,569 tons in Amhara region and 130,595 tons in south Wollo zone specifically (CSA, 2013). Although Ethiopia has seen relatively steady improvement in wheat production in recent years, both in the amount of arable land cultivated and the per hectare yields, the growth has been a fraction of what it could be with more focused extension efforts in place (ATA, 2013), including a better understanding of impact of water resources (Valipour 2012; 2014a, b, c, d, e, 2015a, b, c, d; Valipour et al., 2015).
Wheat storage proteins, namely gliadins and glutenins, are the main components of gluten, which is the main contributor to the rheological and bread-making properties of wheat (Branlard et al., 2001; Johansson et al., 2013). Glutenin subunits are classified as high molecular weight (HMW) and low molecular weight (LMW) subunits on the basis of their mobility in sodium deodocyle sulphate poly acrylamide gel electrophoresis (SDS-PAGE). Glutenins confer elasticity to dough, whereas gliadins are viscous and give extensibility to dough (Payne et al., 1984).
Gliadins are heterogeneous mixtures of single-chained polypeptides with a molecular weight range of 30,000 to 75,000 Da. Due to extensive polymorphism, these proteins have been widely used for cultivar identification in hexaploid and tetraploid wheat’s (Payne et al., 1984). Allelic variants differ in the number, mobility, and intensityof their components and can be characterized through acid poly acrylamide gel electrophoresis (A-PAGE) (Tatham and Shewry, 1985) or SDS-PAGE (Damania et al., 1983).
Various researchers from Ethiopia have made investigations on genetic diversity of wheat, applying molecular (Tsegaye and Tessema, 1995; Hailu et al., 2005), agro morphology (Tessema et al., 1991; Bechere et al., 1996; Hailu et al., 2006; Hailegiorgis et al., 2011) and protein quality (Dessalegn et al., 2011) methods. Quantitative diversity analysis of wheat shows that the coefficient of variation differs between regions both for tetraploid and hexaploid wheat, thereby being an indication of different levels of variation within the region (Bekele, 1984). Most of the studies have focussed on analysing the genetic distance between few varieties of samples collected from the central part of the country mainly/only.
The aim of this study was to evaluate genetic variation in various wheat materials originating from different areas of Ethiopia by growing them in the South Wollo province. We had the hypothesis that genetic variation analysis may vary in relation to the areas the field trials are carried out. The present wheat material has not been evaluated previously in the Wollo province. Furthermore, suitable genotypes for a certain environment have to be evaluated in the same environment as most characters are not only influenced by the genotype but also of the environment in which they are grown. Three landraces originating from the Wollo province, and not evaluated before, were included in the study. In order to study genetic variation originating from the specific cultivation regions with genetic variation not being influenced by the environment, both agro-morphological traits and specific protein composition analysis were carried out to study the genetic variation.
Plant materials and experimental site
A total of twenty genotypes of bread wheat (Triticum aestivum L.), that consisted of ten accession obtained from the Ethiopian Biodiversity Institute (222815, 212648, 222853, 222680, 243696, 243697, 243704, 7506, 7565, 226944), three landraces collected by Dimiru Tilahun from the South Wollo administrative province (namely: Jiru, Tikur Sinde, and Debalit), and seven released varieties (Dinknesh, ET-13A, Menze, Sora, Tsehay, Tossa, Warkaye) obtained from Sirinka Agricultural Research Centre (SARC), were used for this study. The field experiment to collect the data on agro-morphology and seeds for gliadin analysis was carried out at the Wollo University Dessie campus. The site is located at 11° 10' 10'' North and 38° 39' 16'' East, and at an elevation of 2475 m above sea level, 406 km north of Addis Ababa. The area receives annual rainfall ranging from 900 to 1400 mm and temperature range from 12.5 to 27°C. The analysis of gliadin composition was carried out at Ethiopian Biodiversity Institute (EBI) laboratory at Addis Ababa on July, 2014.
Experimental design
The field experiment was laid out in a randomized complete block design with three replications starting from January and ending in July, 2014. The plots sizes were 2 m × 1.2 m with a row distance of 20 cm and between plants 5 cm in six rows. Data was taken from the middle four rows and used for the analysis. Fertilizer was applied as per the recommendation of the Ministry/Bureau of Agriculture (150 kg DAP and 150 kg UREA ha-1) (Ministry of Agriculture and Rural Development (MoARD), 2012).
Data collection
The data was recorded at maturity and grain yield was measured after measuring moisture content. In order to allow us to see fine details of changes, all the data were transformed to log10 before analysis.
Agro-morphological data
Observations on yield and yield attributing characters were recorded. In each plot, eight random plants were tagged to record these observations and mean values of the recorded values were calculated. The descriptions of characters studied was based on International Plant Genetic Resources Institute (IPGR) (1985) descriptors list that include days to heading (DH), days to maturity (DM), number of tillers (NT), plant height (PH), spike length (SPL), number of spikelet’s per spike (NSPSP), number of grains per spike (GNPS), thousand kernel weight (TKWT), grain yield (GYPP), biomass yield per plot (BMYPP), presence or absence of Awn (AW), and grain number per spike (GNPSP).
Storage protein methodology - gliadin
The assessment of storage protein composition was carried out according to Tatham and Shewry (1985) with some modifications. Twenty four spikes from the randomly tagged plants of each accession were taken and threshed independently and conserved in a seed bags. After taking to EBI, A-PAGE was used to examine the composition of gliadin content based on the mobility of gliadin bands of wheat genotypes used for the study and bands were scored as present (1) or absent (0).
Data analysis
Analysis of variances (ANOVA), dendrogram (cluster) and principal component analysis (PCA) were applied on the agro-morphological data using the SAS software program (SAS, 2004). Nei’s (1973) genetic diversity and cluster analysis were carried out using POPGEN version 1.31 and TFPGA version 1.3, respectively, based on gliadin bands composition.
Agro-morphological variation
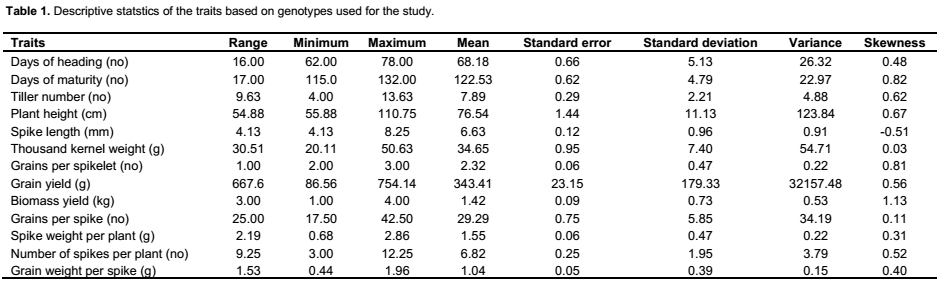
The genotypes showed variation based on agro-morphological traits (Table 1). For example, plant height averaged 76.53 cm and
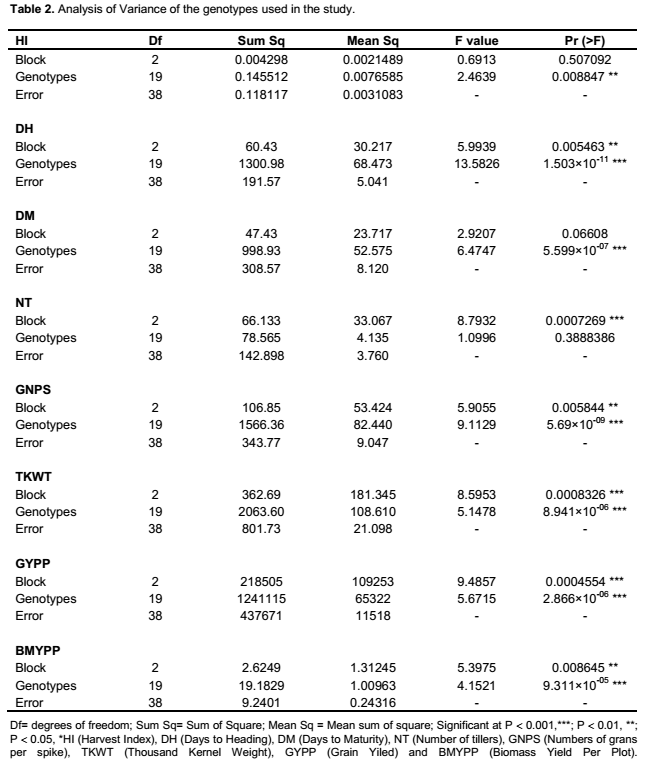
ranged from 55.9 to 110.8 cm; while days to heading averaged 68.18, with a range of 62 to 78. Significant variation was found both among genotypes and blocks for all characters except tiller number for genotype, days to harvest, and plant height for blocks applying ANOVA (Table 2). Similar to the findings in the present study of genetic variation in agro-morphological traits, previous studies have shown genetic variation in grain number per spike and grain weight per spike (Zecevic et al., 2010), plant height, number of productive tillers per plant, number of spikelet’s per spike, spike length, number of grains per spike, fertility percent, thousand kernel weight and yield per plant (Ali et al., 2008). The present study showed correlation between yield and several of the morphological traits known to be components determining the yield, including number of grains per spikelet, number of tillers, biomass, spike weight, harvest index, number of seed per spikelet, disease score and number of grains per spike (result not shown). A previous study has shown correlation between yield and 19 other morphological traits (Ojaghi and Akhundova, 2010). It is well known that yield is a polygenic trait and that such traits are related to several other interacting traits. Benefits can be acquired by the use of other traits that are strongly correlated with the yield, indirectly increasing the yield (Johnson and Wichern, 2002; Hailu et al., 2005).
Morphological traits such as plant height, plant development, maturation time etc have been used to determine the genetic distance between and within varieties (Hailu et al., 2006, 2010). Morphological traits have been used for selection of suitable plants since ancient times, although lately a combination with molecular markers is more common (Hailu et al., 2005). Morphological markers are inexpensive and simple to score as they are based on distinct phenotypes such as plant colour, plant height, seed characteristics, etc. but the main disadvantage of such markers is that in studies of genetic diversity, the expression of the phenotypes is highly influenced by environmental conditions (Ahmadi et al., 2012).

In the present study, we combined the morphological data with composition of gliadins in the material. Gliadin composition is a character that does not vary over environments (Huebner and Bietz, 1988) and it is a stable genetic character that can be used for analysis of genetic variation. Futhermore, protein composition in wheat materials are of large relevance as they determine baking and pasta making quality attributes in wheat (Johansson et al., 2005, 2008, 2013). The knowledge about the genetic relationships of genotypes provides useful information to address in breeding programs and germplasm resource management (Aharizad et al., 2012). Furthermore, an understanding of water resource requirements in relation to agronomic properties plays a role for the variation (Valipour, 2013).
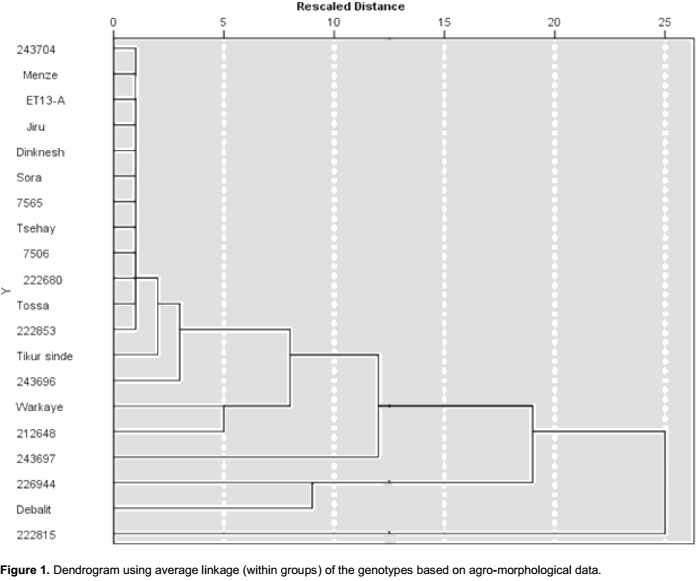
Cluster analysis using agro morphological traits
Cluster diagram based on Euclidean dissimilarity using complete linkage method, at the rescaled distance of 10, categorized the genotypes into two major groups (Figure 1) whereas 222815 and 243697 were left solitary (ungrouped with the other accessions). Cluster one contains two genotypes, Debalit and 226944, while cluster two contain 16 genotypes. If rescaled distance instead is selected to be 5, the large cluster consisted of 14 genotypes, while all other genotypes were left solitary (Figure 1). Genetic diversity using cluster mean analysis by Euclidean dissimilarity dendrogram has also been reported previously in other studies (Ali et al., 2008; Shahryari et al., 2011; Aharizad et al., 2012; Ahmadi et al., 2012; Degwoine and Alamrew, 2013;). The dendrogram elaborate the relative magnitude of resemblance among the genotypes as well as the clusters (Singh et al., 2014).

The present result showed that all released varieties except Workaye were grouped in the large group of 14 genotypes that were grouped at the rescaled distance of 5. The landraces/accessions obtained from EBI did not group closer with each other than they did with the released varieties, indicating that the landraces were not closely genetically related than their genotypic relationships were with the varieties. The accession 222815 was the one most distantly related to the other genotypes.
Storage protein analysis
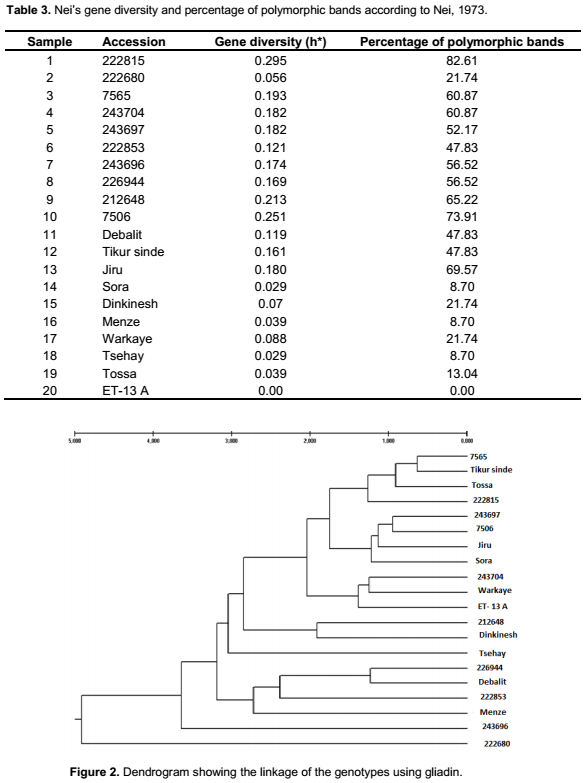
The highest Nei’s gene diversity, 0.295, was observed in accession 222815, one of the landraces obtained from EBI, while the lowest value was found in the released variety ET-13A (0.00). Both the accessions obtained from EBI and the three local varieties showed comparatively higher Nei’s gene diversity compared to the released varieties (Table 3). Thus, similarly as has been found in previous studies (Hailu et al., 2010), the general highest gene diversity was found among landraces while the lowest gene diversity was found among released varieties in the present study, which might be expected as variety development by breeding is supposed to result in a pure variety. However, even bred varieties can sometimes lack uniformity (Husenov et al., 2015).
In the present study, the percentage of polymorphic bands in the accessions ranged from 21.74% (222680) to 82.61% (222815); for the new collections from 47.83% (Debalit and Tikur sinde) to 69.57% (Jiru). The released varieties showed the lowest percentage of polymorphic bands from 0.00% (ET-13A) to 21.74% (Dinkinesh and Warkaye). Metakovsky and Branlard (1998) reported that genetic diversity in genotypes can be determined by electrophoretic patterns of gliadin in the genotypes. Variation of wheat proteins is also used for determination of gluten strength and bread-making quality (Malik et al., 2013). Determination of gliadin is therefore useful not only in genotype identification but also in breeding programs (Bushuk and Zillman, 1978). Specific gliadin composition of genotypes is free from environmental factors making this an easy and convenient method in evaluation of germplasm variability, for pure seed productions in hexaploid wheat (Murat et al., 2013). Thus one of the reasons to use variation in gliadin composition for evaluation of genetic diversity is that these proteins are highly polymorphic, while their composition is not influenced by the environment but only by genetic variation (Huebner and Bietz, 1988). The information from gliadin analyses can also be combined for a better understanding of bread-making quality in the material (Johansson et al., 2013). Thus, their analyses in the present paper will help to identify genetically determined variation and also to compare if similar variation is obtained with agro-morphological data, the later also affected by the environment (Fufa et al., 2005; Ali et al., 2013).
Cluster and PCA analysis based on gliadin composition
By following the method by Zarkti et al. (2010), setting the distance for clustering to 2.5, the cluster analysis using gliadin showed that sample 222680, Tsehay, Menz and sample 243696 were left solitary (Figure 2). The other genotypes were clustered into three clusters. Debalit, 222853 and 226944 were clustered in cluster one; Dinknesh and Sora were clustered in cluster two; and the rest grouped together in cluster three, although clustering in three clusters at the distance for clustering of 1.50. While comparing the dendrogram based on agro-morphological traits with the cluster from cluster analyses of gliadins some similarities were recorded (Figures 1 and 3). One accession in both analyses was found to be the most distantly related genotype. Furthermore, the accession 226944 and the landrace Debalit were found to cluster closely in both analyses.

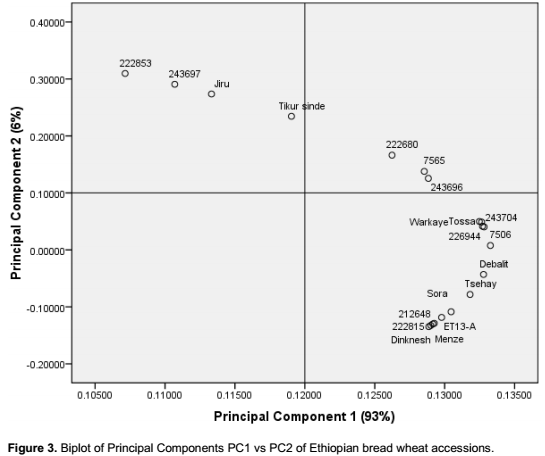
Principal component analysis (Figure 3) based on gliadin composition showed accession number 222853, 2
43697, and the landraces Jiru and Tikur sinde to be the most different compared to the other genotypes analysed, the rest were mainly grouped into a large group (Figure 3). Passport data of the four mentioned genotypes showed that they are all collected from the Western part of the South Wollo administrative province. One nice idea would have been to make a more thorough analysis of the correlation between genetic distance among the genotypes and the geographical distribution of the genotypes as to distance separating their origin. However, the passport data of the genotypes did not allow such a comparison. Results in both cluster and principal component analysis showed the presence of variations between germplasm especially among accessions, although the same genotypes were not obviously the most distantly related ones with the different analyses. Khodadadi et al. (2011) states that cluster analysis based on principal component analysis is a more precise indicator of differences among wheat genotypes than cluster analysis not based on principal component analysis. In the present study used cluster analysis based on principal component analysis to be able to clearly see differences among genotypes.
This study on bread wheat showed that there was a significant variation between genotypes from EBI (accessions), SARC (released) and new collections using both agro-morphological and gliadin analysis. Different methods applied indicated various genotypes to be most distantly related as compared to the other genotypes. However, the study was able to reveal presence of genetic variation, both including and excluding environmental interactions in the investigated wheat material. Thus, the investigated wheat can thereby be utilized as sources to improve the bread wheat at country wide level thereby helping to alleviate poverty in the country for the future.
The authors have not declared any conflict of interests.
The authors are grateful to Department of Biology, Wollo University for hosting this work and Ethiopian Institute of Biodiversity for allowing their lab to be used to carry out the storage protein composition analysis and for providing seed samples.
REFERENCES
|
Ali Y, Atta BM, Akhter J, Monneveux P, Lateef Z (2008). Genetic variability, association and diversity studies in wheat (Triticum aestivum L.) germplasm. Pak. J. Bot. 40:2087-2097.
|
|
|
|
Ali S, Khan G, Zia Kumar B, Yousuf M, Roomi T, Ahmad MF (2013). Estimation of Genetic Diversity in Genetic Stocks of Common Wheat (Triticum aestivum L.) Using SDS-PAGE, Europ. Acad. R. 1:1861-1871.
|
|
|
|
|
Aharizad S, Sabzi M, Abolghansem SA, Kohadadadi E (2012). Multivariate analysis of genetic diversity in wheat (Triticum aestivum L.) recombinant inbred lines using agronomic traits. Schol. R. Libr. 3:2119-2121.
|
|
|
|
|
Ahmadi M, Farshadfar E, Veisi S (2012). Evaluation of genetic diversity in land races of bread wheat under irrigated and rain fed conditions. Int. J. Agric. Crop Sci. 4:1627-1636.
|
|
|
|
|
Asif M, Rahman M, Zafar Y (2005). DNA fingerprinting studies of some wheat (Triticum aestivum L.) genotypes using random amplified polymorphic DNA (RAPD) analysis. Pak. J. Bot. 372:71-277.
|
|
|
|
|
ATA (2013).
View (accessed in July 10, 2013).
|
|
|
|
|
Bechere E, Belay G, Mitiku D. Merker A (1996). Phenotypic diversity of tetraploid wheat landraces from the Northern and North- Central regions of Ethiopia. Hereditas 24:165-172.
Crossref
|
|
|
|
|
Bekele E (1984). Analysis of regional patterns of phenotypic diversity in the Ethiopian tetraploid and hexaploid wheats. Hereditas 100:131-154.
Crossref
|
|
|
|
|
Branlard G, Dardevet M, Saccomano R, Lagoutte F, Gourdon J (2001). Genetic diversity of wheat storage proteins and bread wheat quality. Euphytica 119:59-67.
Crossref
|
|
|
|
|
Bushuk W, Zillman RR (1978). Wheat cultivar identification by gliadin electrophoregrams. I. Apparatus, method and nomenclature. Can. J. Plant Sci. 58:505-5010.
Crossref
|
|
|
|
|
CSA (2013). Central Statistics Authority, crop report data.
|
|
|
|
|
Damania AB, Porceddu E, Jackson MT (1983). A rapid method for the evaluation of variation in germplasm collections of cereals using polyacrylamide gel electrophoresis. Euphytica 32:877-883
Crossref
|
|
|
|
|
Degwione A, Alamrew S (2013). Genetic diversity in bread wheat genotypes (Triticum aestivum L.) genotypes. Pak. J. Biol. Sci.10:3923- 3929.
Crossref
|
|
|
|
|
Dessalegn T, Deventer CSV, Labuschagne MT, Martens H (2011). Allelic variation of HMW glutenin subunits of Ethiopian bread wheat varieties and their quality. Afr. Crop Sci. J. 19:55-63.
Crossref
|
|
|
|
|
FAO (2002). Organic agriculture, environment and food security. El-Hage NS, Hattam C, eds. Environment and Natural Resources Series, no. 4. Rome, FAO.
View
|
|
|
|
|
Fufa H, Baenziger PS, Beecher I, Dweikat V, Graybosch RA, Eskridge KM (2005). Comparison of phenotypic and molecular marker-based classifications of hard red winter wheat cultivars. Euphytica 145:133- 146.
Crossref
|
|
|
|
|
Hailegiorgis D, Mesfin M, Genet T (2011). Genetic divergence analysis on some bread wheat genotypes grown in Ethiopia. J. Central Eur. 12:344-342.
Crossref
|
|
|
|
|
Hailu F, Johansson E, Merker A (2010). Patterns of phenotypic diversity for phenologic and qualitative traits in Ethiopian tetraploid wheat germplasm. Genet. Resour. Crop Evol. 57:781-790
Crossref
|
|
|
|
|
Hailu F, Merker A, Belay G, Johansson E (2005). Molecular diversity and phylogenic relationships of tetraploid wheat species as revealed by Inter-Simple Sequence Repeats (ISSR) from Ethiopia. J. Genet. Breed. 59:329-338.
|
|
|
|
|
Hailu F, Merker A, Hargit-Singh, Belay G, Johansson E (2006). Multivariate analysis of diversity of tetraploid wheat germplasm from Ethiopia. Genet. Res. Crop Evol. 53:1089-1098.
Crossref
|
|
|
|
|
Huebner FR, Bietz JA (1988). Quantitative variation among gliadins of wheat grown in different environments. Cereal Chem. 65:362-366.
|
|
|
|
|
Husenov B, Makhkamov M, Garkava-Gustavsson L, Muminjanov H, Johansson E (2015). Breeding for wheat quality to assure food security of a staple crop: The case study of Tajikistan. Agric. Food Secur. 4:9.
Crossref
|
|
|
|
|
IPGR (1985). International Plant Genetic Resource Centre for Wheat descriptors.
|
|
|
|
|
Johansson E, Kuktaite R, Andersson A, Prieto-Linde ML (2005). Protein polymer built-up during wheat development: Influences of temperature and nitrogen timing. J. Sci. Food Agric. 85:473-479.
Crossref
|
|
|
|
|
Johansson E, Prieto-Linde M-L, Gissén C (2008). Influences of weather, cultivar and fertilizer rate on grain protein accumulation in field-grown wheat, and relations to grain water content and falling number. J. Sci. Food Agric. 88:2011-2018.
Crossref
|
|
|
|
|
Johansson E, Malik AH, Hussain A, Rasheed F, Newson WR, Plivelic T, Hedenqvist MS, Gällstedt M, Kuktaite R (2013). Wheat gluten polymer structures: The impact of genotype, environment and processing on their functionality in various applications. Cereal Chem. 90:367-376.
Crossref
|
|
|
|
|
Johnson RA, Wichern DW (2002). Applied Multivariate Statistical Analysis. Prentice Hall, Upper Saddle River, NJ.
|
|
|
|
|
Khodadadi M, Fokian MH, Miransari M (2011). Genetic diversity of wheat (Triticum aestivum L.) genotypes based on cluster and principal component analyses for breeding strategies. Austr. J. Crop Sci. 5:17-24.
|
|
|
|
|
Malik AH, Kuktaite R, Johansson E (2013). Combined effect of genetic and environmental factors in accumulation of proteins in wheat grain and their relationships to bread-making quality. J. Cereal Sci. 57:170-174.
Crossref
|
|
|
|
|
Metakovsky EV, Branlard G (1998). Genetic diversity of French common wheat germplasm based on gliadin alleles. Theor. Appl. Genet. 96:209-218.
Crossref
|
|
|
|
|
MoARD (Ministry of Agriculture and Rural Development) (2012). Crop variety register issue No. 15. Crop Development Department, Addis Ababa Ethiopia.
|
|
|
|
|
Murat O, Imren K, Ayter NG, Ozcan Y, Zekiye B (2013). Determination of genetic diversity in bread wheat (T. aestivum L.) by agronomic and quality traits and SDS-PAGE method. Glob. J. Sci. Frontier Res. 13:975-987.
|
|
|
|
|
Nei M (1973). Analysis of gene diversity in subdivided population (population structure/ genetic variability/heterozygosity/gene differentiation). Proc. Nat. Acad. Sci. USA 70:3321-3323.
Crossref
|
|
|
|
|
Ojaghi J, Akhundova E (2010). Genetic diversity in doubled haploids wheat based on morphological traits, gliadin protein patterns and RAPD markers. Afr. J. Agric. Res. 5:1701-1712.
|
|
|
|
|
Payne PI, Holt LM, Jackson EA, Law CN (1984). Wheat storage proteins: Their genetics and their potential for manipulation by plant breeding. Phil. Trans. R. Soc. Lond. 304:359-371.
Crossref
|
|
|
|
|
SAS (2004). SAS/STAT TM Users guide. SAS Institute Inc., Cary, NC, USA.
|
|
|
|
|
Sehgal AS, Tahir RA, Nawaz M, Younas M (2012). Genic microsatellite markers for genetic diversity of rust resistant wheat genotypes. J. Biochem. Tech. 4:480-484.
|
|
|
|
|
Schuster I, Vieira ESN, da Silva GC, de Assis FF, Marchioro VS (2009). Genetic variability in Brazilian wheat cultivars assessed by micro satellite markers. Genet. Mol. Biol. 32:557-563.
Crossref
|
|
|
|
|
Singh P, Singh AK, Sharma M, Salgotra SK (2014). Genetic divergence study in improved bread wheat varieties (Triticum aestivum). Afr. J. Agric. Res. 9:507-512.
Crossref
|
|
|
|
|
Shahryari R, Mahfoozi B, Mollasadeghi V, Khayatnezhad M (2011). Genetic diversity in bread wheat for phenological and morphological traits under terminal drought stress condition. J. Adv. Environ. Biol. 5:169-172
|
|
|
|
|
Tatham AS, Shewry PR (1985). The conformation of wheat gluten proteins. The secondary structure and thermal stabilities of the alpha-, beta-, gamma- and omega gliadins. J. Cereal Sci. 3:103-113.
Crossref
|
|
|
|
|
Tsegaye S, Tessema T (1995). The genetics of some isozyme variants in tetraploid wheats (Triticum turgidum L.). Hereditas 2:147-154.
Crossref
|
|
|
|
|
Tessema T, Belay G, Worede M (1991). Morphological diversity in tetraploid wheat landrace populations from the Central highlands of Ethiopia. Hereditas 114:171-176.
|
|
|
|
|
Valipour M (2012). Hydro-module determination for Vanaei village in Eslam Abad Gharb, Iran. ARPN J. Agric. Biol. Sci. 7:968-976.
|
|
|
|
|
Valipour M (2013). Need to update irrigation and water resources information according to the progresses of agricultural knowledge. Agro Technol. S10-001.
Crossref
|
|
|
|
|
Valipour M (2014a). Irrigation status of Americas. Adv. Appl. Agric. Sci. 2:56-72.
|
|
|
|
|
Valipour M (2014b). Handbook of water engineering problems. Foster City, CA: OMICS Oress. USA. ISBN:978-1-63278-015-7.
|
|
|
|
|
Valipour M (2014c). Prediction of irrigated agriculture in Asia Pacific using FAO indices. Acta Adv. Agric. Sci. 2:40-53.
|
|
|
|
|
Valipour M (2014d). Pressure on renewable water resources by irrigation to 2060. Acta Adv. Agric. Sci. 2:32-42.
|
|
|
|
|
Valipour M (2014e). Future of agricultural water management in Europe based on socioeconomic indices. Acta Adv. Agric. Sci. 2:1-18.
|
|
|
|
|
Valipour M (2015a). Assessment of important factors for water resources management in European agriculture. J. Water Res. Hydraul. Eng. 4:171-180.
Crossref
|
|
|
|
|
Valipour M (2015b) What is the tendency to cultivate plants for designing cropping intensity in irrigated area? Adv. Water Sci. Technol. 2: 01-12.
|
|
|
|
|
Valipour M (2015c) Variations of irrigated agriculture inidcators in different continents from 1962 to 2011. Adv. Water Sci. Technol. 1:01-14.
|
|
|
|
|
Valipour M (2015d) Handbook of irrigation engineering problems. Foster City, CA: OMICS Oress. USA. ISBN:978-1-63278-012-6.
|
|
|
|
|
Valipour M, Sefidkouhi MAG, Eslamian S (2015) Surface irrigation simulation models: a review. Int. J. Hydrol. Sci. Technol. 5:51-70.
Crossref
|
|
|
|
|
WORC (2002). World Organization of Resource Council, Annual Report.
|
|
|
|
|
Zarkti H, Ouabbou H, Hilali SM, Udupa A (2010). Detection of genetic diversity in Moroccan durum wheat accessions using agro-morphological traits and microsatellite markers. Afr. J. Agric. Res. 5:1837-1844.
|
|
|
|
|
Zecevic V, Boskovic J, Dimtrijevic M, Petrovic S (2010). Genetic and phenotypic variability of yield components in wheat (Triticum aestivum L.). Bulgar. J. Agric. Sci. 16:422-428.
|
|