Full Length Research Paper
ABSTRACT
Chenopodium quinoa Willd. is an edible crop plant adapted to the climatic conditions of the South American Andes, where it thrives under extreme environmental conditions such as saline soils, drought, high UV radiation and broad temperature fluctuations. The prolonged exposure of this crop to high salinity and low relative humidity has promoted the development of efficient mechanisms to retain water within the intracellular compartments and avoid desiccation, including accumulation of osmoprotectants. In this study, the effect of osmotic stress (250 mM KCl) was evaluated on osmolyte accumulation at different phenological stages of quinoa growth (branched, panicle, flowering) compared to control (0 mM KCl). The osmotic stimulus increased the concentrations of proline, glycine betaine, sucrose, fructose, glucose, and trehalose two- to seven-fold compared to a low salinity conditions. This is the first report to show significant increase in trehalose in response to osmotic disturbance at three different phenological stages of quinoa growth, opening a new avenue to explore the protective role of trehalose against osmotic-induced damage in this crop.
Key words: Compatible solutes, osmotic stress, quinoa, phenology.
INTRODUCTION
In the face of climate change, soil salinization, and a rising world population; the research and development of effective approaches to produce stress tolerant food crops of high nutritional quality is of increasing importance (Delorge et al., 2014). Quinoa (Chenopodium quinoa Willd., Amaranthaceae) is a seed crop high in nutritional value that has achieved rising global demand in recent years and holds promise as an alternative crop for the promotion of food security (Vega-Galvez et al., 2010; Lutz et al., 2013; Graf et al., 2016;). Native of the Andean Altiplano of South America, quinoa is adapted to thrive in regions characterized by intense abiotic stresses, including saline soils, low precipitation, frequent drought, temperature fluctuations from -4 to 27°C, and strong winds (Arenas and Lanino, 2008). Agronomists have recently begun to expand quinoa production to other regions with unique abiotic stress patterns throughout Africa, Asia, and North America (Graf et al., 2016).
Soil salinity is one of the major abiotic stresses affecting crop growth and yield (Wang et al., 2003). About 830 million hectares of land have been identified as salt-affected soils around the world (Rengasamy, 2006). Salt stress impedes crop growth, development, and yield by inducing an osmotic effect and ion toxicity (Delatorre-Herrera and Pinto, 2009; Adolf et al., 2013), each of which differentially affect plant physiology (Delatorre-Herrera and Pinto, 2009). Salt-tolerant plants employ complex defense mechanisms, including osmoregulation, ion homeostasis, activation of antioxidant systems (Hasegawa et al., 2000), and accumulation of soluble sugars such as glucose, fructose, sucrose and trehalose (Ancillotti et al., 2015).
Quinoa is a facultative halophytic plant that has adapted physiological mechanisms to provide osmoregulation in highly saline environments (300 mM NaCl or more) including the production of compatible solutes, also known as osmoprotectants (Morales et al., 2011; Adolf et al., 2013). Compatible solutes, such as soluble sugars, proline, and glycine betaine, adjust the osmotic potential of plant tissue to cope with the high accumulation of salt without disrupting essential physiological processes, enzyme functions, or cell membrane integrity (Morales et al., 2011). Previous studies have shown that quinoa seedlings or young plants demonstrated increased sucrose, glucose, fructose, proline, and glycine betaine content under salt stress (NaCl levels 450 mM) compared to normal conditions (Rose et al., 2009; Morales et al., 2011). The accumulation of these compatible solutes has also been observed in many other plant species, including sugar beet, rice, potato (Ghoulam et al., 2002; Boriboonkaset et al., 2013).
However, quinoa is unique to most other crop plants in that this species has recently been shown to produce detectable levels of trehalose under salt stress (450 mM NaCl) (Morales et al., 2011). Trehalose is a thermostable, non-reducing disaccharide composed of two glucose units linked by an ï¡ï€¬ï¡ï€ -1,1,-glycosidic bond (Higashiyama, 2002) that was previously thought to be restricted to only a few higher plants, including the salt-tolerant resurrection plants Myrothamnus flabellifolius and Selaginella lepidophylla (Fernandez et al., 2010). Trehalose functions in these plants to protect and stabilize cytoplasmic and membrane proteins by establishing hydrogen bonds that replace water during dehydration, and by crystallizing in a glassy state to prevent the denaturation of biomolecules (Elbein et al., 2003; Fernandez et al., 2010). Trehalose has also been well-documented to confer osmoregulation and stress resistance in bacteria, fungi, and invertebrates. (For example, Escherichia coli synthesizes large amounts of trehalose when placed in a high osmolarity environment; Saccharomyces cerevisiae accumulates trehalose during exposure to hydrogen peroxide; the nematode Aphelenchus avenae converts up to 20% of its dry weight to trehalose during dehydration (Elbein et al., 2003).
Though the trehalose biosynthetic genes have been documented in higher plants for which genomes have been sequenced, detectable levels of trehalose have not been observed in most higher plants (Goddijn and van Dun, 1999; Avonce et al., 2005). Given the role of trehalose as an effective osmoprotectant, edible plants which naturally produce trehalose are of increasing interest as alternative crops in extreme environments.
Trehalose accumulation has been rarely studied as a stress tolerant mechanism in plants (Fernandez et al., 2010; Tsai and Gazzarrini, 2014). It has been suggested that the genome of C. quinoa encodes functional genes associated with trehalose metabolism, because trehalose content increases under high saline conditions (Morales et al., 2011). However, the accumulation of trehalose and other carbohydrates has not been investigated in different stages of quinoa growth under osmotic stress. It was hypothesized that trehalose levels increase in response to osmotic stimulus during all quinoa phenological growth stages.
This study measured the accumulation of trehalose and other osmolytes (sucrose, glucose, fructose, glycine, betaine and proline) in quinoa plants grown under KCl-induced osmotic stimulus compared to non-stimulated plants at three different phenological growth stages: branched, the stage when the quinoa plant first produces axillary branches; panicle, the stage when the quinoa plant produces flower buds, and flowering, the stage when flowers buds within the panicle open.
MATERIALS AND METHODS
Plant
The seed used in this study was a white variety of quinoa (accession no. 28) initially obtained from Cariquima in the Tarapacá province of the northern Chilean Altiplano and stored at Arturo Prat University, Iquique, Chile. This seed variety was selected for the study because it is well adapted to the sandy, saline soils of Cariquima, a region located at 3,800 m above sea level with less than 300 mm annual rainfall (Becares and Bazile, 2009).
Experimental design
KCl was used to avoid the effect of ionic stress and the nutritional imbalance caused by sodium and to induce only an osmotic stress (Munns et al., 1995; Delatorre-Herrera and Pinto, 2009). A randomized block design was implemented with two treatment groups: KCl treatment (250 mM) and a control group (0 mM KCl). Each treatment group comprised four blocks each containing eight quinoa plants (32 plants per treatment). Quinoa plants were grown in a hydroponic perlite system, according to the method described elsewhere (Delatorre-Herrera and Pinto, 2009). Quinoa seeds were sown directly in perlite plastic containers (4 L volume) and initially irrigated with a nutrient solution using a cotton wick (Delatorre-Herrera and Pinto, 2009). The nutrient solution, formulated as described previously (Schlick and Bubenheim, 1993), was changed once a week. The temperature of the greenhouse was set to 27 to 2°C during cultivation, and the aeration flow of the culture system was continuous throughout the test. The photoperiod applied was environmental, that is between 12 and 13 h of light. The treatments were applied at 2 weeks when the plants had 2 true leaves and were prolonged until the end of the trial (approximately 120 days). The plants in the KCl treatment group were irrigated with the same nutrient solution as the controls with the addition of 250 mM KCl. KCl was used to reduce osmotic potential of the nutrient solution to -0.8 MPa, as described elsewhere (Delatorre-Herrera and Pinto, 2009; Panuccio et al., 2014;), whereas the control group exhibited an osmotic potential of -0.1 MPa. KCl was chosen for salt treatment, instead of NaCl, because KCl can reduce osmotic potential and thereby induce osmotic stress without leading to sodium-induced plant toxicity. Osmotic potential of the nutrient solution was monitored with an osmometer (Advanced Instrument, INC, Mod. 3320), throughout the study to maintain osmotic stress treatment.
Plant growth was monitored every two days to verify the phenological stage throughout the experiment. Plant samples were collected at three different phenological growth stages (branched, panicle and flowering) as described elsewhere (Delatorre-Herrera and Pinto, 2009; Panuccio et al., 2014). During the branched stage, apical buds from three or four plants (500 mg dry weight) were randomly collected for analysis of osmotic potential, leaf water potential, proline, glycine betaine, and sugar concentrations.
Analysis of osmotic potential and leaf water potential
The leaf osmotic potential (Ψs) was determined from fresh leaf samples (0.1 g) that were ground with a mortar and pestle in 1.5 mL of ultrapure water. The mixture was centrifuged at 1,000 ×g for 10 min. The supernatant was analyzed with an osmometer (Advanced Instrument, INC, Mod. 3320). The data was transformed to osmotic potential according to the van´t Hoff equation (Ghneim-Herrera et al., 2006).
The leaf water potential (LW) was measured in a pressure chamber as described elsewhere (Scholander et al., 1965). The pressure of neutral gas required to induce an exudate from the leaf was measured and expressed in negative Mega Pascal units (-MPa).
Analysis of proline and glycine betaine content
Proline content was measured as previously described (Bates et al., 1973). Briefly, 50 mg of lyophilized leaf tissue was smashed and mixed with sulfosalicylic acid (3% w/v). The mixture was centrifuged at 10,000 ×g at 4°C and the supernatant was mixed with acetic acid and ninhydrin. The solution was heated at 90°C for 1 h and transferred to ice for 30 min. This solution was vigorously mixed with toluene in a ratio of 5:1 for 30 s. The toluene phase was analyzed using a spectrophotometer (Mecasys MOD: OptizenPOP) at 520 nm. A proline standard (Merck) curve was performed with concentration of 10, 20, 50, 100 and 200 mg/mL.
Glycine betaine content was determined as described previously (Grieve and Grattan, 1983) with minor adaptations (Delatorre-Herrera and Pinto, 2009). Briefly, 0.1 g dry matter was stirred in 4 mL of distilled water for 24 h at 25°C. Then, the mixture was filtered and stored at -4°C. For determining quaternary complex, extract was thawed and 50 μL was mixed with 50 μL of 2 N sulfuric acid. Then, the mixture was chilled to 0°C, and 40 μL of KI-I2 (15.7 g iodine and 20 g of potassium iodide in 100 mL of distilled water) was added with gentle shaking on a vortex. This solution was stored at -4°C for 16 h, and centrifuged at 10,000 ×g for 15 min. The supernatant was carefully aspirated and the pellet was dissolved in 1.6 mL of 1,2-dichloroethane, stirred vigorously with a vortex and then allowed to stand for 2.5 h. Samples were read in a spectrophotometer at 365 nm. The calibration curve was performed with pure betaine standard (Merck) at concentrations of 10, 20, 50, 100 and 200 mg/mL diluted in 1,2-dichloroethane.
Sugar analysis
The concentration of individual sugars was measured by high performance liquid chromatography coupled to a refractive index detector (HPLC-RI) as described previously (Singh et al., 1994). Briefly, lyophilized leaf tissue (100 mg dry weight) was ground with mortar and pestle. The powder was homogenized with ethanol 80% (v/v) and the mixture heated to 90°C for 10 min. The mixture was centrifuged at 2,500 ×g for 10 min, and the supernatant was dried via rotary evaporation and resuspended in 1.5 mL of acetonitrile:water (78:22 v/v). The solution was analyzed by HPLC using a Librocart 250-4 column linked to a pre-column Librocart 4-4 at a flow of 1.5 mL/min under isocratic conditions. The mobile phase was acetonitrile:water (78:22 v/v). The detector was a Merck Hitachi Refractive Index Detector LaChrom 7490. The retention times (tR) of standards were 4.22 min (fructose), 4.62 min (glucose), 6.17 min (sucrose), and 8.13 min (trehalose). Calibration curves for each standard (Merck) were used to determine the concentration of each sugar within the samples.
Data analysis
Tukey’s multiple comparison one-way analysis of variance (ANOVA) was performed using GraphPad Prism 6.0 (La Jolla, CA, USA). P < 0.05 was considered significant. Student t-test was performed using Infostat V 2016.
RESULTS
Osmotic potential and leaf water potential
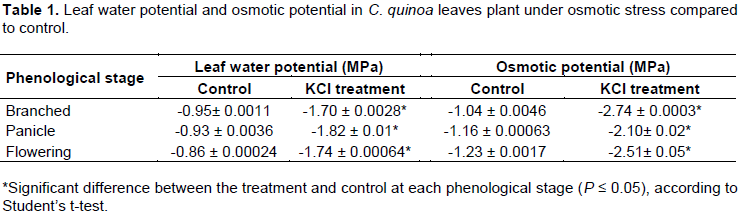
At all phenological growth stages, the osmotic potential of quinoa leaves was significantly lower in KCl treated plants versus control by 81 to 163% (Table 1). This corresponded with a significant 79 to 114% decrease in leaf water potential in KCl treated plants versus control among the three different phenological growth stages (Table 1). Osmotic potentials of the leaves at the branched and flowering stages: -2.74 and -2.51, respectively; were statistically similar, whereas osmotic potential at the panicle stage was significantly higher (-2.10 MPa). Leaf water potentials at the branched, panicle, and flowering stages significantly differed, and values incrementally decreased through successivel stages of plant growth: -1.70 > -1.82 > -1.84 MPa.
Proline and glycine betaine levels
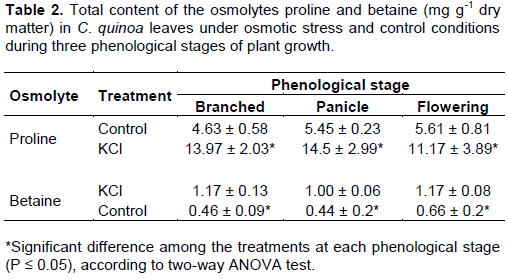
Compared to control plants, proline content significantly increased by 202, 166, and 99% in KCl-treated plants at the branched, panicle, and flowering stages, respectively (Table 2). Glycine betaine content significantly increased by 154, 127, and 77% at the same phenological growth stages. Proline and glycine betaine levels were statistically similar at each phenological growth stage in control and KCl-treated plants, respectively.
Sugar concentrations
Among the four sugars analyzed in quinoa leaves grown in control conditions, fructose generally showed the highest levels among all phenological growth stages (7.51 - 14.85 mg g-1 dry weight), followed by glucose (5.96 - 7.64 mg g-1 dry weight), sucrose (3.24 - 4.72 mg g-1 dry weight), and trehalose (0.96 - 1.13 mg g-1 dry weight) (Figure 1). However, under KCl treatment, glucose showed the highest levels among all phenological growth stages (22.49 - 43.37 mg g-1 dry weight), followed by fructose (16.41 - 24.10 mg g-1 dry weight), sucrose (7.98 - 10.65 mg g-1 dry weight), and trehalose (2.79 - 3.63 mg g-1 dry weight).
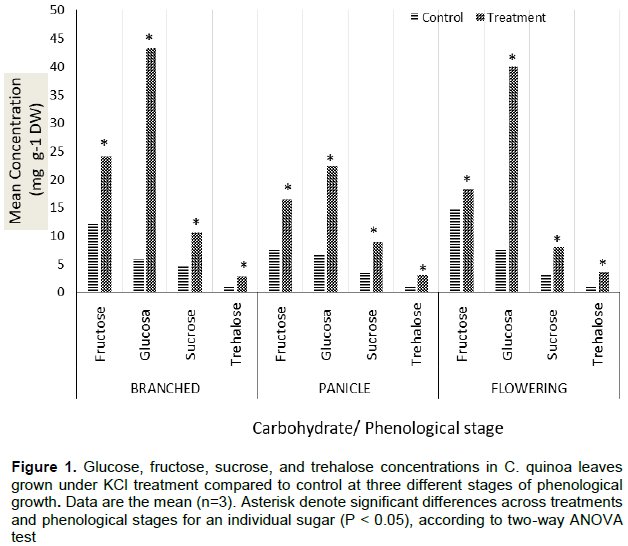
The levels of individual sugars were statistically similar to the levels of the corresponding sugar at each phenological growth stage, except in the case of glucose, in which glucose levels were significantly higher in KCl-treated plants at the branched and flowering stages (40.07 - 43.37 mg g-1 dry weight) than at the panicle stage (22.49 mg g-1 dry weight).
Plants exposed to KCl treatment showed significantly higher levels of all sugars (fructose, glucose, sucrose, and trehalose) compared to those of the control group at all phenological stages. Glucose showed the largest increase, with 628, 240, and 424% higher levels at the branched, panicle, and flowering stages, respectively. Trehalose showed the second greatest increase, with 150, 172, and 280% higher levels at the same phenological growth stages. Sucrose showed the third greatest increase, with 126, 149, and 146% levels at each growth stage, respectively. Among the sugars measured, fructose showed the smallest increases, with 99, 118, and 24% increases at each growth stage.
DISCUSSION
According to our hypothesis, the results showed that 250 mM KCl treatment reduced both the water potential and the osmotic potential of the quinoa leaves, showing that the concentration applied causes a stress condition in the treated plants. The KCl effect on the osmotic potential could be part of the osmotic adjustment of quinoa, by which the plant maintains the gradient of water potential and turgor pressure (Smirnoff, 1998). This osmotic adjustment in quinoa has been widely demonstrated by several authors (Hariadi et al., 2011; Orsini et al., 2011; Ruiz et al., 2015) and has also been described in other plant species, such as sugar beet, rice and corn (Hasegawa et al., 2000; Ghoulam et al., 2002; de Sousa et al., 2016, ).
The reduction in osmotic potential and leaf water potential induced by KCl treatment was correlated with a significant increase in concentrations of compatible solutes in quinoa leaves, including glycine betaine, proline, glucose, fructose, and sucrose (Table 2 and Figure 1). Furthermore, these increases were consistently observed for all compatible solutes across all three phenological stages (branched, panicle, and flowering) (Figure 1). The observed accumulation of these molecules is consistent with literature that reports that proline, glycine betaine, and soluble sugars play roles as osmolytes and salt defense mediators, especially in halophyte species (Gupta and Kaur, 2005; Morales et al., 2011; Boriboonkaset et al., 2013; Ruiz et al., 2015). However, further studies are needed to understand the relative contribution of these osmolytes to the multicomponent response of quinoa to osmotic stress, which also involves the use of salt bladders, ion sequestration, and chaperon protein synthesis (Adolf et al., 2013; Raney et al., 2014).
The results show that there are changes in the concentration of three of the sugars (sucrose, glucose, fructose), in the phenological stages (branched, panicle, and flowering) (Figure 1). Trehalose is the only sugar that does not change in the phenological stages, maintaining a similar concentration in all of the stress conditions.
Sucrose increased 2 to 3 times its concentration in the plants with KCl (osmotic stress) compared to the control treatment (without KCl), the bibliography in general coincides with these results, showing an increase ranging from 2 times, in Atriplex halimus (Hassine and Lutts, 2010), reaching up to 9 times in Vernonia herbaceous (Garcia et al., 2011). Overall, demonstrating that this sugar has a direct participation in the mechanism that plants have to overcome periods of water deficit, since it not only acts as an osmolyte to maintain the osmotic potential of the cells, but also acts to protect the proteins from denaturation (Da Silva and Arrabaca, 2004; Murata et al., 2012). Likewise, a decrease in the concentration of sucrose in the expansion and maturation of cassava leaves (Manihot esculenta) has also been found, this decrease being 60% in maturation and 33% in expansion (Alves and Setter, 2004); in our results it was observed that there was a slight decrease in the concentration of this sugar as the phenological phases arose, showing the lowest concentration in the beginning of flowering stage, which suggests that sucrose could be used as a source of energy for glycolysis by degrading it into glucose and fructose.
Also, the period during which the plant is exposed to stress conditions strongly influences the plant response.
In the present study, the period of exposure was constant and prolonged by four months, which produced high concentrations in glucose and fructose, in the three phenological stages. These results agree with that obtained by García (2004), who observed in tomatoes, that more time of exposure to stress increases concentration of these sugars. Similar results were obtained by Márques and Celeste (2004) who observed an increase of up to ten times in the concentration of these two sugars. Nio et al. (2011), who subjected Triticum aestivum to a prolonged period of water stress, reported an increase in glucose and fructose, but a decrease in sucrose in leaves.
These results are similar to those found in the present study; in each of the phenological stages, sucrose always showed the lowest concentration with respect to glucose and fructose. This could be explained by the low use of fructose for the synthesis of sucroses (Trevanion, 2002). Fructose forms polymers and oligomers with a low percentage of glucose in their structure called fructans, which are the main reserve carbohydrates in some plants and microorganisms (Mancilla and Lopez, 2006). The ability of some plant species to synthesize fructans has been associated with their survival when growing in cold and dry climates, which seems to indicate that they play an important role in the response to stress conditions (Ritsema and Smeeken, 2003). It has been suggested that fructans can stabilize membranes by direct H-bonding to the phosphate and choline groups of membrane lipids, resulting in a reduced water outflow from the dry membranes (Valluru and Van den Ende, 2008). In the present case, it can be seen that the branched stage, when the fructose content increases, this produced the biggest difference between the control and the application of KCl, followed by panicle (Figure 1), these results could indicate the need for the plant to adjust its growth as a consequence of the higher energy requirement for the formation of new organs such as the panicle, a situation that is affected by the stress to which the plants are subjected with KCl application.
On the other hand, the high content of trehalose observed in quinoa plants stressed by salt, with respect to the control, is consistent with the effect observed in C. quinoa ,in the eight-leaf stage by Morales et al. (2011) and in other plants, under similar stress conditions (Da Silva and Arrabaca, 2004; Iordachescu and Imai, 2008; Delorge et al., 2014). However, this phenomenon was further described by studying the effect of KCl across other phenological stages of quinoa growth.
The present experiments showed that, regardless of the phenological stage of C. quinoa, trehalose levels increased in response to the osmotic stimulus induced by KCl (from 1.07 to 3.16 mg g-1 dry weight). Interestingly, the maximum concentrations of trehalose in KCl-treated plants were significantly lower than those of other sugars, such as sucrose and glucose, suggesting that trehalose may function as a signaling molecule, rather than an osmoprotectant (Hasegawa et al., 2000; Avonce et al., 2005). Additionally, trehalose can also act as a structural component when incorporated into glycolipids, in order to stabilize membranes (Elbein and Mitchell, 1973; Elbein, 1974). However, the most important feature of trehalose is the property it possesses to act as a protein stabilizer, when certain organisms are exposed to stress conditions. Trehalose has the ability to associate with membrane proteins and replace the function of water as a protein stabilizer, especially under dehydration conditions (Donnamaria et al., 1994).
The present results show a relationship between the various sugars in the phenological stages. Cortina and Culiañez-Macià (2005) show that in genetically modified (GM) tomatoes to synthesize trehalose, an increase in the concentration of starch is produced in addition to trehalose. The fructose values in the leaves increased from 3.5 mg g-1 for the wild, to 4.9 mg g-1 for the GM, while the glucose concentration was 5.5 mg g-1 in wild plants and 10.5 mg g-1 GM plants.
On the other hand, the concentration of sucrose increased slightly in both wild and modified plants (from 2.9 to 3.1 mg g-1), results similar to those found inthe present study. In yeast, Trehalose-6-phosphate (T-6-P) affects glycolysis and sugar signaling through its interaction with hexokinase, which is a putative sensor (Hohmann and Thevelein, 1995; Paul et al., 2001). Although it remains to be determined whether T-6-P in plants interacts with hexokinase as it does in yeast, T-6-P appears to be important in sugar signalling in plants (Paul et al., 2001). In Arabidopsis thaliana, exogenously applied trehalose induces the ADP-Glucose pyrophosphorylase gene ApL3, and starch synthesis (Wingler et al., 2000). Also, transgenic TPS1 tomato plants accumulate over 60% more starch in their leaves than the tomato control plants. Thus, trehalose biosynthesis appears to affect starch accumulation by inducing directly the components of its starch biosynthetic pathway (Wingler et al., 2000). The synthesis of sucrose is also influenced by the synthesis of trehalose, since the trehalose-6-phosphate, directly affects the levels of sugars in plants (Wingler, 2000; Avonce et al., 2004; Avonce et al., 2005). Fernandez et al. (2010) state that future studies are necessary to establish whether trehalose is increased in specific organs, cells or organelles of quinoa plants, where it may function as a signaling molecule through the trehalose-6-phosphate pathway. Although the present results show only the increase in the phenological stages measured in quinoa, it is possible to associate the results with the appearance of new organs. For example, in the branched stage, there are only branches; however, in the panicle stage reproductive structures are formed and during flowering they add flowers. In this regard we can see that from branches to panicle and flowering, fructose decreases its concentration (Figure 1), which shows the use of fructose as a source of reserve for the growth of other organs.
Regarding trehalose, the concentration in each phenological stage is not increased, so it can be deduced that in this case it does not play a role as a reserve carbohydrate, but probably acts as a signaling or protective molecule.
CONCLUSIONS
Osmotic stress increases proline, glycine betaine, glucose, fructose, sucrose and trehalose leaf contents in C. quinoa.
All the measured sugars (sucrose, fructose and glucose) increase their concentration with an osmotic stress in the different phenological stages.
For each phenological stage, the concentration of trehalose is higher in plants with KCl, than in control plants. Given the low concentration present, trehalose likely acts only as a signaling or protective molecule.
Glucose is the sugar that is present in higher concentrations relative to the control across all three stages of growth, and it particularly increased relative to the control in the stages of branching and flowering. Fructose is the second sugar in relative concentration to the control, and presents greater concentration in branches and panicles.
Trehalose, which has rarely been identified in agricultural crop plants, can be a useful biomarker for saline-resistant quinoa ecotypes. Crops that are adapted to grow in salt-stressed environments are very valuable in the context of global climate change and soil desertification. These molecules may function as osmoprotectants and signaling molecules. Trehalose, which has been rarely identified in agricultural crop plants, may be useful biomarker for salt resistant ecotypes of quinoa.
CONFLICT OF INTERESTS
The authors have no declared any conflict of interest.
ACKNOWLEDGEMENTS
LER was supported by Proyecto FONDECYT 11140915, from CONICYT, Chile. The authors also thank the Doctoral Program in Arid and Desert Agriculture, Arturo Prat University, Iquique, Chile.
REFERENCES
|
Adolf VI, Jacobsen S.E, Shabala S (2013). Salt tolerance mechanisms in quinoa (Chenopodium quinoa Willd.). Environmental and Experimental Botany 92:43-54. |
|
|
Alves A, Setter T (2004). Abscisic acid accumulation and osmotic adjustment in cassava under water deficit. Environmental and Experimental Botany 51(3):259-271. |
|
|
Ancillotti C, Bogani P, Biricolti S, Calistri E, Checchini L, Ciofi L, Gonnelli C, Del Bubba M (2015). Changes in polyphenol and sugar concentrations in wild type and genetically modified Nicotiana langsdorffii Weinmann in response to water and heat stress. Plant Physiology and Biochemistry 97:52-61. |
|
|
Arenas J, Lanino M (2008). Antecedentes agrometeorológicos y de evapotranspiración del sector de Vilacollo, Comuna de Colchane. Revista Agricultura de Desierto 10:22. |
|
|
Avonce N, Leyman B, Mascorro-Gallardo J, Van Dijck P, Thevelein J, Iturriaga G (2004). The Arabidopsis Trehalose-6-P Synthase AtTPS1 Gene Is a Regulator of Glucose, Abscisic Acid, and Stress Signaling. Plant Physiology 136:3649-3659. |
|
|
Avonce N, Leyman B, Thevelein J, Iturriaga G (2005). Trehalose metabolism and glucose sensing in plants. Biochemical Society Transactions 33:276-279. |
|
|
Bates LS, Waldren RP, Teare ID (1973). Rapid determination of free proline for water-stress studies. Plant and Soil 39:205-207. |
|
|
Becares A, Bazile D (2009). La quinoa como parte de los sistemas agrícolas en Chile: 3 regiones y 3 sistemas. Revista Geográfica de Valparaíso 42:61-72. |
|
|
Boriboonkaset T, Theerawitaya C, Yamada N, Pichakum A, Supaibulwatana K, Cha-um S, Takabe T, Kirdmanee C (2013). Regulation of some carbohydrate metabolism-related genes, starch and soluble sugar contents, photosynthetic activities and yield attributes of two contrasting rice genotypes subjected to salt stress. Protoplasma 250(5):1157-1167. |
|
|
Cortina C, Culiá-ez-Macia FA (2005). Tomato abiotic stress enhanced tolerance by trehalose biosynthesis. Plant Science 169:75-82. |
|
|
Da Silva JM, Arrabaca MC (2004). Contributions of soluble carbohydrates to the osmotic adjustment in the C-4 grass Setaria sphacelata: A comparison between rapidly and slowly imposed water stress. Journal of Plant Physiology 161(5):551-555. |
|
|
de Sousa DPF, Braga B, Gondim F.A, Gomes E, Martins K, de Brito POB (2016). Increased drought tolerance in maize plants induced by H2O2 is closely related to an enhanced enzymatic antioxidant system and higher soluble protein and organic solutes contents. Theoretical and Experimental Plant Physiology 28(3):297-306. |
|
|
Delatorre-Herrera J, Pinto M (2009).Importance of ionic and osmotic components of salt stress on germination of four quinua (Chenopodium quinoa Willd.) selections. Chilean Journal of Agricultural Research 69(4):477-485. |
|
|
Delorge I, Janiak M, Carpentier S, Van Dijck P (2014). Fine tuning of trehalose biosynthesis and hydrolysis as novel tools for the generation of abiotic stress tolerant plants. Frontiers in Plant Science P 5. |
|
|
Elbein AD, Pan YT, Pastuszak I, Carroll D (2003). New insights on trehalose: a multifunctional molecule. Glycobiology 13(4):17R-27R. |
|
|
Fernandez O, Bethencourt L, Quero A, Sangwan RS, Clement C (2010). Trehalose and plant stress responses: friend or foe? Trends in Plant Science 15(7):409-417. |
|
|
García D, Petzall C, Castrillo M (2004).Respuestas al deficit hídrico en las variedades de tomate Río Grande y pera Quibor. Agronomía Tropical 54:411-431. |
|
|
García P, Asega A, Silva E, Carvalho M (2011). Effect of drought and re-watering on fructan metabolism in Vernonia herbacea (Vell.) Rusby Plant Physiology and Biochemistry 49:664-670. |
|
|
Ghneim-Herrera T, Rosales A, Aguilar M, Pieters A.J, Pérez-Almeida I, Torrealba G (2006). Identificación de cultivares de arroz con alta capacidad de ajuste osmótico para el mejoramiento genético de la tolerancia a la sequía. Agronomía Tropical 56(4):677-687. Disponible en: |
|
|
Ghoulam C, Foursy A, Fares K (2002).Effects of salt stress on growth, inorganic ions and proline accumulation in relation to osmotic adjustment in five sugar beet cultivars. Environmental and Experimental Botany 47(1):39-50. |
|
|
Goddijn OJM, van Dun K (1999). Trehalose metabolism in plants. Trends in Plant Science 4(8):315-319. |
|
|
Graf BL, Rojo LE, Delatorre-Herrera J, Poulev A, Calfio C, Raskin I (2016). Phytoecdysteroids and flavonoid glycosides among Chilean and commercial sources of Chenopodium quinoa: variation and correlation to physico-chemical characteristics. Journal of the Science of Food and Agriculture 96(2):633-643. |
|
|
Grieve CM, Grattan S.R (1983).Rapid assay for determination of water soluble quaternary ammonium compounds. Plant and Soil 70(2):303-307. |
|
|
Gupta AK, Kaur N (2005). Sugar signalling and gene expression in relation to carbohydrate metabolism under abiotic stresses in plants. Journal of Biosciences 30(5):761-776. |
|
|
Hariadi Y, Marandon K, Tian Y, Jacobsen SE, Shabala S (2011). Ionic and osmotic relations in quinoa (Chenopodium quinoa Willd.) plants grown at various salinity levels. Journal of Experimental Botany 62:185-193. |
|
|
Hasegawa PM, Bressan RA, Zhu JK, Bohnert HJ (2000). Plant cellular and molecular responses to high salinity. Annual Review of Plant Physiology and Plant Molecular Biology 51:463-499. |
|
|
Hassine A, Lutts S (2010). Differential responses of saltbush Atriplex halimus L. exposed to salinity and water stress in relation to senescing hormones abscisic acid and ethylene. Journal of Plant Physiology 167:1448-1456. |
|
|
Higashiyama T (2002).Novel functions and applications of trehalose. Pure and Applied Chemistry 74(7):1263-1269. |
|
|
Hohmann S, Thevelein JM (1995). Trehalose synthase: guard to the gate of glycolysis in yeast?. TIBS 20:3-10. |
|
|
Iordachescu M, Imai R (2008). Trehalose biosynthesis in response to abiotic stresses. Journal of Integrative Plant Biology 50(10):1223-1229. |
|
|
Lutz M, Martinez A, Martinez EA (2013). Daidzein and Genistein contents in seeds of quinoa (Chenopodium quinoa Willd.) from local ecotypes grown in arid Chile. Industrial Crops and Products 49:117-121. |
|
|
Mancilla-Margalli A, López M.G 2006. Water-Soluble Carbohydrates and Fructan Structure Patterns from Agave and Dasylirion Species. Journal of Agricultural and Food Chemistry 54(20):7832-7839. |
|
|
Morales AJ, Baijgain P, Garver Z, Maughan PJ, Udall JU (2011). Physiological responses of Chenopodium quinoa to salt stress. International Journal of Plant Physiology and Biochemistry 3:219-232. |
|
|
Munns R, Schachtman D, Condon A (1995). The significance of a two-phase growth response to salinity in wheat and Barley. Australian Journal of Plant Physiology 22:561-569. |
|
|
Nio SA, Cawthray GR, Wade LJ, Colmer TD (2011). Pattern of solutes accumulated during leaf osmotic adjustment as related to duration of water deficit for wheat at the reproductive stage Plant Physiology and Biochemistry 49:1126-1137. |
|
|
Orsini F, Accorsi M, Gianquinto G, Dinelli G, Antognoni F, Ruiz-Carrasco KB, Martínez EA, Alnayef M, Marotti I, Bosi S, Biondi S (2011). Beyond the ionic and osmotic response to salinity in Chenopodium quinoa: functional elements of successful halophytism. Functional Plant Biology 38:1039 1-14. |
|
|
Panuccio MR, Jacobsen S.E, Akhtar SS, Muscolo A (2014). Effect of saline water on seed germination and early seedling growth of the halophyte quinoa. Aob Plants P 6. |
|
|
Paul M, Pellny T, Goddjin O (2001). Enhancing photosynthesis with sugar signals. Trends in plant science 6:197-200. |
|
|
Raney JA, Reynolds DJ, Elzinga DB, Page J, Udall J, Jellen EN, Maughan PJ (2014).Transcriptome analysis of drought induced stress in Chenopodium quinoa. American Journal of Plant Sciences 5:338-357. |
|
|
Rengasamy P (2006). World salinization with emphasis on Australia. Journal of Experimental Botany 57(5):1017-1023. |
|
|
Ritsema T, Smeekens SCM (2003). Engineering fructan metabolism in plants. Journal of Plant Physiology 160(7):811-820. |
|
|
Rose M, Podazza G, Interdonato R, González JA, Hilal FEP (2009). Soluble sugars—Metabolism, sensing and abiotic stress: A complex network in the life of plants. Plant Signaling and Behavior 4(5):388-393. |
|
|
Ruiz K, Biondi S, Martínez E.A, Orsini F, Antognonie F, Jacobsen SE (2015). Quinoa - a model crop for understanding salt tolerance mechanisms in halophytes. Plant Biosystems 150(2):357-371. |
|
|
Schlick G, Bubenheim D (1993). Quinoa: An emerging"new" crop with potencial for CELSS. NASA. Ames Research Center P 3422. |
|
|
Scholander PF, Bradstreet ED, Hammel EA (1965). Sap Pressure in Vascular Plant: Negative hydrostatic pressure can be measured in plants. Science 148(339):46. |
|
|
Singh R, Karamdeep L, Bhullar S.S, Gupta AK (1994). Metabolism of free sugars in relation to the activities of enzimes involved in sucrose metabolism and nitrogen assimilation in the developing nodules of chickpea. Plant Physiology and Biochemistry 32(6):875-882. |
|
|
Smirnoff N (1998).Plant resistance to environmental stress. Current Opinion in Biotechnology 9:214-219. |
|
|
Trevanion SJ (2002). Regulation of sucrose and starch synthesis in wheat (Triticum aestivum L.) leaves: role of fructose 2,6-bisphosphate. Planta (215):653-665. |
|
|
Tsai AYL, Gazzarrini S (2014). Trehalose-6-phosphate and SnRK1 kinases in plant development and signaling: the emerging picture. Frontiers in Plant Science P 5. |
|
|
Valluru R, Van den Ende W (2008). Plant fructans in stress environments: emerging concepts and future prospects. Journal of Experimental Botany 59(11):2905-2916. |
|
|
Vega-Galvez A, Miranda M, Vergara J, Uribe E, Puente L, Martinez EA (2010). Nutrition facts and functional potential of quinoa (Chenopodium quinoa Willd.), an ancient Andean grain: a review. Journal of the Science of Food and Agriculture 90(15):2541-2547. |
|
|
Wang WX, Vinocur B, Altman A (2003). Plant responses to drought, salinity and extreme temperatures: towards genetic engineering for stress tolerance. Planta 218(1):1-14. |
|
|
Wingler A, Fritzius T, Wiemken A, Boller T, Aesbacher RA (2000). Trehalose induces the ADP-glucose pyrophosphorylase gene, ApL3, and starch synthesis in Arabidopsis. Plant Physiology 124:105-114. |
|
Copyright © 2024 Author(s) retain the copyright of this article.
This article is published under the terms of the Creative Commons Attribution License 4.0


