Full Length Research Paper

ABSTRACT
The low efficiency of nitrogen (N) fertilizers impels the innovation of current N management strategies in cereal production. Site specific N management is an emerging field providing novel alternatives to current nutrient management practices through canopy sensing. Barley N use efficiency can be enhanced with GreenSeeker proximal sensors, whose optimal utilization requires algorithms. The design of such algorithms required four N rates (0, 50, 100 and 150 kg N ha-1) and in-season sensing of barley canopy reflectance using a handheld GreenSeeker sensor as well as crop N analysis. The N rates produced enough variability in yields, N uptake and normalized difference vegetation index (NDVI) readings together with strong determination coefficients between in-season NDVI values on one hand and on the other hand in-season N uptake (R2=0.68, p<0.001), forage yield (R2=0.84, p<0.001), forage N uptake at harvest (R2 = 0.65, p<0.001), grain yields (R2=0.88, p<0.001), and grain N uptake (R2 = 0.84, p<0.001). These factors enabled the development of in-season N fertilizer algorithms for barley grain and forage production. The built algorithms will enable farmers using GreenSeeker sensors to better manage barley N fertilization with positive outcomes for their financial returns and environmental contamination.
Key words: Barley canopy reflectance, nitrogen fertilizer algorithm, GreenSeeker, N use efficiency, normalized difference vegetation index (NDVI), nitrogen uptake.
INTRODUCTION
Barley (Hordeum vulgare L.) is a highly valued cereal around the world but especially in Australia. In the 2013 world food commodity ranking, barley was the 12th most important and the 4th major cereal right behind wheat, rice, and maize (Food and Agricultural Organization (FAO), 2016). The 2014 world production was estimated at 144 million tons, with Australia ranked 4th for its 9.1 million tons (FAO, 2016). Approximately 60% of Australian barley grains is exported as malt, food, and feed with the largest being feed barley (Barley Australia, 2016). The Australian barley industry can maintain or improve its relative dominance in terms of productivity and environmental sustainability by considering nutrient management strategies that enhance N efficiency. Some of these strategies were grounded on the reflectance properties of crop canopies and their correlations with agronomic quantities such as crop biomass, grain yield, and crop N content. These correlations have been used to develop N fertilizer algorithms for in-season fertilization of cereal crops with the aim of maximizing yield and minimizing N losses.
Various investigations have established the strong relationship between barley canopy reflectance and grain yield. One of the earliest studies on barley yield prediction using canopy reflectance was reported in the early 1980s (Pinter Jr et al., 1981). With a handheld radiometer, daily normalized difference vegetation index (NDVI) values of barley canopy were collected at Feekes growth stage (entire ear out of sheath and flowering commencing) to complete senescence. From these daily NDVI values which is a baseline, the NDVI value of a completely senesced barley canopy was subtracted to derive an index that correlated with barley grain yield. This was an advance over a previously cumbersome method that used cumulated green leaf area index from barley heading until maturity to predict grain yield (Watson et al., 1963). Notwithstanding, because this model relied on reflectance measurement at flowering, its use was restrained in predicting grain yield. In the late 1980s, another study compared reflectance factors of single spectral bands and ratios of spectral bands ranging from 400 to 2300 nm on barley (Kleman and Fagerlund, 1987). Although the Infra-red/red ratio strongly correlated with grain yield in the middle of the season, the correlation was inconsistent afterwards. As an alternative approach to improve this correlation, climatic data were suggested and included as input parameters (Kleman and Fagerlund, 1987). Interestingly, about a decade later, a yield prediction model for winter wheat that included growing degree day (GDD) was developed (Raun et al., 2001).
Another vegetation index reported to correlate with barley grain yield is the transformed chlorophyll absorption in reflectance index (TCARI) (Pettersson and Eckersten, 2007). Reflectance was measured at early stem elongation using a hand-held passive sensor. This indicates that TCARI could be used for early yield prediction in barley. However, this also reveals that NDVI, as a sole vegetation index, has not been extensively investigated on barley at early growth stages. Considering that a number of variable rate technology equipment use NDVI, establishing a relationship between NDVI and barley grain yield at early stages of development under Australian conditions would contribute to enhanced barley N efficiency.
An important application of early canopy sensing correlation with yield and N content is the design of in-season N fertilizer algorithms. The N fertilizer algorithm that seems to stand out among others is the N fertilizer algorithm or NFA (Lukina et al., 2001). It has been refined by several other contributors (Freeman et al., 2003; Raun et al., 2005) and evaluated in terms of higher N efficiency and financial returns on such cereal crops as wheat, corn and rice. The NFA was reported to improve the N use efficiency (NUE) by at least 15 and 9%, respectively in winter wheat and corn (Raun, 2002; Tubana et al., 2008). The starting point toward devising N fertilization optimization algorithm (NFOA) developed an index that predicted potential yield based on in-season NDVI readings.
In winter wheat, the potential yield could be predicted at earlier stages of development as Feekes growth stages 4 and 5 (or tillering) by combining NDVI values with GDD (Raun et al., 2001). The estimated yield (EY) was obtained by adding NDVI values at Feekes growth stages 4 and 5 and dividing them by the cumulative GDD between the two measurements. Later, another yield prediction index, the in-season estimate of grain yield (INSEY), was developed (Lukina et al., 2001). It appeared that grain yield prediction could be improved if the estimated yield was obtained by using the cumulative GDD from sowing to sensing as a divisor. Sensing could be done from Feekes growth stages 4 to 6 and there would not be any significant improvement in the yield prediction regardless of the number of sensing performed within that window. Moreover, yield prediction would be less affected regardless of the NDVI being used solely or with a divisor (the cumulative GDD from sowing to sensing).
Once the yield prediction index or INSEY was established, different approaches for determining N requirements were proposed. For instance, a 5-step approach that required the prediction of the potential grain yield (using the INSEY index), grain N content, grain N uptake and early-season plant N uptake was proposed (Lukina et al., 2001); whereas a 7-step approach included, on top of the foregoing, the calculation of the predicted yield using the predicted potential grain yield, the response index and the forage N uptake (Raun et al., 2002). To refine the algorithm, consideration was equally given to variations in plant-stand densities (Raun et al., 2005; Teal et al., 2006). These approaches can be acted on and adapted in devising customized N fertilizer recommendations provided all inputs for building an algorithm are supplied.
The overall objective of this study was to improve barley N use efficiency through canopy sensing under Australia biophysical conditions by developing two algorithms for in-season N fertilizer prescriptions for barley grain and forage production. Upon validation, these algorithms may be used for N fertilizer recommendations on barley in Queensland (Australia). Possible outcomes of using the algorithm may include input cost reductions, limited environmental contamination, higher quality grains and forage and better financial returns.
MATERIALS AND METHODS
Experimental site and design
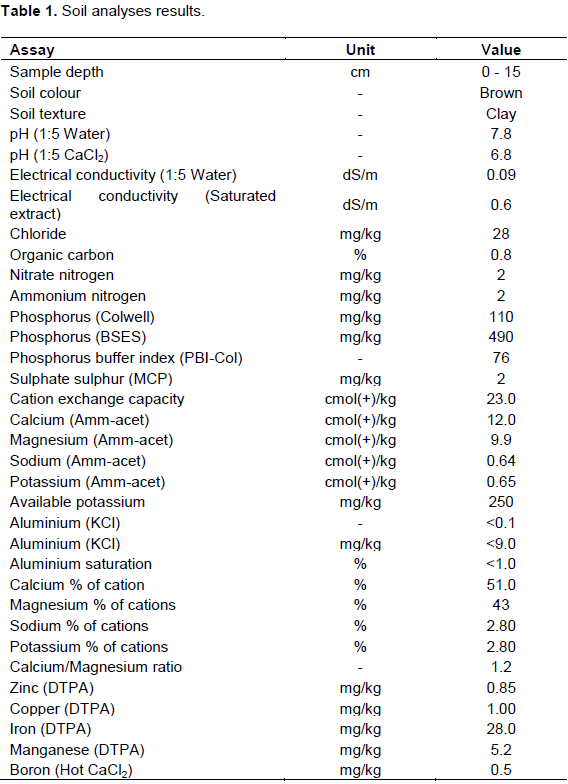
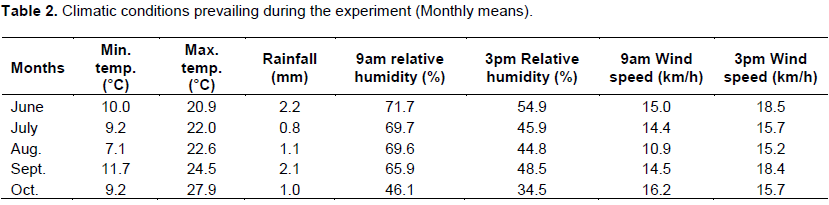
The experiment was conducted at the research facility of the University of Queensland located in Gatton Campus during the winter barley growing season, from June to October, 2016. The previous crop for the trial area was forage sorghum with no added fertilization in order to substantially deplete the soil N level. Soil test analyses were undertaken prior to sowing and the results are presented in Table 1. Based on these results, some nutrient deficiencies were corrected. Climatic conditions prevailing throughout the experiment were gathered by a weather station located within the premises of the research facilities. Downloaded from the Australian Bureau of Meteorology website (BOM, 2016), monthly averages of these climatic conditions are summarized in Table 2.
The area was ploughed and 16 subplots of 24 m2 each were seeded at a sowing rate of 54 kg ha-1, a sowing depth of 50 to 75 mm and an expected planting density of 60 plants m-2 (600,000 plants ha-1). Corvette was the barley cultivar sown. This cultivar is grown in Queensland for both grain and forage production. Alleys between subplots were 2 m wide to minimize interferences between fertilizer treatments.
The trial was set up as a mono-factorial randomized complete block design with four treatments: N0, N50, N100 and N150, standing for 0, 50, 100 and 150 kg N ha-1, respectively. With the exception of the control subplot (0 kg N ha-1), N fertilizers were applied once prior to sowing (pre-plant fertilization). Weed control was performed by application of pre-emergence and post-emergence herbicide. Four weeks after emergence onwards, manual weeding was done weekly to reduce competition. Disease and pest control were unnecessary as attacks and infestations were insignificant. Irrigation was scheduled whenever water stress was likely to occur. An equivalent of 110 mm irrigation was supplied at 1, 2, 5 and 8 weeks after sowing (WAS).
Reflectance measurements
Canopy sensing was carried out across the whole subplot starting from 5 WAS at GS2 (Growth Stage 2 or Tillering) to 15 WAS at GS9 or ripening (Zadoks, 1974). The handheld GreenSeeker optical sensor unit (Trimble Navigation Limited) was used to measure the canopy reflectance. This sensor utilizes high intensity light emitting diodes (LED) and emits light in the red (660 ± 25 nm full width half magnitude, FWHM) and near infra-red (780 ± 25 nm FWHM) bands. A photodiode detector records the intensity of the reflected light. Electronic filters remove the soil background illumination and a multiplexed analogue-to-digital converter measures the filtered signal (Raun et al., 2002). Embedded software computes the reflectance in the red and near infra-red to output the NDVI. The sensor’s field of view is an oval window of approximately 25 to 50 cm wide when held above the canopy at 60 to 120 cm, respectively. Sensing was operated by pulling the trigger at the start of rows and moving along them. Multiple readings are accumulated and an average was provided once the trigger was released at the end of the sensed area. The maximum measurement interval was 60 s. For optimal reading, the sensor was kept at a consistent heigh (60 cm) above the canopy and moved along rows at the speed of 2 m s-1 to keep the maximum measurement interval below 1 min. For each subplot, at least four NDVI average values were recorded and stored in an Excel spreadsheet.
Agronomic measurements and N analysis
Five different response variables (or first class variables) were measured: in-season forage N content (FNCi), forage yield (FY), forage N content at harvest (FNCh), grain yield (GY), and grain N content (GNC). These were then used to infer other values used to develop the algorithms.
Sampling for FNCi and FNCh was performed at 8 WAS (GS3 or stem elongation) and 15 WAS (GS9 or ripening), respectively. Samples were collected inside a square metre quadrat. The collection was done by handclipping the whole quadrat 2 cm above the ground. Samples were weighed, maintained in a drier at 65°C for 78 h, weighed again and then ground. The powder was thoroughly mixed and 250 mg sampled for N analyses. The N concentration was determined by the Dumas method (Bremner and Mulvaney, 1982) using the elemental analyzer Vario MACRO CHN/CHNS in the CAL Laboratory at UQ Gatton. The in-season forage N uptake and the forage N uptake at harvest were then calculated by multiplying the N concentration with the forage dry biomass.
Forage and grain harvest were performed at 15 and 16 WAS, respectively. An area of one square meter within each subplot was hand-clipped and the total biomass was collected, dried for 78 h at 65°C in a drier, then weighed to obtain forage dry biomass and consequently the FY. Another square meter within each subplot was hand-clipped and barley heads snipped, dried for 78 h at 65°C in a drier and then threshed to obtain barley grains. Grains were weighed to measure the GY and about 100 g of these were randomly sampled and ground. 250 mg of the thoroughly mixed powder were subsampled for GNC analyses using the Dumas method. Grain N uptake was calculated by multiplying the GNC by GY.
Statistical analysis and calculations
A number of second class variables were used to develop the algorithm: apparent N recovery (ANR), forage N uptake at harvest (FNUPh), grain N uptake (GNUP), in-season forage N uptake (FNUPi), in-season estimate of yield (INSEY), response index (RI) and normalized difference vegetation index (NDVI).
Apparent N recovery
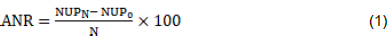
where ANR: apparent N recovery (%); NUPN: N uptake at applied N rate (kg N ha-1); NUP0: N uptake at zero N rate (kg N ha-1); N: applied N rate (kg N ha-1).
Forage N uptake at harvest

![]()
where FNUPh: forage N uptake at harvest (kg N ha-1); FY: forage yield (kg ha-1); FNCh: forage N content at harvest (%).
Grain N uptake

![]()
where GNUP: grain N uptake (kg N ha-1); GY: grain yield (kg ha-1); GNC: grain N content (%).
In-season forage N uptake

![]()
where FNUPi: in-season forage N uptake (kg N ha-1); DBi: in- season dry biomass (kg ha-1); FNCi: in-season Forage N content (%).
In-season estimate of yield

Number of days from sowing to sensing where GDD is larger than zero. All over the growing season daily temperatures were larger than the GDD.
Response index
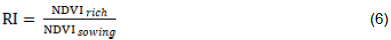
where RI: response index; NDVIrich: NDVI measured in a N rich strip, and N is non-limiting; NDVIsowing: NDVI measured in the plot with the sowing N rate. The sowing N rate can range from zero to the level where the N is non-limiting.
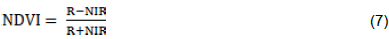
where NDVI: normalized difference vegetation index; R: canopy reflectance in the red band (660±25 nm); NIR: canopy reflectance in the near infra-red band (780±25 nm).
Parametric statistical analyses were performed using the R version 3.3.1 released 21-06-2016. Three major steps were followed: (1) check the normality of response variables, (2) test the significance of differences among treatment means using the least significant difference (LSD) test, and (3) test the significance of correlation coeficients, regression coeficients and the regression models. All variables were submited for analysis of variance (ANOVA) to assess the statistical significance of treatment effects across the four treatments and then means were compared for significant differences. Simple linear regression analyses based on ordinary least square (OLS) estimation were performed to describe the relationship between the independent variables (NDVI readings) and dependent variables (yield and N contents). The level of significance throughout these statistical analyses was set at α = 0.05.

RESULTS AND DISCUSSION
Barley response to N rates
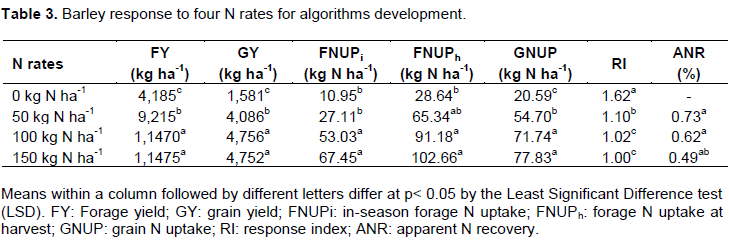
All agronomic variables measured responded positively to different N rates (Table 3). With the exception of the two highest N rates where no significant differences were noticed, FY, GY, FNUPi, FNUPh and GNUP significantly increased with increasing N rates, thus delivering enough variability in data to make possible the derivation of N fertilizer algorithms.
Canopy reflectance and N rates
Barley canopy reflectance increased with increasing N levels. With the exception of 5 and 6 WAS where no significant differences were detected between treatments, higher N rates induced higher NDVIs (Figure 1). N fertilization fosters biomass production and enhances leaf greenness. Being an index specific for chlorophyll and vegetation discrimination, NDVI is sensitive to both green and dense canopies (Peñuelas et al., 1997). In canopy reflectance of barley at various N rates under two irrigation regimes, Kleman and Fagerlund (1987) equally noticed that reflectance increased with increasing N rates as a result of biomass and leaf pigment accumulation. Furthermore, when NDVI was regressed against N rates, strong coefficients of determination were observed at all growth stages (Figure 2) except for weeks 5 to 7, therefore reinforcing the assumption that barley NDVIs can be used for indirect assessment of pre-plant N levels between 7 and 15 WAS.

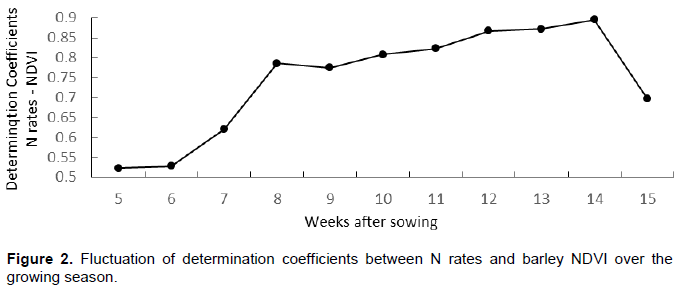
The inability of NDVI in capturing N levels at earlier growth stages (5 to 7 WAS) may be attributable to the open canopy. In effect, at incomplete canopy cover, NDVI is affected by soil background optical properties (Bausch, 1993). Similar conclusions were reached upon comparing the effects of different soil backgrounds at various vegetation cover and this influence was more pronounced on lighter coloured soils than on dark agricultural soils (Elvidge and Lyon, 1985; Huete et al., 1985). Thus, in the current study it appears that lower population densities interfered with NDVI reliability, limiting its early season biomass and N status estimations. Alternatives such as delaying reflectance measurements until near canopy closure or augmenting population density could be explored to improve NDVI reliability at these early stages of crop development.
Barley NDVI seemed to approach its saturation point between 100 and 150 kg N ha-1, endorsing this commonly
known NDVI weakness of reaching saturation prematurely as compared to other vegetation indices (Figure 1). NDVI saturation usually occurs when at larger leaf area indices rather than increasing linearly, NDVI readings asymptotically reach a constant value (Haboudane et al., 2004). Because NDVI saturation usually occurs under dense canopies (Gu et al., 2013), this suggests that the population density and the two highest N treatments tested in the current experiment induced NDVI near-saturation. Thus, at N rates exceeding 150 kg N ha-1 and sowing densities above 600,000 plants per hectare, NDVI is expected to reach saturation thereby rendering it a poor estimator of barley biomass and N content.
Over the growing season, NDVI exhibited a parabolic-shape curve irrespective of N rates. For instance, at 150 kg N ha-1, NDVI steadily increased from 0.35 at one WAS to peak of 0.81 at eight WAS, then decreased to a lower value (0.45) at the ripening stage (GS9). Apart from the declining phase of the NDVI curve for the past week 9, this pattern resembles the N uptake curve and the biomass production curve of barley over time (Lemaire et al., 2008; Whitmore, 1988). Indeed, under steady N supplies, most cereal crops expand their canopies, accumulate biomass and store N in leaves in the form of Rubisco or Ribulose-1,5-bisphosphate carboxylase/oxygenase, a compound produced during photosynthesis (Millard, 1988). Once maximum leaf area and biomass are attained, the N uptake is restricted to covering deficits resulting from grain filling and limited remobilization from senesced leaves (Jeuffroy and Bouchard, 1999). Thus at anthesis and post-anthesis stages (GS5 or week 11 and beyond), leaf biomass, leaf N content and forage N uptake decline until complete senescence of the canopy occurs. Being an index sensitive to chlorophyll content, biomass and leaf area, NDVI mirrored these physiological processes over the growing season.
Canopy reflectance, yield and N uptake
Barley NDVI correlated well with both N uptake and yield. When NDVI was regressed against FNUPi at eight WAS, a fairly strong determination coefficient was noticed (R2 = 0.63, p < 0.001) confirming the assumption of a linear relationship. The correlation was equally positive for both components of N uptake, namely dry biomass (R2 = 0.58, p<0.001) and N concentration (R2 = 0.74, p<0.001). Earlier studies on wheat ascertained that NDVI not only correlated with total N uptake but equally with N content (Sembiring et al., 2000; Wright et al., 2004). Just as NDVI is used as estimator of in-season N uptake on wheat the same is achievable on barley.
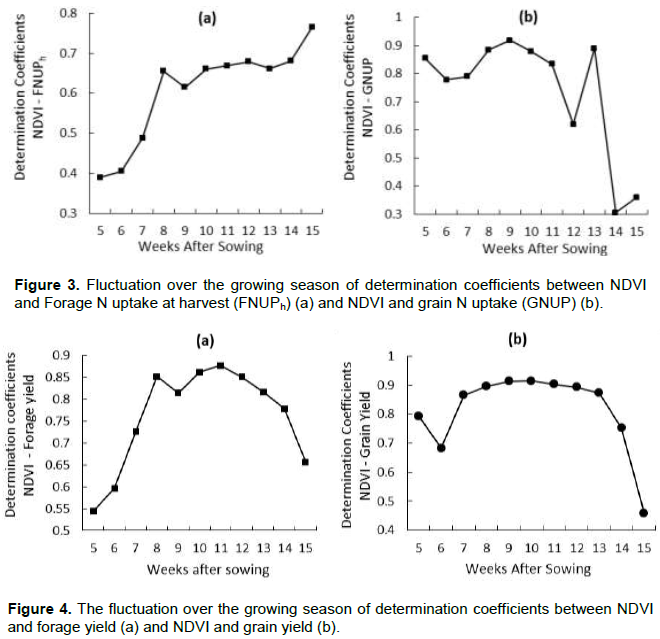
It was equally noted that NDVI at GS3 displayed a positive linear correlation with FNUPh (R2 = 0.65, p<0.001) and GNUP (R2 = 0.84, p<0.001). Assessments over the growing season of determination coefficient fluctuation of NDVI with FNUPh and GNUP revealed that from 7 to 15 WAS NDVI could provide an accurate estimation of FNUPh and GNUP as these coefficients were at least equal to 0.50 (Figure 3). Additionally, upon correlating NDVI with FY and GY, determination coefficients were almost always above 0.50 (Figure 4). It seems that the fairly high correlations of NDVI with end season N uptakes in grain, forage and yields at nearly all sensed growth stages could be due to favorable climatic and biotic conditions. Nevertheless, in a practical sense, only stages in which split N application is possible will be of interest for algorithm development. Therefore, barley NDVI at 8 WAS becomes reliable in predicting barley FNUPi, FY, FNUPh, GY and GNUP, and as such, can be used in developing an in-season fertilizer algorithm, especially because side dressing can be performed at that stage.
Development of sensor-based algorithms for in-season N fertilization on barley
Various approaches have been adopted in developing sensor-based algorithms for in-season N side dressing. Only one of them is discussed for barley forage and grain production in Queensland (Australia). Developed on winter wheat (Raun et al., 2005), this approach required the following inputs: prediction equations for the potential yield based on the NDVI in-season estimate of yield (INSEY); the prediction of N content in grain or forage; the N uptake estimation in grain or forage; and the in-season crop N uptake. Beside these four equations, two additional parameters included the response index (RI) which is the magnitude of the barley response to N fertilizer in-season and the apparent N recovery (ANR). To determine how much N needs to be applied in-season to barley, the knowledge of the potential yield (PY) is a prerequisite. Indeed, knowing the potential yield enables the inference of total N required to achieve that target yield. The potential yield can be estimated early in the growing season through canopy reflectance. Since NDVI exhibited a high determination coefficient with FY (R2 = 0.84, p<0.001) and GY (R2= 0.88, p<0.001), especially from 8 WAS, this relationship can be used for its prediction. Based on in-season barley canopy reflectance at 8 WAS (GS3), it was possible to obtain an equation relating grain and forage yield as a function of INSEY (Figure 5). INSEY was computed by dividing the NDVI value at GS3 by the number of days from sowing to sensing. Predictive equations for forage and grain PY are as follows:
.png)
where PYforage: predicted forage potential yield (Mg dry biomass ha-1); INSEY: in-season estimate of forage yield.

where PYgrain: predicted grain potential yield (Mg dry biomass ha-1); INSEY: in-season estimate of grain yield.

The knowledge of the potential yield is not enough to determine how much N should be applied because N uptake may vary greatly from season to season depending on soil N dynamics. Unfortunately, predicting soil N availability is complex. Still, the crop itself can provide an indirect assessment of soil N through its response to N fertilization. Various studies have established that under restricted conditions, N uptake in cereal crops is higher when N is supplied than when under sufficiency conditions (Lemaire et al., 2008). Thus predicting the crop response to N supply fosters N efficiency. The response index (RI) was proposed to take into account crop response to N fertilization (Mullen et al., 2003). The crop RI is inferred through sensing and computed by dividing the NDVI of a non-limiting N strip with the NDVI of the field with the pre-sowing N rate. In this experiment, 150 kg N ha-1 appeared to be the non-limiting N rate. At that rate, lodging was noticed, an indication of excess N supply. The adjusted predicted potential yield (APY) equals PY times RI, and is expressed as follows:

where APYforage: adjusted predicted forage potential yield based on RI (Mg dry biomass ha-1); RI: response index; INSEY: in-season estimate of forage yield.

where APYgrain: adjusted predicted grain potential yield based on RI (Mg dry grain.ha-1); RI: response index; INSEY: in-season estimate of grain yield.
The next step in the algorithm development consisted of predicting N content in forage and grains based on the predicted APY. A polynomial relationship was established between yield and N content (Figure 6) and used to predict N content on harvested parts as:

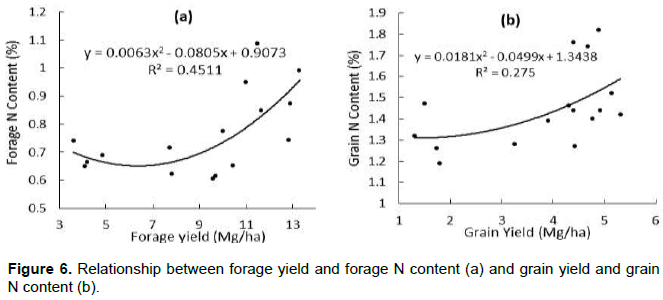
where PNCforage: predicted N content in forage (%); APYforage: adjusted predicted forage potential yield based on RI (Mg dry grain.ha-1).

where PNCgrain: predicted N content in grain (%); APY grain: adjusted predicted grain potential yield based on RI (Mg dry grain ha-1).
The prediction of N content helps in computing the predicted grain or forage N uptake, which is the product of the PNC and the APY.

where FNUP: forage N Uptake (Mg N ha-1); PNCforage: predicted N content in forage (%); APY forage: adjusted predicted forage potential yield based on RI (Mg dry biomass ha-1).

where GNUP: grain N Uptake (Mg N ha-1); PNCgrain: predicted N content in grain (%); APYgrain: adjusted predicted grain potential yield based on RI (Mg dry grain ha-1).
The second last step in the algorithm development requires predicting the early or in-season crop N uptake(also FNUPi). The FNUPi corresponds to the amount of N extracted in the soil by barley from sowing to sensing. This quantity has to be subtracted from FNUPh or GNUP which indicate the total N taken up from sowing to harvest. The prediction equation of FNUPi as a function of NDVI was determined (Figure 7) and it reads:
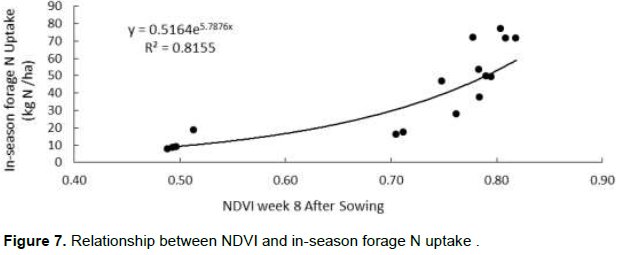

where FNUPi: in-season forage N uptake (kg N ha-1) at GS3; NDVI: normalized difference vegetation index measured at GS3.
Finally, the N fertilizer requirement (FNR) is deduced by subtracting FNUPi from FNUP or GNUP and dividing the difference by the apparent N recovery (ANR) to account for the fact that not all N applied is taken up by the barley crop. During this study, the ANR averaged 62%. Thus, the in-season N requirement based on sensing barley canopy at GS3 (8 WAS) is obtained by these equations:

FNRforage: fertilizer N requirements for forage production (Mg N ha-1); FNUPh: forage N uptake at harvest (Mg N ha-1); FNUPi: In-season forage N uptake (kg N ha-1).

where FNRgrain: fertilizer N requirements for grain production (Mg N ha-1); GNUP: grain N uptake (Mg N ha-1); FNUPi: in-season forage N uptake (kg N ha-1).
![]()
CONCLUSIONS
The low efficiency of N fertilizer threatens farmers’ financial returns but most importantly the environment. Among the existing strategies being developed to address the matter, crop canopy sensing holds an advantageous position, and is being considered a promising tool in precision agriculture. The current study developed two distinct algorithms: one for barley forage production and another for grain production in Queensland using the handheld GreenSeeker sensor. The sensor measured barley canopy reflectance over the growing season and output NDVI values. These values were correlated with yields (grain and forage) and with N uptake (in-season and at harvest). The power of these correlations was high enough to justify the design of in-season N fertilizer algorithms. The developed algorithms were expected to safeguard natural ecosystems through minimization of unused N but also to improve financial returns of barley growers through reductions of N related costs.
CONFLICT OF INTERESTS
The authors have not declared any conflict of interests.
REFERENCES
|
Barley Australia (2016). Barley. |
|
|
Bausch WC (1993). Soil background effects on reflectance-based crop coefficients for corn. Rem. Sens. Environ. 46:213-222. |
|
|
BOM (2016). Australian Bureau of Meteorology. |
|
|
Bremner JM, Mulvaney C (1982). Nitrogen—total. Methods of soil analysis Part 2 Chemical and microbiological properties pp. 595-624. |
|
|
Elvidge CD, Lyon RJ (1985) Influence of rock-soil spectral variation on the assessment of green biomass. Rem. Sens. Environ. 17:265-279. |
|
|
FAO (2016). FAOSTAT. Food and Agriculture Organization of the United Nations (FAO) Statistics Division. |
|
|
Freeman K, Raun W, Johnson G, Mullen R, Stone M, Solie J (2003). Late-season prediction of wheat grain yield and grain protein. Comm. Soil Sci. Plant Anal. 34:1837-1852. |
|
|
Gu Y, Wylie BK, Howard DM, Phuyal KP, Ji L (2013). NDVI saturation adjustment: A new approach for improving cropland performance estimates in the Greater Platte River Basin, USA. Ecol. Indic. 30:1-6. |
|
|
Haboudane D, Miller JR, Pattey E, Zarco-Tejada PJ, Strachan IB (2004). Hyperspectral vegetation indices and novel algorithms for predicting green LAI of crop canopies: Modeling and validation in the context of precision agriculture. Remote Sens. Environ. 90:337-352. |
|
|
Huete A, Jackson R, Post D (1985). Spectral response of a plant canopy with different soil backgrounds. Remote Sens. Environ. 17:37-53. |
|
|
Jeuffroy MH, Bouchard C (1999). Intensity and duration of nitrogen deficiency on wheat grain number. |
|
|
Kleman J, Fagerlund E (1987). Influence of different nitrogen and irrigation treatments on the spectral reflectance of barley. Remote Sens. Environ. 21:1-14. |
|
|
Lemaire G, Jeuffroy MH, Gastal F (2008). Diagnosis tool for plant and crop N status in vegetative stage: Theory and practices for crop N management. Eur. J. Agron. 28:614-624. |
|
|
Lukina E, Freeman K, Wynn K, Thomason W, Mullen R, Stone M, Solie J, Klatt A, Johnson G, Elliott R (2001). Nitrogen fertilization optimization algorithm based on in-season estimates of yield and plant nitrogen uptake. J. Plant Nutr. 24:885-898. |
|
|
Millard P (1988). The accumulation and storage of nitrogen by herbaceous plants. Plant Cell Environ. 11:1-8. |
|
|
Mullen RW, Freeman KW, Raun WR, Johnson GV, Stone ML, Solie JB (2003). Identifying an in-season response index and the potential to increase wheat yield with nitrogen. Agron. J. 95:347-351. |
|
|
Pe-uelas J, Isla R, Filella I, Araus JL (1997). Visible and near-infrared reflectance assessment of salinity effects on barley. Crop Sci. 37:198-202. |
|
|
Pettersson C, Eckersten H (2007). Prediction of grain protein in spring malting barley grown in northern Europe. Eur. J. Agron. 27:205-214. |
|
|
Pinter Jr P, Jackson R, Idso S, Reginato R (1981). Multidate spectral reflectance as predictors of yield in water stressed wheat and barley. Int. J. Rem. Sens. 2:43-48. |
|
|
Raun W, Solie J, Johnson G, Stone M, Lukina E, Thomason W, Schepers J (2001). In-Season Prediction of Potential Grain Yield in Winter Wheat Using Canopy Reflectance. Agron J. 93:131-138. |
|
|
Raun W, Solie J, Stone M, Martin K, Freeman K, Mullen R, Zhang H, Schepers J, Johnson G (2005). Optical Sensorâ€Based Algorithm for Crop Nitrogen Fertilization. Comm. Soil Sci. Plant Anal. 36:2759-2781. |
|
|
Raun WR (2002). Improving Nitrogen Use Efficiency in Cereal Grain Production with Optical Sensing and Variable Rate Application. Agron. J. 94:815. |
|
|
Raun WR, Solie JB, Johnson GV, Stone ML, Mullen RW, Freeman KW, Thomason WE, Lukina EV (2002). Improving nitrogen use efficiency in cereal grain production with optical sensing and variable rate application. Agron. J. 94:815-820. |
|
|
Sembiring H, Lees H, Raun W, Johnson G, Solie J, Stone M, DeLeon M, Lukina E, Cossey D, La Ruffa J (2000). Effect of growth stage and variety on spectral radiance in winter wheat. J. Plant Nutr. 23:141-149. |
|
|
Teal R, Tubana B, Girma K, Freeman K, Arnall D, Walsh O, Raun W (2006). In-season prediction of corn grain yield potential using normalized difference vegetation index. Agron. J. 98:1488-1494. |
|
|
Tubana B, Arnall D, Walsh O, Chung B, Solie J, Girma K, Raun W (2008). Adjusting midseason nitrogen rate using a sensor-based optimization algorithm to increase use efficiency in corn. J. Plant Nutr. 31:1393-1419. |
|
|
Watson D, Thorne GN, French S (1963). Analysis of growth and yield of winter and spring wheats. Ann. Bot. 27:1-22. |
|
|
Whitmore A (1988). A function for describing nitrogen uptake and dry matter production by winter barley crops. Plant Soil 111:53-58. |
|
|
Wright DL, Rasmussen VP, Ramsey RD, Baker DJ, Ellsworth JW (2004). Canopy reflectance estimation of wheat nitrogen content for grain protein management. GIScience Rem. Sens. 41:287-300. |
|
|
Zadoks JC (1974). A decimal code for the growth stages of cereals. Weed Res. 14:415-421. |
|
Copyright © 2024 Author(s) retain the copyright of this article.
This article is published under the terms of the Creative Commons Attribution License 4.0


