Full Length Research Paper
ABSTRACT
This paper presents the estimation and analysis of the agribusiness GDP in the Brazilian state of Paraná between 2006 and 2011, and its comparison with the economic development of the state’s agricultural cooperatives in the same period. The GDP aggregates were detailed in the analysis that allowed assessment of the distribution of the respective inputs from agriculture, industry, and the distribution and services sectors. The results indicated the importance of each sector in the growth of Paraná’s agribusiness and its share in the state’s GDP. The impressive performance of Paraná’s agriculture is evident as it grew 13.1% in 2007 and 32.4% in 2010. Historically, the distribution and services sector is the largest contributor to the agribusiness GDP, with about 13% representation. The industry sector was more sensitive to the events that followed the global economic crisis of 2008. Its share in the agribusiness GDP ranged from 10.3% in 2006 to 8.6% in 2011. In parallel, the revenue performance of cooperatives and the importance of the economic activity of the state through the use of financial resources and investments in industrialization are highlighted.
Key words: Agribusiness economics, Brazilian agribusiness, gross domestic product, Cooperatives of Brazilian State of Paraná.
INTRODUCTION
The concept of agribusiness (Gunderson et al., 2014) is comprehensive and includes, in addition to rural property, all other production, support, and agricultural distribution activities (CEPEA, 2014a; Ustriyana, 2015). It is a system of production chains that encompasses suppliers of materials and services, farms responsible for production (crops, livestock, plant extracts), storage, processing, and manufacturing industries, and distribution and marketing agents (Saragih, 2001; Veiga et al., 2014; Rocha et al., 2015). The interaction and influence among the links of the chain are critical in agribusiness conceptualization. The value addition of the industry’s products goes through five distinct stages: (i) supply, (ii) production, (iii) processing, (iv) storage, and (v) distribution (Sawik, 2015; Lee et al., 2016).
According to the Brazilian Corporation of Agricultural Research (EmpresaBrasileira de PesquisaAgropecuária– EMBRAPA - https://www.embrapa.br), agribusiness is a network composed of several agents that are responsible for the production and sale of inputs, agricultural production, processing, distribution, and sale to the final consumer (EMBRAPA, 2005; Ustriyana, 2015) (Figure 1) illustrates agribusiness as a comprehensive supply chain.
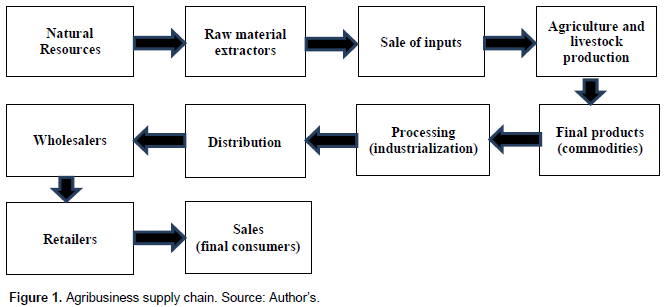
The production and sale of inputs involve the extraction of raw materials, processing, and distribution, leading to sale for agricultural production. Agricultural production by small, medium, and large producers involves technical support, environmental management, and other direct and indirect aspects that are related to the generation of goods and services linked to the rural environment (Marine et al., 2016). Processing, distribution, and sale encompass industry, distributors, and consumers of agricultural products and services. Agribusiness also includes the institutional environment, which consists of the culture, traditions, education, customs, and the organizational environment composed of information, associations, research and development, and finance (EMBRAPA, 2005; Neves and Scare, 2010; Haggblade, 2011).
Agribusiness has always played a key role in the development of the Brazilian economy (Wilkinson et al., 2015). Brazil’s economic upturns during the coffee, cattle, sugarcane, sugar, rubber, cocoa, and other “cycles” are proof of this industry’s economic and social contributions (Gunderson et al., 2014). According to Guilhoto et al. (2000), the country’s economic tradition in agribusiness is a trend that should prevail in the future, primarily because of the availability of its vast natural resources. The size of the Brazilian territory is 880 million hectares, where 388 million are arable, of which 90 million have not yet been explored (Portal, 2014). This availability of area, non-existent in most countries, coupled with the global growth in food demand, creates a positive scenario for the national agribusiness. The industry employs 38% of the country’s workforce and accounts for about 40% of the volume of national exports (Martins et al., 2014). Agribusiness is an economic industry of vital importance to Brazil because it contributes a significant share of job creation, positively supports the trade balance with the strength and magnitude of its exports, and substantially influences the composition of the Brazilian GDP (Wilkinson et al., 2015).
Agricultural systems around the world are incrementally being dominated by vertically coordinated or integrated organizations (Gunderson et al., 2014; Purves et al., 2015). This is already a reality in developed countries and is being rapidly experienced in developing countries, especially in South America and Southeast Asia (Fao, 2005). Thus, farmers, especially the smallerones, should seek associations, cooperatives, alliances, or other forms of support to strengthen themselves and be able to play effectively significant roles (Guilhoto et al., 2000; Haggblade, 2011). At the rural level, membership organizations can be characterized by various types of structures. Among these are cooperatives, which are structured organizations that can achieve high levels of vertical integration.
This paper presents the agribusiness GDP of the state of Paraná (Southern Brazil region) in the years 2006 to 2011, and a comparison with the economic development of Paraná’s agricultural cooperatives over the same period. The computation was made through an adaptation of the method used by the National Confederation of Agriculture (Confederação Nacional da Agricultura- CNA: http://www.canaldoprodutor.com.br) to calculate the agribusiness GDP in Brazil, which in turn is based on Furtuoso and Guilhoto’s method (2003). The use of this method allows the comparison of Paraná’s state results with CNA’s. This method was also applied to the agribusiness GDP calculations of the states of Bahia, Espirito Santo, and Rio de Janeiro (Guilhoto et al., 2007; Bonelli et al., 2011; Barros et al., 2013). Although there are no specific studies to measure, in a disaggregated way, the role of the cooperatives’ activities in the formation of Paraná’s GDP, it is possible to demonstrate the economic development of cooperatives in strict relation to the evolution of Paraná’s GDP.
MATERIALS AND METHODS
In order to calculate the GDP, it is necessary to consider the entire production chain. Thus, agribusiness is divided into four segments: Inputs, Agriculture and Livestock, Industry (agriculture-based), and distribution (transport, trade, and services). In each segment, the GDPs corresponding to the sectors of Agriculture (total production chains of crops and other plant activity) and Livestock (total production chains of animal products) are estimated separately and then aggregated according to the following classification: Aggregate I - Input; Aggregate II - Agriculture and Livestock; Aggregate III - Industry; Aggregate IV - Distribution. The end result of the agribusiness GDP is the sum of the four aggregates.
To calculate the GDP of Aggregate I, the values of inputs produced in agriculture and livestock were considered within the activity in order to avoid double counting. The mean consumption was measured using Paraná’s 2006 input-output matrix, discounting input costs. For each input supplier sector, the added value coefficient at market price was calculated by the following expression:
AVCi = AVi / Xi (1)
Where: AVCi = added value coefficient at market price of sector i;
AVi = added value at market price of sector i; and Xi = production value of sector i.
The GDP of Aggregate I at market price is calculated by multiplying the input values (obtained from the input-output matrix) by the added value coefficient, according to the following expression:
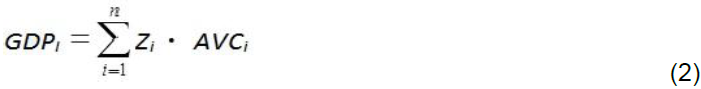
Where: GDPI = GDP of Aggregate I (inputs) of agriculture, forestry, logging, and livestock and fisheries; Zi = total value of input in sector i.
Aggregate II corresponds to the agriculture and livestock GDP, and the values are measured separately for agriculture and livestock. In the original method of Furtuoso and Guilhoto (2003), the added value of providing inputs to the agricultural sector alone is considered in Aggregate I. This procedure was not followed in the method used in this study. Thus, the added value of the input supply to only the agricultural sector remained in Aggregate II. The added value at basic prices plus net taxes for subsidies was considered to obtain the value at market price. This procedure was made possible due to the existence of these values in Paraná’s 2006 input-output matrix. With this procedure, the value added at basic agricultural price corresponds exactly to the information published by the Brazilian Institute of Geography and Statistics (IBGE) in regional accounts. Below are the expressions used for these calculations:
GDPagric = AVpmagric (3)
GDPliv = AVpmliv (4)
GDPII = GDPagric+ GDPliv (5)
Where: AVpmagric = added value of agriculture at market price; AVpmliv = added value of livestock at market price; GDPagric = agriculture GDP; GDPliv = livestock GDP; GDPII = total agriculture GDP.
To measure the GDP of agriculture and livestock-based industry, which constitutes the GDP of Aggregate III, the industrial segments that consume raw materials from agriculture, in Paraná’s input-output matrix, were determined. The sectioned sectors were: Food and beverages, textiles, clothing items and accessories, leather goods and footwear, wood products –excluding furniture, cellulose and paper products, alcohol, pesticides, furniture, and products of various industries. To avoid double counting, the value of the supply of inputs to agriculture, computed in Aggregate I, was subtracted from the agricultural industry’s added value at market price. Thus, Aggregate III may be calculated by the following expression:
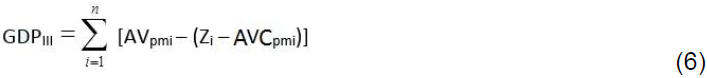
Where: GDPIII = GDP of Aggregate III (agri-industry); AVpmi = added value at market price of the agri-industry of sector i; Zi = total value of the input from sector i; AVCpmi = added value coefficient at market price of sector i.
The GDP of Aggregate IV is the share of agricultural GDP related to distribution and service. To that end, first the added value of trade, transport, and services were obtained. For services, the added value of the following service activities was considered: Information, financial intermediation and insurance, real estate and rent, boarding and lodging, and services provided to businesses. The added value at market price was calculated by adding the added value at basic price to net indirect taxes of subsidies on products. It was also necessary to consider the values of the final demand of the agribusiness segment when totaling the final domestic demand. Therefore, the final domestic demand was obtained using the following expression:
DFD = GFD–NITFD – IPFD (7)
Where: DFD = domestic final demand; GFD = global final demand; NITFD = net indirect taxes paid on the final demand; IPFD = imported products on the final demand.

Thus, the GDP of Aggregate IV was calculated using the following expression:
Where: = AVCpm= trade added value at market price; TAVpm = transportation added value at market price; SAVpm = services added value at market price; FDi = final demand of agribusiness activities; DFD = domestic final demand.
The total agribusiness GDP corresponds to the sum of the GDPs of the four aggregates. That is, the sum of the results of expressions (2), (5), (6), and (8):
GDPagribusiness = GDPI + GDPII + GDPIII + GDPIV (9)
RESULTS AND DISCUSSION
Agribusiness corresponds to the set of activities related to agriculture, including input supply, processing, marketing, and distribution. Paraná’s state agribusiness, thus defined, represented 31.7% of the state’s GDP in 2006, varying to 29.8% in 2011. The importance of this activity is clear to the state’s economy through its share in Paraná’s GDP.
In current values, the GDP of Paraná’s agribusiness was R$ 72.1 billion in 2011. Out of this, R$ 2.3 billion was the share of the input supply (Aggregate I). Agriculture and livestock (Aggregate II) contributed R$ 19.2 billion. For industrial activities (Aggregate III), the value of the gross domestic product was R$ 20.8 billion. Finally, distribution and services accounted for R$ 29.6 billion of the state’s agribusiness GDP (Table 1) shows, for the period of 2006 to 2011, the values of Paraná’s agribusiness GDP aggregates, the state’s total agribusiness GDP and its percentage share of Paraná’s GDP, Paraná’s total GDP, Brazil’s agribusiness GDP with its percentage share in relation to Brazil’s GDP, and Brazil’s total GDP.
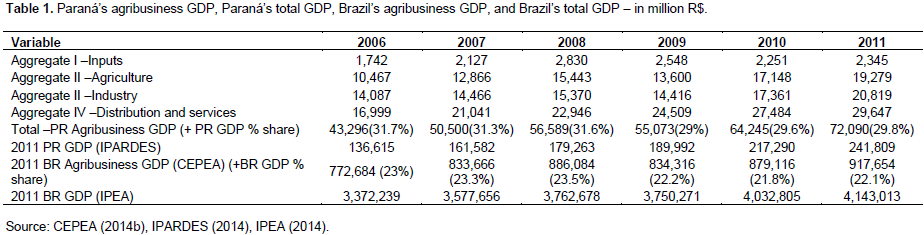
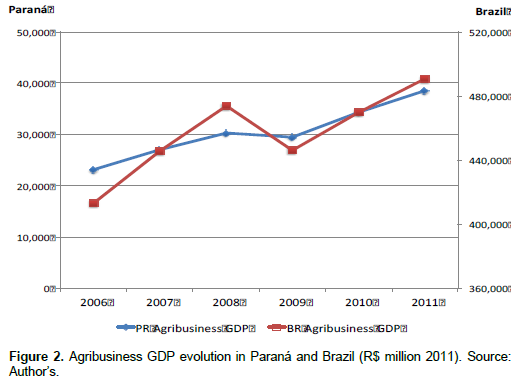
Figure 2 shows the evolution of Paraná’s agribusiness GDP and Brazil’s agribusiness GDP in the period of 2006-2011, in million R$. An increasing trend over the period can be observed, with the exception of 2009, which showed a sharp decrease in the GDP of state and national agribusiness.
Figure 3 shows the percentage share of the agribusiness GDP in Paraná’s total GDP. In the period 2006-2008, the agribusiness share in the state’s GDP was above 31.0%, led by an exceptional increase in agriculture. The good performance of agribusiness presented in this period was, among others, a result of the cumulative growth of 26.03% in soybean production, 148.17% in wheat, and 38.91% in corn production (IBGE, 2006, 2008). In 2009, the state’s economy declined by 1.32%. This negative performance was mainly due to the global economic crisis of 2008, which started in the US housing sector. The weakening of Paraná’s economy had also generated negative effects on the performance of agribusiness. The highest decrease of agribusiness’ share in Paraná’s GDP was recorded in 2009, when the share dropped from 31.6% in 2008 to 29% in 2009.
Figure 4 shows the share of aggregates in the composition of Paraná’s agribusiness GDP. It is clear that in 2009 the industrial activity and agriculture and livestock production were the most affected by the global economic crisis of 2008, showing decrease compared to the previous year. This scenario was caused mainly because the crisis impacted the domestic demand for agribusiness products and the exports of agribusiness products contracted. According to Suzuki Junior (2009), during January to September, 2009, exports of fresh chicken meat, crude soybean oil, and plywood showed sharp revenue declines of -23.5, -52.6 and -52.0%, respectively. However, it must be noted that agribusiness is recovering its share in Paraná’s total economy, closing the year 2011 with 29.8% share, as showed in Figure 4.
.png)
.png)
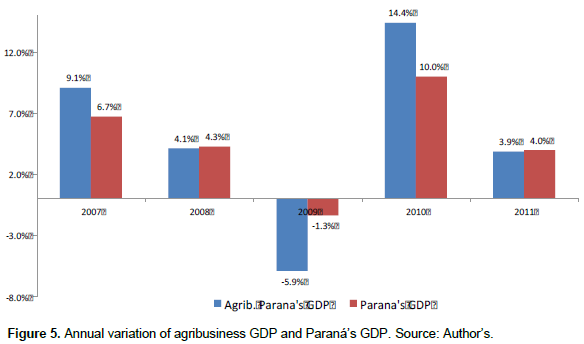
Figure 5 shows the annual percentage variation of the agribusiness GDP and Paraná’s total GDP from 2006 to 2011. It can be verified that the expansion of the real growth of the state’s agribusiness GDP was higher than the state’s total GDP growth in 2007 and 2010 and similar to the expansion of Paraná’s economy in 2008 and 2011. This performance resulted in the expansion of the labor market and of the local markets of the cities located on the Paraná agro-industrial regions. However, in 2009, the global economic crisis brought down the growth rate to -5.9%. This was mainly caused by the reduction in the volume of exports.
When assessing the annual variation of agribusiness GDP aggregates, shown in (Figure 6), it is possible to see the impressive performance of Paraná’s agriculture and livestock (Aggregate II), expanding 13.1% in 2007 and 32.4% in 2010. In contrast, the 2009 results presented a variation of -18.0%. According to Suzuki Junior (2010), the negative performance of agribusiness in 2009 was mainly caused by climatic factors that led to crop failures. The severe drought that year resulted in a reduction of 22.8% in grain production. Another striking factor for agribusiness in 2009 was the performance of the timber segment, which showed production decline to the order of 22.7%. On the other hand, the inputs as well as the distribution and services sectors had positive variations throughout the analysis period, and they made a definite contribution to the growth of the state’s economy.
.png)
Cooperatives in Paraná, Brazil
Paraná hasa significant representation of agricultural cooperatives. According to data from the Organization of the Paraná State Cooperatives (Organização das Cooperativas do Estado do Paraná –OCEPAR), agricultural cooperatives have a significant place in Paraná’s agricultural economy, as they actively participate in the production, processing, storage, and industrialization processes of most agricultural products produced in the state (OCEPAR, 2010). According to Martins et al. (2014) agricultural cooperatives in Paraná serve as a model for the rest of the country. The authors note that, “In the context of Paraná, the cooperative stands as an instrument for the social ascension of members of the cooperative and also for the regional promotion and development based on highly competitive agribusiness chains.”
Although there have been no specific studies to measure the role of the activities of cooperatives in the formation of Paraná’s GDP in a disaggregated way, it is possible to demonstrate the economic development of cooperatives in strict relation with the evolution of Paraná’s GDP. Figure 7 shows the growth of the total revenues of the state’s agricultural cooperatives between 2006 and 2011, reaching R$ 26.5 billion by 2011. It is also possible to check the growth curve of Paraná’s agribusiness GDP. The comparative analysis shows a correlation between the two periods. In this analysis, it is important to emphasize that the intention is merely to show the evolution of the indicators and the growth curve over time.
In Figure 8, the annual variation of these two indicators points to a higher positive variation for the total revenues of cooperatives in the first two, as well as in the last year.
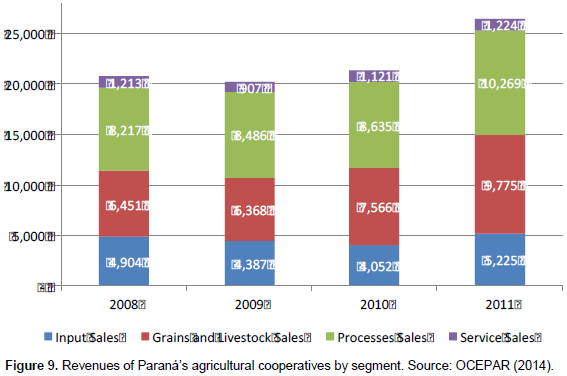
The cooperatives’ revenues are divided into sales of processed products, fresh grains, livestock products, sale of inputs for production, and sale of services.
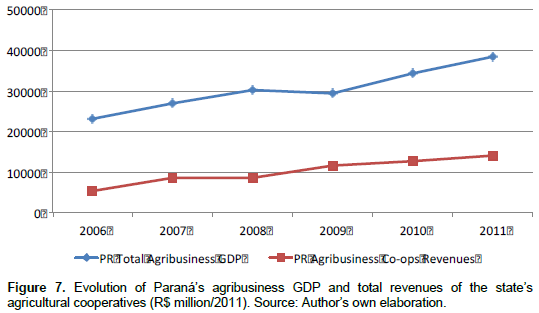
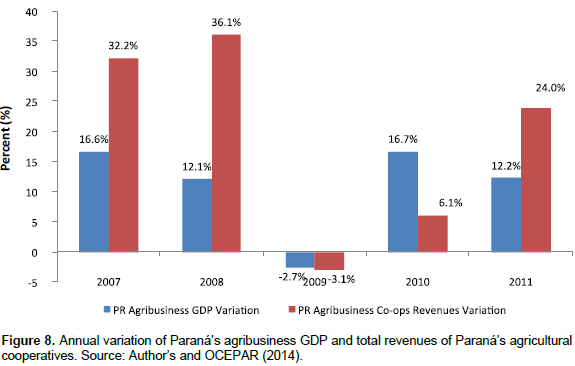
Figure 9 shows the stratification of income and the participation of these segments in total cooperative sales. The most representative segment is processed products (39%), reflecting the result of the high investments made by cooperatives in recent years with an aim to add value to their members’ production. Some examples of products of this activity are: Oil refining, cuts of chicken meat, pork, UHT milk, powdered milk, sugar and alcohol, barley malt, feed, and various other retail items. Then, there is the sale of grain and livestock (37%), but that does not go through processing such as transfer of fresh grains for export and allocation of milk to non-cooperative industries. In addition, also highly represented is the sale of inputs (20%), mainly consisting of the sale of fertilizers, correctors, and seeds made by cooperatives for the members’ production. Finally, there is the sale of services (4%), which encompasses sales in supermarkets, gas stations, taxes, and other services.
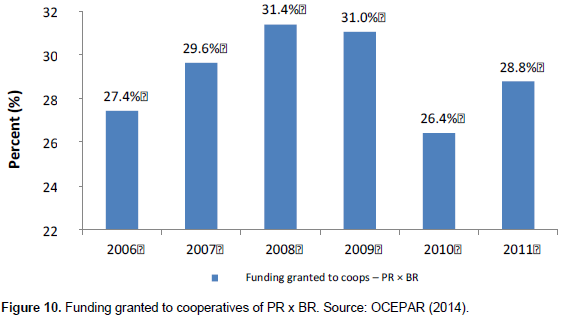
As the largest portion of the sales of Paraná’s cooperatives comes from industrial products, many investments have been made in this segment in recent years. The state has the highest volume of rural credit financing taken by cooperatives, for funding, investment, and sale of the production. Investments in infrastructure and agribusiness help sustain the growth of the sector, since production has been increasing continuously. Figure 10 shows the loans granted to the cooperatives in Paraná as compared with the total loans granted to cooperatives in the rest of the country. In 2011, Paraná received 28.8% of total funding specifically granted to cooperatives across the country, representing about 6% of Paraná’s agribusiness GDP.
CONCLUSION
This article tries to present the estimation and analysis of the agribusiness GDP in the Brazilian state of Paraná between 2006 and 2011, and its comparison with the economic development of the state’s agricultural cooperatives in the same period. The results indicated the importance of each sector in the growth of Paraná’s agribusiness and its share in the state’s GDP was observed. Agribusiness is an activity that has, historically, a large share in the national economy. In the period 2006-2011, the representation of agribusiness hovered around 23%. This representation is even higher in the economy of the state of Paraná. In the period evaluated in this study, agribusiness accounted for about 30% of the state’s GDP. This study presented the calculation of the agribusiness GDP of the state of Paraná over the period 2006 to 2011, and a comparison with the economic development of the state’s cooperatives. The calculation was made through an adaptation of the method used by the CNA for calculating the agribusiness GDP in Brazil.
The use of this method allowed comparison of Paraná’s results with those of the CNA. This methodology was also applied to calculations of the agribusiness GDP of the states of Bahia, Espírito Santo, and Rio de Janeiro. In Paraná, the 2006 input-output matrix, provided by the Paraná Institute for Economic and Social Development (Instituto Paranaense de Desenvolvimento Econômico e Social (IPARDES), was used. By analyzing Paraná’s agribusiness GDP aggregates in relation to the inputs, agriculture and livestock, industry, and distribution and services sectors, it was possible to verify the share of each sector in the GDP composition. Historically, the distribution and services sector has been the largest contributor to the GDP, with a share of about 13%. The input and agriculture and livestock sectors’ shares remained with a low variation as compared with the agribusiness GDP over the period. The industry sector was more sensitive to the events that led to the global economic crisis of 2008. Its share in the agribusiness GDP ranged from 10.3% in 2006 to 8.6% in 2011. However, the variation in the share has shown to be positive. Comparing the agribusiness GDP variation with the state’s total GDP variation, it was found that the sector had a relatively higher increase than the growth of the state’s economy in 2007 and 2010. In the years 2008 and 2011, the growth of agribusiness followed the growth of the state’s economy. In 2009, at the height of the global economic crisis, the impact on agribusiness was higher than the impact on the state’s economy as a whole. The decrease in the agribusiness GDP was caused mainly by the decrease in the volume of exports and climate issues that led to significant crop loss.
CONFLICT OF INTERESTS
The authors have not declared any conflict of interests.
REFERENCES
|
Barros GSC, Fachinello AL, Silva AF, Santos GC, Ultremare F (2013). Dimensionamento do PIB do agronegócio do estado do Rio de Janeiro. Relatório final. Centro de Estudos Avançadosem Economia Aplicada, Piracicaba. |
|
|
Bonelli R, Bastos EKX, Cabral AF (2011). Indicador do PIB do agronegócio do estado do Espírito Santo. Texto para discussão 20. Instituto Jones dos Santos Neves, Secretaria de Estado de Economia e Planejamento do Governo do Estado do EspíritoSanto, Vitória. |
|
|
CEPEA, Centro de Estudos Avançadosem Economia Aplicada – ESALQ/USP (2014). Relatório PIB Agro-Brasil. Disponívelem. |
|
|
EMBRAPA (2005). Temasem Debate. Empresa Brasileira de Pesquisa Agropecuária Disponívelem: FAO, Food and Agriculture Organization of the United Nations (2005). Alternatives to improve negotiation and market access capabilities of small-scale rural entrepreneurs in Latin America. Rome: Agricultural Management, Marketing and Finance Service (AGSF), 2005 (Working Document). |
|
|
Furtuoso MCO, Guilhoto JJM (2003). Estimativa e Mensuração do ProdutoInterno Bruto do Agronegócio da Economia Brasileira, 1994a 2000. Rev. Bras. Econ. Sociol. Rural 41(4):803-827. |
|
|
Guilhoto JJM, Assumpção M, Modolo D, Imori D (2007). O PIB do agronegócio no Brasil e no estado da Bahia. XLV Congresso da Sociedade Brasileira de Economia, Administração e Sociologia Rural. Anais, Londrina. |
|
|
Guilhoto JJM, Furtuoso MCO, Barros GSC (2000). O agronegóciona economia brasileira – 1994 a 1999. Piracicaba: Relatório de PesquisaESALQ-USP/CEPEA, CNA. |
|
|
Gunderson MA, Boehlje MD, Neves MF, Sonka, ST (2014). Agribusiness Organization and Management. Encyclopedia Agric. Food Systems 51-70. |
|
|
Haggblade S (2011). Modernizing African agribusiness: Reflections for the future. J. Agribusiness Dev. Emerging Econ. 1(1):10-30. |
|
|
IBGE- Instituto Brasileiro de Geografia e Estatística (2006). Produção Agrícola Municipal - 2006 Disponívelem: View Acessadoem: 08/01/2015. |
|
|
IBGE- Instituto Brasileiro de Geografia e Estatística Produção Agrícola Municipal (2008). Disponívelem: View Acessadoem: 08/01/2014. |
|
|
IPARDES (2014). Instituto Paranaense de Desenvolvimento Econômico e Social: Paraná emnúmeros. Disponívelem: View Acessadoem: 25/03/2014. |
|
|
IPEA- Instituto de Pesquisa Econômica Aplicada (2014). Disponívelem: www.ipea.gov.br, Acessadoem: 25/03/2014. |
|
|
Lee JY, Cho RK, Paik SK (2016). Supply chain coordination in vendor-managed inventory systems with stockout-cost sharing under limited storage capacity. Eur. J. Oper. Res. 248(1):95-106. |
|
|
Marine SC, Martin DA, Adalja A, Mathew S, Everts KL (2016). Effect of market channel, farm scale, and years in production on mid-Atlantic vegetable producers' knowledge and implementation of Good Agricultural Practices. Food Control 59:128-138. |
|
|
Martins G, Mafioletti RL, Turra FE, Monteiro AA, Krinski S (2014). Agro: conjuntura e cooperativismo. Curitiba: Ocepar/Sescoop/PR. |
|
|
Neves MF, Scare RF (2010). Defining an Agribusiness Strategic Agenda for 2010-2020. Int. Food Agribusiness Manage. Rev. 13:83-90. |
|
|
OCEPAR. Agronegócio e o cooperativismo no Paraná (2010). Curitiba, Ocepar: Sescoop/PR. |
|
|
PORTAL (2014). Portal do Agronegócio Disponívelem: View Acessadoem: 26/03/2014. |
|
|
Purves N, Niblock SJ, Sloan K (2015). On the relationship between financial and non-financial factors: A case study analysis of financial failure predictors of agribusiness firms in Australia. Agric. Financ. Rev. 75(2):282-300. |
|
|
Rocha C, Duclós LC, Veiga C, Corso J (2015). AInfluência dos Mecanismos de Controle no DesempenhoOrganizacional: Análise do Processo Crítico Operacionalem um Negócio Metalúrgico. Espacios (Caracas) 36(12):8. |
|
|
Saragih B (2001). Soundfrom Bogor: Build agribusiness system. USESE Foundation Bogor. |
|
|
Sawik T (2015). Integrated supply, production and distribution scheduling under disruption risks.Omega, In Press, rAvailable online 30 September 2015. |
|
|
Suzuki Junior JT (2009). As exportaçõesparanaensesem 2009 e as mudançasnapautacomercial. Análise Conjuntural, Curitiba: IPARDES 31(9/10):9-12. |
|
|
Ustriyana ING (2015). Agribusiness model in rural communityeconomic: Indonesia perspective. Afric. J. Agric. Res. 10(4):174-178. |
|
|
Veiga CRP, Veiga CP, Catapan A, Tortato U, Silva WV, Leinig AKG (2014). Institutional Theory and Resource Dependency in the Alteration of Distribution Channels. Int. Bus. Manage. 8:240-250. DOI:10.3923/ibm.2014.240.250. |
|
|
Wilkinson J, Cerdan C, Dorigon C (2015). GeographicalIndicationsand "Origin" Products in Brazil – The Interplay of Institutions and Networks. World Development, In Press, Available online 23 June 2015. |
|
Copyright © 2024 Author(s) retain the copyright of this article.
This article is published under the terms of the Creative Commons Attribution License 4.0


