Full Length Research Paper

ABSTRACT
The hectoliter weight or test weight is an important wheat quality parameter for international trade and is traditionally evaluated on devices with a volume of 250, 500, 1000 or 1100 ml. At the experimental level, especially in crop improvement and in greenhouse studies, the amount of grain is often insufficient to determine hectoliter weight. The present work aimed to evaluate the feasibility of using a new 15.30 ml microchondrometer to evaluate hectoliter weight. The testing process was carried out in two steps: (i) To evaluate the need to compress wheat grains inside the microchondrometer cylinder with weights of 0, 4.4, 8.8 and 13.2 kg, and (ii) To verify the effect of different piston weights (4.0, 9.52, 17.56, 28.44 and 31.69 g). A comparison of four compression treatments and five piston weights between 250 ml and 15.30 ml chondrometers were performed by Spearman's correlation coefficient and t-test. The results showed a highly significant correlation coefficient (r=0.99) between the two apparatus and lack of significance for compression and piston weights. The 15.30 ml microchondrometer, in addition to allowing better characterization in small grain samples, will also help to discard unwanted genotypes early in the selection process.
Key words: Plant breeding, grain density, genotype screening.
INTRODUCTION
Test weight or hectoliter weight, a physical quality parameter commonly used in the cereals, is an estimate of bulk density (g cm-3) and the most used indicator by the milling industry. Any damage caused by weathering, shriveled or immature grains as well as rain-induced field sprouting tends to reduce test weight (Donelson et al., 2002). Besides genetic differences among varieties, other stress factors such as, nutrient deficiencies, high temperature during grain filling, plant lodging, insect damage, or adverse weather events like frost and hail also affect test weight negatively (Isleib, 2012). According to Ilker et al. (2009), a safety-first selection index may be effective in selecting superior wheat genotypes especially for test weight, which is one of the physical quality parameters important in determining flour yield in wheat. The hectoliter weight has also been positively correlated with grain yield (Iqbal et al., 2016) but greatly influenced by the environment (Joshi et al., 2018).
Besides cereals, where test weight is most frequently used, it may also be practiced in the field crops like, millets, small millets, pulses, oilseeds, fiber, fodder and green manure crops, where higher values generally fetch a better price and provide a better quality of grains (Deivasigamani and Swaminathan, 2018).
The test weight has been accepted as a measure of the physical quality of wheat and other cereals in the international trade due to its simple and expeditious measurements. All else being equal, a high-test weight variety is likely to produce more flour. Hence, this trait is used as an indicator for the evaluation of milling quality. High-quality wheat is generally above 76 kg hl-1, while a value below this limit implies wheat of low quality (Protic et al., 2007).
The devices and volumes for hectoliter determination vary among grain-producing and/or trading countries. According to Manley et al. (2009), two types of devices are being used at present: i) those equipped with a funnel which provides uniform packing in a 500-ml (South Africa and Canada) or 1100-ml (USA) measuring cups and ii) chondrometer of 500 ml (Australia and the United Kingdom) or 1000 ml volume (France and Germany). For experimental purposes, a 250-ml chondrometer has been an option to measure test weight (Stagnari et al., 2008; Durazzo et al., 2015; Botelho et al., 2018).
In studies on nutrition investigations, preharvest quality surveys, crop breeding, and wheat grown in nutrient cultures, there are limitations on the volume of the grain produced, which in turn impedes measuring the hectoliter weight (Harris and Sibbitt, 1942).
The need to develop a method for determining the hectoliter weight in small samples was stressed by Aamodt and Torrie (1934). To overcome it, a 25 cc graduated cylinder, cut off at the 4 cc point, was used to measure the grain from individual plants. Similarly, Harris and Sibbitt (1941) described a procedure for determining test weight in which 4-ml and 16-ml measures were used. The glass measures were made from standard graduated cylinders by cutting off the lower end at the proper height. The discrepancies between the values of the 4 cc micro and standard methods observed in relation to Aamodt and Torrie (1934) were attributed to differences of the technique in making the micro determinations (Harris and Sibbitt, 1941).
Three decades later, Ghaderi et al. (1971) developed another micro-test weight procedure using a small (47 ml) glass jar to evaluate fifty-nine cultivars and advanced lines of soft winter wheat. They reported a high correlation (r=0.982) between their values and the standard test weight, suggesting a micro-test to be a reliable predictor.
Using a glass 100-cm3 graduated cylinder (approximate height: 248 mm, sub-divisions: 1 mL), Donelson et al. (2002) also evaluated the hectoliter weight in 20 and 40 g wheat samples. They observed a relationship between specific gravity and linear weight test unless the samples were severely shriveled. While both 20 and 40 g samples produced satisfactory data, those of 40 g were statistically superior.
More recently, Stepochkina and Stepochkin (2015) evaluated wheat grains in a small cylindrical container (diameter 1.8 cm, height 1.125 cm) of 2.86 cm3 volume. On comparison with standard 0.25 Lchondrometer, they found a correlation coefficient of 0.98.
As the methodologies described above are based on the use of different volumes of the glass-graduated cylinders, no standard equipment has been made till date to determine hectoliter weight in small samples. The objective of this work was to evaluate the feasibility of using a new 15.30 ml microchondrometerto achieve this goal in small wheat samples.
MATERIALS AND METHODS
The 15.30 ml microchondrometer, which requires about 20 g of wheat grains, was designed and manufactured based on a 250-ml chondrometer of the DalleMolle® company. The specifications of 250 ml and 15.30 mlchondrometers were respectively: total height (cm): 39.00 and 18.60; total weight (g): 949.32 and 639.60; external diameter (mm): 56.18 and 28.49; cutter bar (g): 70.55 and 16.43; piston volume (cm3): 61.58 and 3.59.
In order to evaluate the efficiency of the new equipment, two experiments were conducted in 2016 and 2017, at the Instituto Agronômico do Parana (IAPAR), Londrina, Brazil, to compare the data between the microchondrometer and commercial 250-ml chondrometer. The hectoliter weight was evaluated by weighing the grains that filled the cylinder on a digital scale (Marte® AS2000; 0.01 g). The weights thus obtained were multiplied by 6.5359 for the 15.30 ml microchondrometer and 0.4 for the 250-ml chromometer.
The first experiment was conducted to evaluate the need to compress the wheat grains inside the microchondrometer cylinder, while the second was designed to verify the effect of the piston weights. Approximately 800 g of wheat grain samples used in both experiments were obtained from experimental plots, farmers' fields and samples submitted to forced sprouting in a humid chamber.
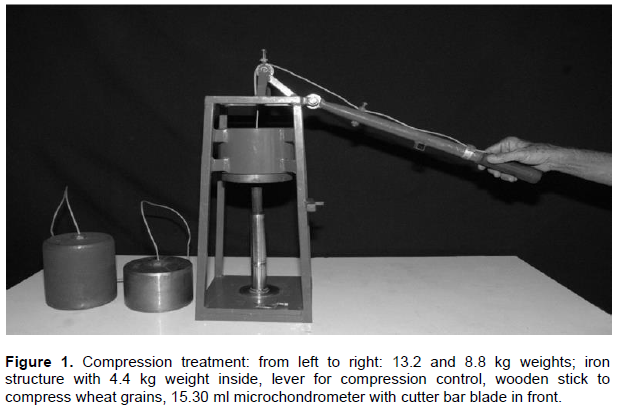
The compression experiment consisted of four treatments (0; 4.4; 8.8; and 13.2 kg weights) in the microchondrometer, using 28.44 g piston. With the exception of the check (0 kg), the treatments were applied to the upper part of the samples placed inside the microchondrometer. The weights were applied by means of an iron structure, using steel cable, pulley and lever, and released on top of the grain samples with a wooden rod (18.05 mm in diameter and 13.70 cm in length) (Figure 1). Fifty wheat grain samples were evaluated by microchondrometer, in three replications, for two years and the results were compared with the data from commercial 250-ml chondrometer.
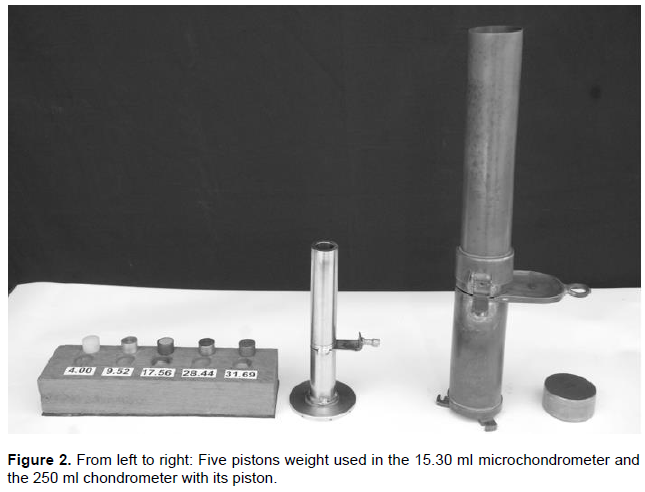
Additional evaluations were performed to verify the effect of the microchondrometer piston weights on the hectoliter weight. Five different piston weights (4.0, 9.52, 17.56, 28.44, 31.69 g) were used, with the same volume, made of plastic, aluminum, bronze with durepoxy, steel and bronze, respectively. Sixty wheat grain samples were evaluated, in three replications, for two years and the results were compared with the data from commercial 250-ml chondrometer (Figure 2).
The mean values (three replications) off our compression treatments and five piston weights were compared between two chondrometers using the Spearman´s correlation coefficient and the Student's t-test by the Microsoft Excel 2013 software and SAS package (SAS, 2001).
RESULTS
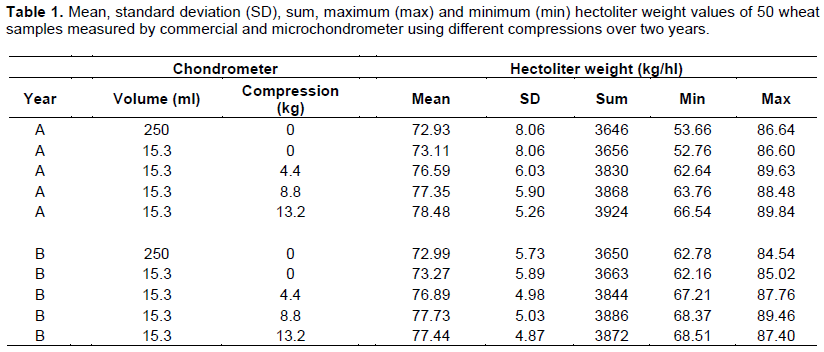
The wheat grain samples used in the two experiments represented a wide range and contrasting values of hectoliter weight. In the compression experiment, the values obtained with the commercial 250-ml chondrometer ranged from 53.66 to 86.64 kg hl-1 in the first year and from 62.78 to 84.54 kg hl-1 in the second year (Table 1).
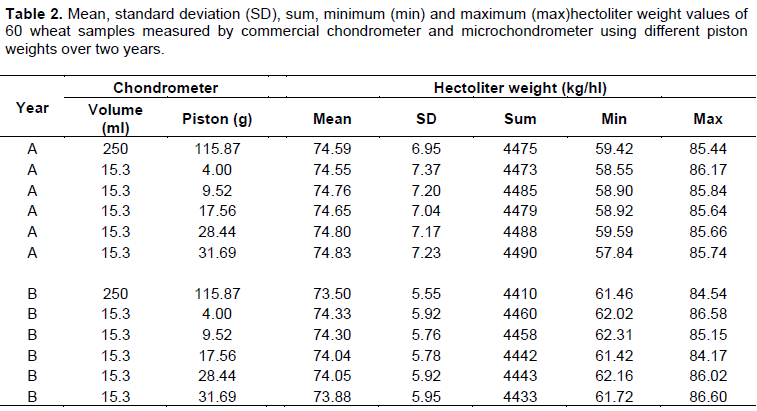
In the experiment to evaluate pistons weight, the values ranged from 59.42 to 85.44 kg hl-1 in the first year, and from 61.46 to 84.54 kg hl-1 in the second year (Table 2).
The compression experiment was conducted to evaluate grain compaction, especially those of sprouted kernels with radicle. The results of the four compression treatments for each of the 250-ml chondrometer and the 15.30 ml microchondrometer are presented in Table 3. The comparison by Student’s t-test demonstrates no significant difference (p>0.05) between the instruments without compression. However, there were significant differences between the instruments for compression weight of 4.4 kg (p<0.05), and for 8.8 and 13.2 kg (p<0.01).
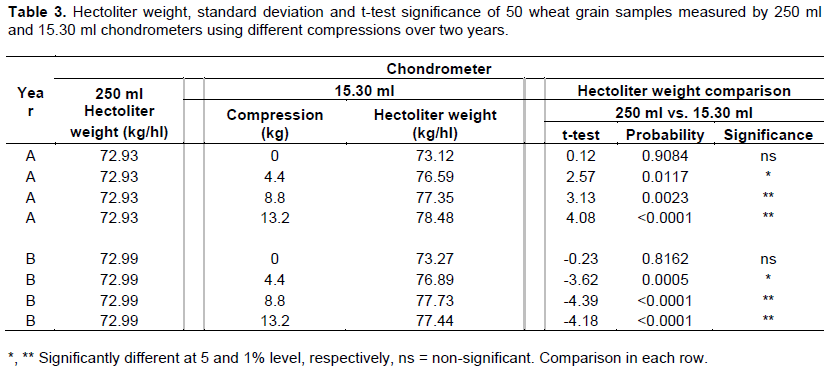
In terms of predictability of test weight by the microchondrometer, the treatments without compression demonstrated highly significant (p<0.001) correlation values, with r=0.9969 and r=0.9954, for the first and second year, respectively. However, an increase in the compression weight reduced the level of correlation between the two instruments for the remaining three treatments (4.4; 8.8 and 13.2 kg). These values, highly significant (p<0.001), were 0.9969, 0.9875, 0.9242 and 0.9954, 0.9691, 0.9699.
The results of the second experiment to compare five same-volume microchondrometer pistons, made of plastic, aluminum, bronze with durepoxy adherent, steel and bronze (representing4.0, 9.52, 17.56, 28.44, and 31.69 g respectively), with 250-ml commercial chondrometer showed no significant differences (p>0.05) by t-test for each piston weight (Table 4).
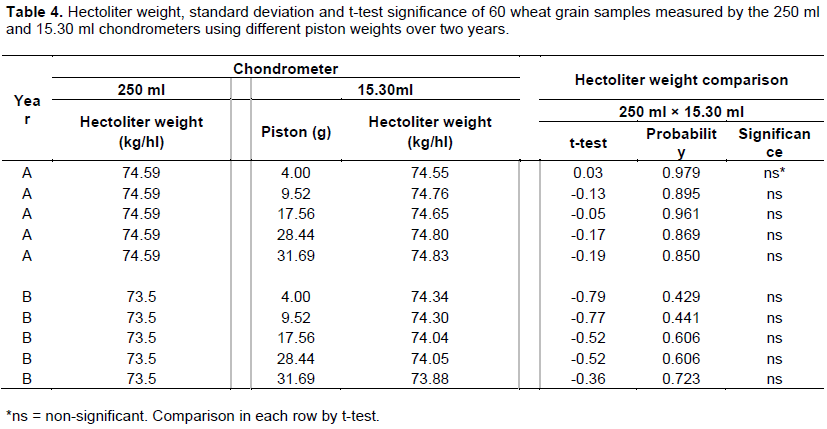
In addition, no significant differences (p>0.05) were observed when the primary steel piston of 28.44 g was compared with other piston weights (4.0; 9.52; 17.56; 31.69 g). The correlation between the 250-ml chondrometer with 15.30 ml chondrometers for 4.00, 9.52, 17.56, 28.44 and 31.69 g pistons were highly significant (p<0.001), with values of 0.9948, 0.9963, 0.9959, 0.9953, 0.9967 and 0.9869, 0.9878, 0.9872, 0.9922,0.9909 for the first and second year, respectively.
DISCUSSION
It is important to point out that the predictability values seen in the compression experiment are significantly higher than those of Aamodt and Torrie (1934), who obtained a positive correlation of 0.947 for 184 samples of spring wheat and 0.834 for 59 samples of winter wheat. As mentioned earlier, they used a 4-ml micro test weight tube, obtained by cutting down a 25-ml graduated cylinder and multiplied the values by 20 to get a close approximation of the test weight in pounds per bushel, as determined by the standard apparatus. They concluded that the differences were very small and insignificant for all practical purposes.
Similarly, Ghaderi et al. (1971), who used a small glass jar (47 ml. capacity) to evaluate fifty-nine soft wheat samples, achieved a correlation of 0.982 with the standard test weight, considering it a reliable prediction. They stressed on the use of the most rapid procedure to measure test weight in a breeding and selection program since the correlation between test weight and kernel packing efficiency was highly significant (r=0.961).
Using the 100-cm3 glass graduated cylinder, Donelson et al. (2002) reported that 40 g samples produced better statistical relationships than 20 g samples. Also, they found a linear relationship between specific gravity and the test weight, except for the samples that were severely shriveled. In other words, when grains are not well formed or have problems in their shape, size and weight, the graduated cylinder has limitations to measure hectoliter weight.
In the present study, which represents a wider range of test weight values, the correlation coefficients are higher than those obtained by Aamodt and Torrie (1934), Ghaderi et al. (1971) and Stepochkina and Stepochkin (2015). Also, the 15.30 ml device is easier to be operated than that built by Taylor (1965) and more efficient than the one used by Donelsen et al. (2002). These results not only vouch to the usefulness of our microchondrometer for small research samples but also confirm its excellent predictability for measuring test weight in wheat. It is relevant to point out that two years of comparison between the 15.30 ml microchondrometer and commercial 250 ml chondrometer, yielded no significant difference between the two instruments. Despite its smaller diameter and volume, the 15.30 ml microchondrometer has proven to be a reliable device to evaluate test weight under a wide range of conditions. Well-formed grains or severely shriveled and germinated grains have all resulted in providing consistent test weight values with high precision and without extra work to compress samples. The piston weights did not affect the results of the hectoliter weight in the microchondrometer. We believe it to be a very important result and conclusion because it widens the range of materials which can be used in its manufacture.
The wide variation of hectoliter weight measured with the microchondrometer, using a piston of 28.44 g, ranged from 59.59 to 85.66 kg hl-1 in the first year and from 62.16 to 86.02 kg hl-1 in the second year. Such ranges of measurements guarantee that this new device can be used efficiently to evaluate test weight for all purposes where the sample size is small.
It may be pointed out that this new microchondrometer does not aim to replace the standard 250-ml chondrometer. It was built to facilitate the measurement of the hectoliter weight in research experiments carried out in the greenhouse and individual plants which is not done otherwise due to lack of adequate equipment. As a result, important information regarding plant health, quality of grain filling and grinding are lost.
According to Protic et al. (2007), the test weight varies from 60 to 84kg hl-1 and values below 76 kg hl-1 are classified as those of low quality. The Brazilian standard norms establish the following minimum values of hectoliter weight for different purposes: wheat for grinding and other purposes, type 1 (78 kg hl-1); type 2 (75 kg hl-1) and type 3 (72 kg hl-1). A test weight value of less than 72 kg hl-1 is considered to mistype, unacceptable for the industry and to be commercialized for feed purposes (Brasil, 2010).
Based on two-years of data, we are confident that the new microchondrometer of 15.30 ml, which requires approximately 20 g of wheat sample, can be used for a wide range of grain conditions to determine hectoliter weight. It is also an excellent option in researches conducted in greenhouse, individual plants, segregating populations, nutritional treatments, disease assessment and germinated samples, where the grain volume is a limiting factor to use commercial 250-ml chondrometer. Besides agronomic characteristics such as productivity, resistance to biotic and abiotic stresses and grain quality traits, the use of the microchondrometer to measure hectoliter weight in breeding populations may set a good benchmark for elimination of genotypes that do not meet the minimum requirements of the market.
CONCLUSION
There was no need to compress grain inside the microchondrometer and the different piston weights did not influence the hectoliter weight measurements. The highly significant correlation coefficient (r=0.99) between the 250 ml and 15.30 ml devices showed that the new 15.30 ml microchondrometer is an excellent alternative for hectoliter weight assessment in small wheat samples.
ACKNOWLEDGMENTS
The authors thank Mr. Fernando Izumi, Research Assistant, Department of Production and Experimentation and Dr. Paulo Roberto Abreu de Figueiredo, Agricultural Engineering Area, IAPAR, for helping in the development and molding of microchondrometer, pistons, and structures used in this study.
CONFLICT OF INTERESTS
The authors have not declared any conflict of interests.
REFERENCES
|
Aamodt OS, Torrie JH (1934). A simple method for determining the relative weight per bushel of grain from individual wheat plants. Canadian Journal of Research 11:589-593. |
|
|
Botelho FM, Faria BMEM, Botelho SCC, Ruffato S, Martins RN(2018). Metodologias para determinação de massa específica de grãos. Revista Agrarian 11(41):251-259. |
|
|
Brasil (2010). Ministério da Agricultura, Pecuária e Abastecimento. Instrução Normativa n° 38, de 30 de novembro de 2010. Regulamento técnico do trigo. Diário Oficial da República Federativa do Brasil, Brasília, DF, n 229, Seção 1. |
|
|
Deivasigamani S, Swaminathan C (2018).Evaluation of seed test weight on major field crops. International Journal of Research Studies in Agricultural Sciences 4(1):8-11. |
|
|
Donelson JR, Gaines CS,Andrews LC, Finney PF (2002). Prediction of test weight from a small volume specific gravity measurement. Cereal Chemistry 79(2):227-229. |
|
|
Durazzo A, Casale G, Melini V, Maiani G, Acquistucci R (2015).Evaluation of antioxidant properties in cereals: study of some traditional Italian wheats. Foods 4(3):391-399. |
|
|
Ghaderi A, Everson EH, Yamazaki WT (1971). Test weight in relation to the physical and quality characteristics of soft winter wheat (Triticum aestivum L. emThell). Crop Science 11:515-518. |
|
|
Harris RH, Sibbitt LD (1941). An investigation of micro methods in comparison with the standard method of determining the test weight of hard red spring wheat. Dakota Agricultural Experiment Station Bimonthly Bulletin 3(4):23-27. |
|
|
Harris RH, Sibbitt LD (1942). The utility of micro methods of test-weight determination with hard red spring wheat. Cereal Chemistry 19:458-467. |
|
|
Ilker E, AltinbaÅŸ M, Tosun M (2009).Selection for test weight and kernel weight in high yielding wheat using a safety-first index. Turkish Journal of Agriculture and Forestry 33:37-45. |
|
|
Iqbal M, Moakhar NP, Strenzke K, Haile T, Pozniak C, Hucl P, Spaner D (2016). Genetic improvement in grain yield and other traits of wheat grown in western Canada. Crop Science 56(2):613-624. |
|
|
Isleib J (2012). Test weight in small grains. Michigan State University Extension. |
|
|
Joshi A, Kumar A, Budhlakoti V, Bhatt N, Prasad B (2018). Analysis of variance and estimation of genetic variability parameters for quality traits in bread wheat (Triticumaestivum L. em.Thell) genotypes. International Journal of Chemical Studies 6(5):369-372. |
|
|
Manley M, Engelbrecht ML, Williams PC, Kidd M (2009). Assessment of variance in the measurement of hectolitre mass of wheat, using equipment from different grain producing and exporting countries. Biosystems Engineering 103(2):176-186. |
|
|
Protic R, Miric M, Protic N, Jovanovic Z, Jovin P (2007). The test weight of several winter wheat genotypes under various sowing dates and Nitrogen fertilizer rates. Romanian Agricultural Research 24:43-46. |
|
|
SAS (Statistical Analysis System) (2001).Version 8.2.SAS Institute Inc., Cary, NC, USA. |
|
|
Stagnari F, Codianni P, Pisante M (2008). Agronomic and kernel quality of ancient wheats grown in central and southern Italy. Cereal Research Communications 36(2):313-326. |
|
|
Stepochkina NI, Stepochkin PI (2015). Use of microchondrometer for determination of grain nature of single plants of triticale and wheat. Dostizheniyanauki i tekhniki APK 29(11):39-40. |
|
|
Taylor AC (1965) A microchondrometer for determining bushel weight. Australian Journal of Experimental Agriculture and Animal Husbandry 5(17):158-160. |
|
Copyright © 2024 Author(s) retain the copyright of this article.
This article is published under the terms of the Creative Commons Attribution License 4.0


