ABSTRACT
Coffee has the characteristic of ripening unevenly. Production through wet process favors ripe berries. The fraction of green and green-cane fruit on the coffee tree is normally treated as an inferior quality product. The objective of this work was to evaluate the physical and sensorial aspects of the quality of green-cane and cherry coffee produced through wet process. Batches of coffee were separated according to ripeness and pulped. Drying was carried out on raised patios until reaching 11% wb. After processing, the beans were selected and classified by size. The sensorial analysis was performed through cupping using the scale of the Brazilian Specialty Coffee Association (BSCA). The experiment was installed at DBC with seven blocks each containing four plots, the source of variance being the ripeness on two levels: cherry and green-cane. The data was submitted to variance analysis (ANOVA) and the averages compared using F test at 5%. Green-cane coffee presented better yield both in sieving and dry mass, as well as a higher quantity of defects. The final cup quality rating did not differ in regard to ripeness. The pulped green-cane coffee may have added value for its beverage quality.
Key words: Sensory analysis, processing, classification, grains, yield.
In the coffee producing regions of Brazil, the dry period, typically occurring in winter, promotes the differentiation and development of flower buds, with the opening of the flowers beginning with the first rains of spring. From September to December, the coffee tree may present various flowerings, making the development and maturation of the fruits uneven, with green, ripe or dry berries occurring on the same plant (Carvalho et al., 2014; Ságio et al., 2013).
Ripeness is a factor of great importance to coffee quality and a large part of the defects known as blacks, greens or rancids (BGR) can be attributed to the harvesting of unevenly ripened fruit. The cherry stage is considered the ideal point for quality (Folmer, 2014). However, selective harvesting of ripe fruit is labor intensive, which increases the production cost and often makes its practice non-viable (Silva et al., 2013).
Significant contributions to the improvement of quality and consequential remuneration are attributed to the production of coffee through wet process. In this system, after washing, the dry green fruits are separated from the ripe fruits known as cherries and are pulped. The fraction of immature fruits removed from each batch of coffee can generally be differentiated into green and green-cane categories. Morais et al. (2008) demonstrated, through a phenological scale, that the ripeness of coffee begins with green berries, which pass to green-cane and subsequently cherry. The green-cane stage, for being close to maturity, already presents characteristics which enable pulping.
The present research has the objective of determining, in comparison to cherry fruits, the potential of the physical and sensorial quality of coffee harvested at green-cane stage when produced through wet process.
Samples obtained from seven batches of recently harvested Arabica coffee (Coffea arabica) were used. Batches 1, 2, 3, 4 and 5 were composed of fruits predominantly from the Catuaí cultivar, harvested on properties in the region of the Viçosa municipality, whose average altitude varies from 673 to 803 m. Batches 6 and 7 were harvested from plantations of the Catuaí cultivar located in the Vargem Alta municipality - ES, at 870 and 1000 m in altitude, respectively. The batches were sent to The Coffee Processing Unit of the Federal University of Viçosa.
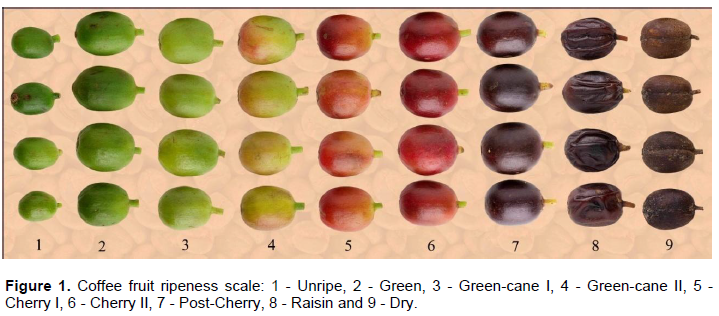
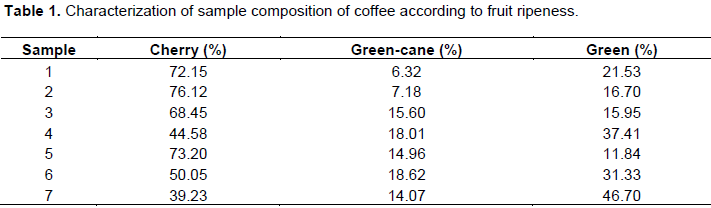
For the characterization of the batches as to ripeness, the classification of the coffee berries was performed based on Figure 1. In Table 1 we can find the characterization of the batches as to percentage of cherry, green-cane and green fruits.
Production
The batches were submitted to wet process production. The green and green-cane coffee berries were mechanically separated from the cherry fruits in the pulping machine (DC-12-SDV-11: Pinhalense-SA). The equipment was adjusted so that fully mature berries were pulped during the first run, with a tolerance of up to 5% of the cherry fruit being made up of green and green-cane fruit. The cherry coffee was pulped while the green and green-cane berries continued onto a second pulping machine (DC-6S-SV-11: Pinhalense-SA), which carried out a further separation, predominantly pulping green-cane fruits. Next the pulped cherry coffee was submitted to mechanical demucilage in a mucilage removal machine (DFA-3: Pinhalense-SA). The green-cane coffee in parchment was not subjected to demucilage as it naturally has a lower quantity of mucilage, besides which, the mucilage removal of this fraction may cause unnecessary damage to the beans. 240 L of pulped coffee was used in each batch: 120 L of cherry beans and 120 L of green-cane beans in parchment.
Initially, the beans in parchment were spread out over a concrete patio in the open air during the day, for pre-drying. After this period, the coffee was transferred to a raised patio where it remained until reaching a moisture content of around 11%. During the period of pre-drying and drying, the coffee was turned every 30 min to guarantee even moisture distribution. Every day, at 16:00, the grains were gathered up and then spread out again the next morning at 08:00. The moisture of the grains was monitored using a digital grain moisture tester (Gehaka - G600).
After drying, the samples were stored in 70 × 90 cm raffia sacks, and left to rest for a period of approximately 30 days. Then, with the objective of removing the parchment, the coffee was processed in a small hulling machine, D100 model (Pinhalense S/A). The processed grains were wrapped in 50 × 70 cm polyethylene plastic bags, which were stored at a temperature close to 23°C, sheltered from light and humidity, thus preserving the quality of the product.
Standardization of the batches of coffee was carried out between 15 and 20 days after processing, with the aim of generating homogenous samples in regard to bean size, aspect and type. Initially, the grains of each batch were screen sorted by size, using a size 16 round sieve, making use of the retained coffee, classified as screen s16 and above. Beans with intrinsic defects (Blacks, Rancids, Greens, Withered, Ragged, Crushed or Bored) and extrinsic defects (Shells, Twigs, Stones, Husks or Boat Shaped) were removed to obtain samples of type 2 coffee, which allows a lower number of defects, according to the Official Table of Imperfect and Impure Bean Equivalence (Brasil, 2003).
Samples of 100 g of processed coffee without defects and previously sorted using screen 16 and above were passed through circular sieves to separate by bean size, obeying the following decreasing sequence: Screen 20, 19, 18, 17, and 16. After the separation of beans into different sizes, those retained in each sieve were weighed and the percentage of retained beans was calculated for each size, in relation to the total weight.
For each individual sieve and a control sample of screen 16 and above, the weight of dry matter of 100 beans was determined, using the gravimetric method in a kiln at 105°C for 24 h. For weighing, precise digital scales with three decimal places were used (AL500S: Marte).
Bean samples of screen 16 and above without defects were submitted to sensorial analysis. Cupping was carried out by a team of accredited tasters from the Brazilian Specialty Coffee Association (BSCA), using the Cup of Excellence (CoE) methodology, perfected by the BSCA (2010). Eight sensorial attributes were evaluated (cleanliness, sweetness, acidity, body, taste, aftertaste, balance and overall rating), which received ratings of 0 to 8 according to the intensity each factor presented in the sample. The sum of the ratings, added to 36 base points, corresponded to the final classification of the beverage. The samples that obtained a rating above 80 were classified as specialty coffee. The experiment was installed at DBC with seven blocks, each containing four plots, source of variation being ripeness on two different levels: Cherry fruit and green-cane. Data was submitted to variance analysis (ANOVA) and the averages compared by f test at 5%. The statistical analyses were performed using SAEG 9.1 software (2007).
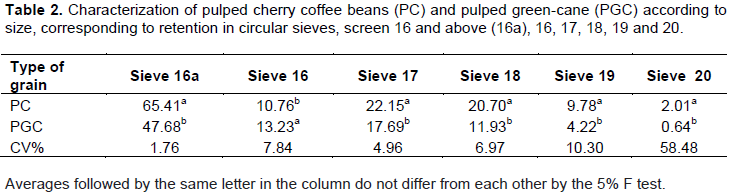
For percentages of beans at size 16 and above, 17, 18, 19 and 20 had higher percentages of the cherry fraction, while the percentage of beans in screen 16 was greater in the green-cane fraction (Table 2).
Coffee beans are classified according to size: small (screen 13 and 14), medium (screen 15 and 16) and large (screen 17, 18, 19 and 20) (Brasil, 2003). The quantity of beans in screen 16 and above is an important characteristic in virtue of the fact that this formation has greater acceptance and is more commercially valuable, especially on the international market (Clemente et al., 2015).
Wet process production with double separation enabled the recognition and better usage of the green-cane fraction, which even with a predominance of immature fruit possesses a quota of beans with characteristics close to those of cherry beans.
According to Pezzopane et al. (2003) and Morais et al. (2008), the development of coffee tree berries passes through a series of distinct stages, whereby grain filling precedes ripening. According to these authors, the green-cane coloring marks the beginning of ripening, when the berries begin to change from green to yellow, evolving until the cherry stage. Thus green-cane berries contain grain filled beans.
The largest proportion of beans in screen 16 being in the green-cane fraction and the value inversion in larger sieves reflects the greater production potential for larger beans in cherry fruits. The expansion phase of the cherry fruits and the filling of beans may have advantages in regard to green-cane berries, due to the greater disposition of nutrients in the first months of fruitage, especially potassium, which is essential for the growth and accumulation of dry matter (Taiz and Zeiger, 2010).
For fruits at the cherry stage, the dry mass of 100 beans was higher in the cherry fraction for all the evaluated variables (Table 3). Weight difference between the cherry beans and the green-cane beans was more accentuated in screen 16 and above. In the other sieves, 16, 17, 18 and 19, there was a tendency towards the levelling out of these values. This is due to the cherry fruits presenting a higher percentage of beans in the bigger sieves as demonstrated in Table 2. Therefore, the cherry fraction of beans in screen 16 and above contained larger beans, which reflects in the weight difference.
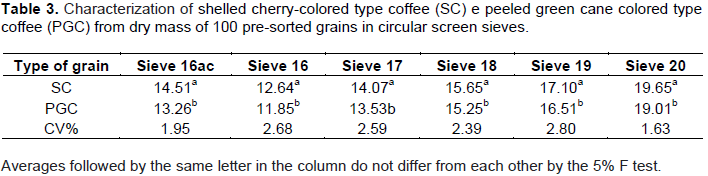
Ripeness of the berries is one of the factors affecting the weight of the coffee beans. The results obtained in this study showed beans at the green-cane stage with an accumulation of dry matter above 90% of that achieved by beans from cherry fruits. In the studies of Angelico et al. (2011), differences were also found in the weight of beans originating from berries at different stages of ripeness, the highest average being obtained from the cherry stage, followed by the mixed portion and green/green-cane stages and raisin/dry.
Coffee berries at the green-cane stage have already begun the maturation process (Morais et al., 2008). The development cycle of berries from C. arabica cultivars normally varies between 180 and 240 days, a period determined principally by genetic constitution and climate conditions (Pezzopane et al., 2003; Livramento, 2010; Carvalho et al., 2014).
According to Pezzopane et al. (2009), the transition from green-cane to cherry stage varies from 8 to 20 days. According to Dubberstein et al. (2016), the accumulation of dry matter in fruits starts from the stage of fruit expansion and granulation-maturation, and the importance of knowledge about absorption, mobilization and accumulation of nutrients for coffee fruits in the cherry stage is an important tool to estimate the nutritional needs of the crop. In studying dry matter in fruits of conilon coffee with different ripening cycles, Partelli et al. (2014) in all cases, the period of fruit formation presented sigmoidal behaviour, an initial stage with less expressive accumulation rates, followed by a stage of rapid expansion and the highest rates, and a final stage with less expressive rates at the end of the cycle of fruit formation.
Based on the results and reports of the literature, it can be understood that green-cane coffee berries may present weight yield close to that of cherry fruits. However, it should be highlighted that the coloring of the fruit is not always a good indicator of ripeness as it may, for example, be influenced by extrinsic factors such as pests, diseases and dry spells among other things (Taiz and Zeiger, 2010).
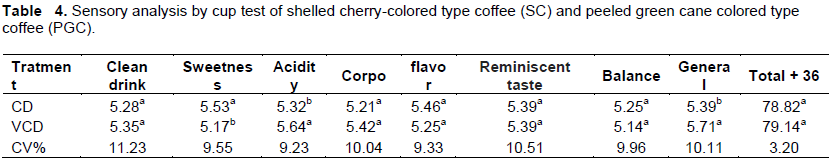
In the sensorial analysis by cupping, the attributes of cleanliness, body, taste, aftertaste and balance did not present differences between the ripeness stages. Sweetness stood out in the cherry fruit as being more highly rated than green-cane coffee, while acidity and overall rating were more pronounced in the green-cane beans.
The final rating did not differ between the cherry and green-cane beans, whereby the achieved ratings fell into the category of “Softish”, considered a superior quality beverage (Table 4).
Lack of differentiation between the majority of the attributes, as well as final rating of the cup test for coffee beans at different stages of ripeness has also been reported by other authors. Pimenta et al. (2008), in aiming to verify the quality of coffee at different stages of ripeness, analyzed coffees harvested at seven different times, obtaining a classification of all the treatments as “Hard” beverage, demonstrating that, in general, the harvest time does not affect the quality of the beverage. Angelico et al. (2011) analyzed the influence of the ripeness stage of the beans (dry, cherry and green) on the quality of the beverage through consumer preference, obtaining a similar beverage classification for batches made up of 100% cherry beans and 60% cherry 40% green. Simões (2009), studying the quality of coffee produced through dry process in batches with different ripeness levels, obtained similar quality and concluded that the proper handling and the elimination of defects enabled batches of coffee with high rates of immature fruit to present good quality beverages.
Regarding attributes of sweetness, acidity and overall rating, intrinsic characteristics of the batches of coffee may be related to their levels of expression as a result of ripeness. According to Laviola et al. (2008), the accumulation of soluble sugars occurs in the final half of the grain filling stage and during the ripening of the coffee tree berries, the climate being a factor that can influence this characteristic.
Beans originating from coffee berries at the green-cane stage presented lower screen yield and dry matter in relation to cherry coffee.
The 16 and above screen fraction without defects obtained from green-cane coffee berries presented a beverage of similar quality to cherry coffee.
The authors have not declared any conflict of interests.
REFERENCES
|
Angelico CL, Pimenta CJ, Chalfoun SM, Chagas SJR, Pereira MC, Chalfoun Y (2011). Diferentes estádios de maturação e tempos de ensacamento sobre a qualidade do café. Coffee Sci. Lavras 6(1):8-19.
|
|
|
|
BRASIL (2003). Ministério de Estado da Agricultura, Pecuária e Abastecimento. Instrução Normativa nº 8, de 11 de junho de 2003. Dispõe de Regulamento Técnico de Identidade e de Qualidade para a Classificação do Café Beneficiado Grão Cru. Brasília, DF P 12.
|
|
|
|
|
BSCA (2010). Brazil Specialty Coffee Association. [Associação Brasileira de Cafés Especiais (BSCA)]. Disponível em:<www.bsca.com.br>. Acesso em novembro de 2010.
|
|
|
|
|
Carvalho HP, Camargo R, Gomes MWN, Souza MF (2014). Classificação do ciclo de desenvolvimento de cultivares de cafeeiro através da soma térmica. Coffee Sci. Lavras 9(2):237-244.
|
|
|
|
|
Clemente ACS, Cirillo M.A, Malta MR, Caixeta F, Pereira CC, Rosa SDVF (2015). Post-harvest operations and physicochemical and sensory quality of coffees. Coffee Sci. Lavras 10(2):233- 241.
|
|
|
|
|
Dubberstein D, Partelli FL, Dias JRM, Espindola MC (2016). Concentration and accumulation of macronutrients in leaf of coffee berries in the Amazon, Brazil. Australian J. Crop Sci. Brisbane 10(5):701-710.
Crossref
|
|
|
|
|
Folmer B (2014). How can science help to create new value in coffee? Food Res. Int. 63:477-482.
Crossref
|
|
|
|
|
Laviola BG, Martinez HEP, Salomão LCC, Cruz CD, Mendonça SM, Rosado L (2008). Acúmulo em frutos e variação na concentração foliar de NPK em cafeeiro cultivado em quatro altitudes. Biosci. J. 24(1):19-31.
|
|
|
|
|
Livramento DE (2010). Morfologia e Fisiologia do Cafeeiro. In: Reis, P.R; Cunha, R.L. (Org.). Café arábica: do plantio à Colheita. 01:87-162.
|
|
|
|
|
Morais H, Caramori PH, Koguishi MS, Ribeiro AMA (2008). Escala fenológica detalhada da fase reprodutiva de Coffea arabica. Bragantia 67(1):693-699.
Crossref
|
|
|
|
|
Partelli FL, Espindula MC, Marré WB, Vieira HD (2014). Dry matter and macronutrient accumulation in fruits of Conilon coffee with different ripening cycles. Rev. Bras. Ciênc. Solo 38:1.
Crossref
|
|
|
|
|
Pezzopane JRM, Pedro Júnior MJ, Thomaziello RA, Camargo MBP (2003). Escala para avaliação de estádios fenológicos do cafeeiro arábica. Bragantia 62(3):499-505.
Crossref
|
|
|
|
|
Pezzopane GC, Favarin JC, Maluf MP, Pezzopane JCM, Guerreiro FO (2009). Atributos fenológicos e agronômicos em cultivares de cafeeiro arábica. Ciência Rural 39(3):711-717.
Crossref
|
|
|
|
|
Pimenta CJ, Pereira MC, Chalfoun SM, Angelico CL, Carvalho GL, Martins R (2008). Composição química e avaliação da qualidade do café (Coffea arabica L.) colhido em diferentes épocas. Rev. Bras. de Armazenamento 10:29-35.
|
|
|
|
|
SAEG software (2007). Sistema para Análises Estatísticas, Versão 9.1: Fundação Arthur Bernardes - UFV - Viçosa.
|
|
|
|
|
Ságio SA, Lima AA, Barreto HG, Carvalho CHS, Paiva LV, Chalfun Junior A (2013).. Physiological and molecular analyses of early and late Coffea arabica cultivars at different stages of fruit ripening. Acta Physiologiae Plantarum.
Crossref
|
|
|
|
|
Silva FC, da Silva FM, da Silva AC, de Barros MM, Palma MAZ (2013). Desempenho operacional da colheita mecanizada e seletiva do café em função da força de desprendimento dos frutos. Coffee Sci. Lavras 8(1):53-60.
|
|
|
|
|
Simões RO (2009). Qualidade do café (Coffea arabica L.) pré-processado por via seca. 2009. 121f. Dissertação (Mestrado em Engenharia Agricola) - Universidade Federal de Viçosa, Viçosa, MG.
|
|
|
|
|
Taiz l, Zeiger E (2010). Plant physiology. 5th ed. Sunderland: Sinauer Associates, 2010.
|
|