ABSTRACT
A global positioning system (GPS) based soil survey was conducted during September 2011 in the sugarcane dominant tracts of Theni district, Tamil Nadu to map the soil fertility status using GIS software and link with different cane yield potentials. The soil samples were taken from 400 spatially distributed locations from a depth of 0 to 30 cm and analyzed for texture, pH, EC, organic carbon, available nitrogen, phosphorus, potassium and micronutrients viz., Fe, Mn, Zn and Cu. The ‘Asis’ survey data regarding fertilizer management practices, adoption of new technologies, irrigation practices and other crop production techniques were also collected from the farmers. The interpolated maps for the status of macro and micronutrients show a clear deficiency of available Nitrogen in 96% of the soil samples of the cane growing areas and DTPA – extractable Zn deficiency in almost 60% of the regions surveyed. However, the available phosphorus and potassium contents were reported to be moderate to high in 90% of the samples indicating the possibility to reduce the P & K fertilizer application to sugarcane in this tract of Tamil Nadu. Majority of the soils were sandy loam to sandy clay loam in texture and reported to have low organic carbon context (<0.5%). The outcome of this study has provided an insight into the unbalanced fertilization practices adopted in some of the cane dominant tracts of this district and the need to evolve a GIS based balanced fertilization model through the conduct of field experiments with graded levels of fertilizer doses and Institute (TNAU) – Industry (RSCL) recommended packages.
Key words: Geographic information system (GIS) database, sugarcane, Tamil Nadu, nutrient management.
India is the world’s largest producer of sugarcane. Sugarcane is cultivated in about 5.04 million ha producing about 340.56 million tons of cane with an average productivity of 67.57 tonnes/ha (Economic Survey, 2013). The prime concern of cane growers and the sugar industry is to achieve higher sugarcane support maximum economic returns. The widely varying soil fertility domain is a major limitation for reaching this goal (Mani et al., 2007).
Periyar Vaigai command area of Theni district, Tamil Nadu comprising of about 4,400 ha of sugarcane involving about 4,500 cane fields needs to be spatially and temporally assessed and mapped for its fertility status and to formulate balanced fertilizer recommendation for maximizing sugarcane productivity. The continuous use of micronutrient free high analysis N, P and K fertilizer in the cropping system with the diminishing use of organic manures has resulted in the depletion of micronutrient cations from the soil reserves (Srivastava et al., 2013). Due to lack of knowledge and institutional incapability to implement the developed norms, farmers apply heavy fertilizer doses without considering the current nutrient status of their soils therefore farmers need to be aware of the nature and severity of the nutrient problems in order to arrive at a prudent decision regarding the kind and dose of fertilizer to be applied (Rashid and Ryan, 2004).
In agriculture, global positioning system (GPS) and geographic information system (GIS) technologies have been adopted for better management of land and other resources for sustainable crop production (Palaniswami et al., 2011). Fertilizer is one of the costliest inputs in agriculture and the use of right amount of fertilizer is fundamental for farm profitability and environmental protection (Mahendra, 2010).
The modern day space age technologies can be adopted for speedy dissemination of the research results on optimum doses of nutrients for maximum farm profitability (Singh et al., 2005) to scientists, industry personnel, extension workers and farmers. One of them is the use of soil fertility maps for fertilizer recommendation with a support to calculate fertilizer doses based on soil test values interactively. Inventory of the available macro and micronutrient status of the soils help in demarcating areas where, the application of particular nutrient is needed for profitable crop production (Sood et al., 2009). Assessment and mapping of fertility status of Ghataprabha command area soils which are being intensively cultivated with high yielding crops like sugarcane, maize, wheat and cotton was carried out using GIS (Binita et al., 2009). However detailed characterization and generation of soil fertility maps for the sugarcane predominant and agriculturally significant Theni district of Tamilnadu is virtually lacking and hence present investigation was carried out.
Soil sampling, processing and analysis
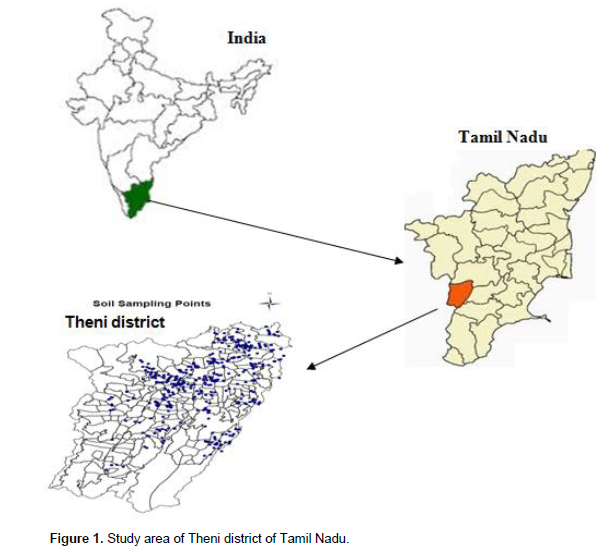
Depending on the variability in physiography, soils and productivity of sugarcane during the previous years, a total of 400 soil samples were collected during the Kharif season of 2011 from the plough layer (0 to 30 cm depth) at an approximate interval of 1 km grid (Figure 1) with the help of hand held global positioning system (GPS) over the major sugarcane growing taluk of Rajshree Sugars and Chemicals Ltd., of Theni district in Tamil Nadu. Each of the taluk maps of Theni district which consist of village boundaries were scanned in tiff format and imported to a GIS system version 9.3. Soil samples were air dried and ground to pass through a 2 mm sieve. The pH and EC was measured with glass electrode in a 1:2.5 soil/water suspension (Jackson, 1973), Organic Carbon estimation by Walkley and Black (1934), available Nitrogen by Subbaiah and Asija (1956), available Phosphorus by Olsen’s extractants of 0.5M NaHCO3 as described by Olsen et al. (1954) estimated by Murthy and Riley method using ascorbic acid as reducing agent and as described by Watanabe and Olsen (1965) using spectrometer with red filter at 660 nm wave length.
Available potassium was extracted with neutral 1N NH4OAc and then measured by flame photometer (Jackson, 1973). The available sulphur in the soil was extracted with 0.15% CaCl2.2H2O solution as described by Williams and Steinberg (1959) and estimated by turbidimetric method (Hesse, 1971). The DTPA extractable micronutrients viz., Iron, Manganese, Zinc and Copper was extracted using 1:2 Soil to extractant ratio (Lindsay and Norwell, 1978), and estimated by atomic absorption spectrophotometer model No: ICE 3300 series.
Generation of maps
The Ground Control points were identified for the district and based on them the map was geo-referenced. The revenue village boundaries were digitized in polyconic mode in. shp format. After digitization, the necessary corrections were done to clean block and revenue village layer for topology building. The villages were assigned different ids in the layer to assign various attributes in the database. Through Arc catalog software, the columns for available N, P, K and available zinc were added in the layer to enter the attribute data. The available nutrient data were imported from Ms-Excel and assigned to polygon attribute table in the layer. From the attribute database, different thematic layers were reclassified to generate various thematic maps on available nutrients of N, P, K and zinc values. The suitable annotations like legend, palettes, north arrow and scale were composed on thematic maps. The thematic maps of available N, P, K and Zinc of Theni district are thus generated and presented. Based on area the sampling sites were fixed and collected uniformly distributed soils (5-10 Nos.) from each revenue village of the divisions. The samples were analyzed, averaged nutrient status and prepared thematic map by using of Arc GIS 9.3 version.
Physico-chemical properties
The soils of the Theni district as assessed in the major blocks are acidic to alkaline in reaction with pH ranging from 4.70 to 9.2 with a mean value of 7.92. The analytical results of the soil samples collected from 8 divisions showed about 36, 24 and 44% of the soils respectively, in the three division’s viz., Jeyamangalam, Theni and Cumbum had a normal pH range of 6.0 to 7.5.
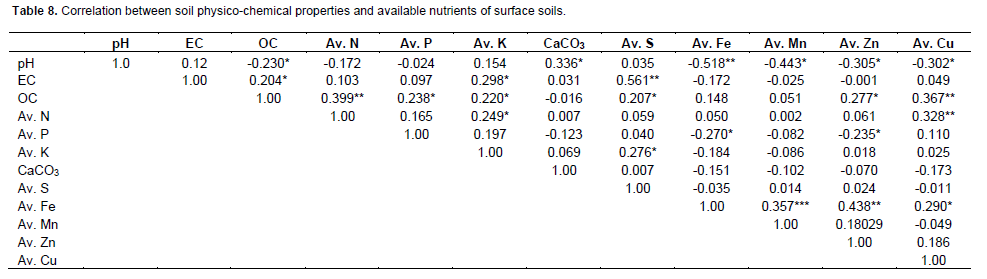
As shown in Table 1, about 52 and 42% of the soils collected from Mayiladumparai division respectively, recorded moderately (7.5-8.5) and highly (>8.5) alkaline pH, while 24% of the soils from Palani Chetti (P.C.) Patti and 28% of Andipatti divisions showed a highly alkaline pH range of 8.5 to 9.2. The variation in pH may be due to the inherent heterogeneity of soils occurrence of various soil types like red, mixed red and black and black soils within the division and to some extent due to influence of parent material and resource region specific differences in the cultural and fertilizer management practices of the cane growers. With the increase of pH the availability of micronutrients decreased, which might be due to precipitation of micronutrients in alkaline soils. This was confirmed by correlation studies that showed the soil pH had significant and negative correlations with available iron (r=-0.5184) and manganese (r=-0.4426) contents.
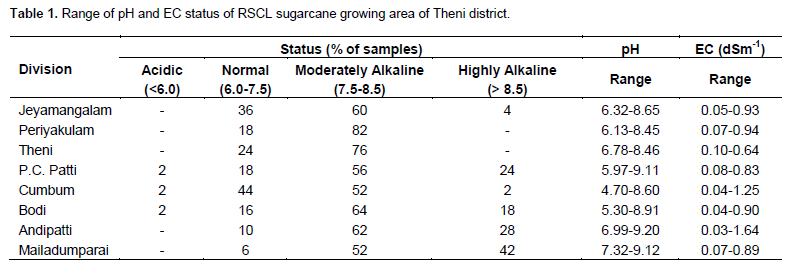
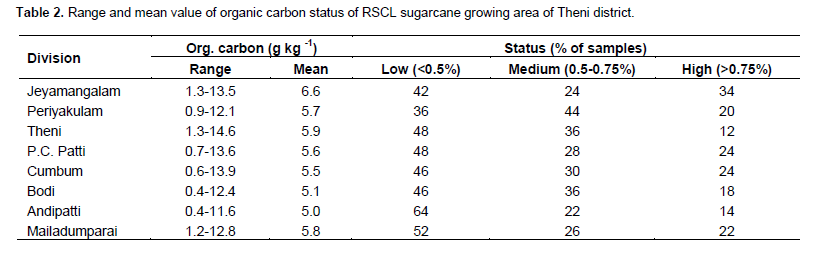
The total soluble salts expressed as electrical conductivity (EC) varied from 0.03 to 1.64 dSm-1 in the soils analysed, invariably all the soil samples collected from the 8 divisions of sugarcane growing area recorded EC of less than 2 dSm-1 indicating that the soils are free from salinity. As shown in Table 2, the available status of organic carbon ranged from 0.4 to 14.6 g kg-1 with a mean value of 5.7 g kg-1. About 36 to 64% of the soils from all the 8 divisions were found to have low organic carbon status (<5.0 mg kg-1). However, about 36% of the soils from Theni and Bodi each were found to have higher organic carbon status.
Available macronutrients
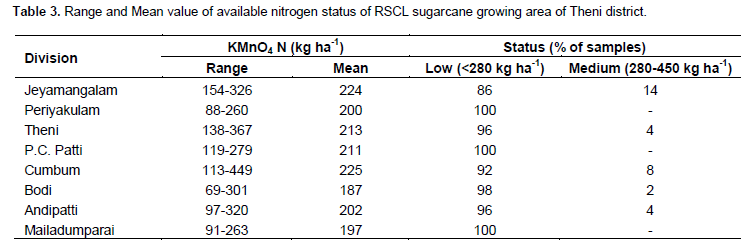
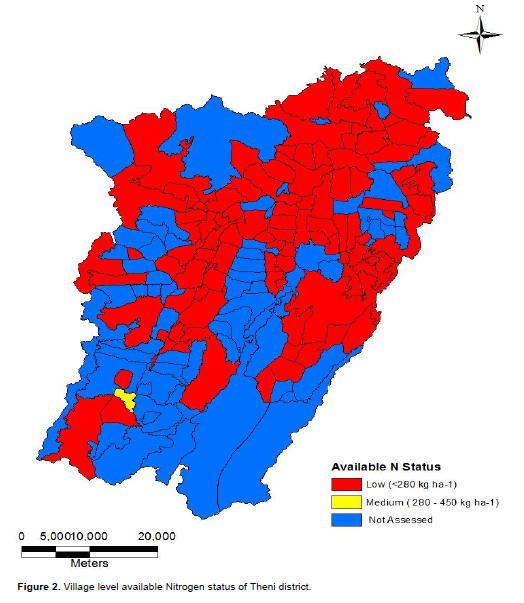
The available nitrogen content of the soil samples varied from 69 to 448 kg ha-1 with a mean value of 207 kg ha-1 in different revenue villages of the sugarcane growing divisions. As shown in Table 3 and Figure 2, the analytical results of the soil samples showed that almost all the soils from the 8 divisions covering an area of 4224 ha (96%) were low in available nitrogen status (< 280 kg ha-1) based on the critical level of 280 kg ha-1 fixed (Muhr et al., 1965). The Cumbum division recorded a wide variation of 113 to 449 kg ha-1 of available nitrogen with a mean value of 225 kg ha-1. The low levels may be ascribed to several factors, such as lower organic carbon and high pH. Soil available nitrogen had significant and positive correlation with organic carbon (r=0.3994**) content. These findings are related with those of Sharma and Singh (2001) and Rakesh Kumar et al. (2009).
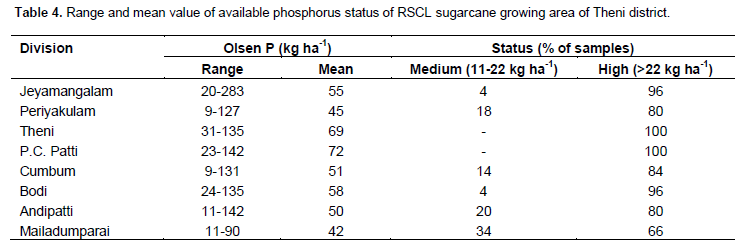
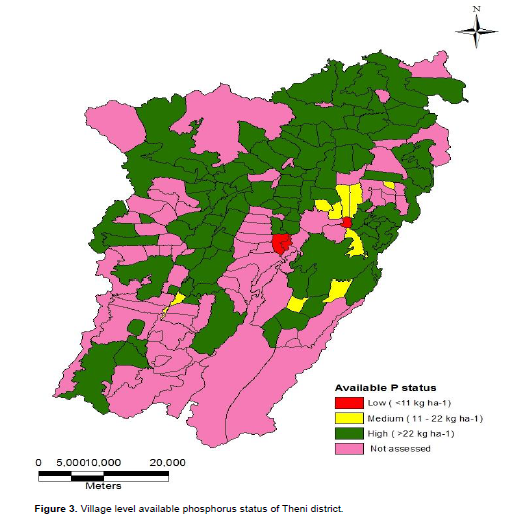
The available phosphorus content of soil samples varied between 9 and 183 kg ha-1 with a mean value of 55 kg ha-1. Among the 400 samples analyzed, about 90 to 95% of the soil samples (3498 ha area) were found to be high in soil available phosphorus status (> 22 kg ha-1) mentioned in Table 4 and Figure 3. The invariably high P status of the soil may be due to continuous application of phosphotic fertilizer (DAP), bio-compost/green plus or rock phosphate enriched compost by the cane farmers of Rajshree sugar mills area as recorded in the farm survey conducted before the preliminary soil sampling study. The application of bio-compost at 3 tonnes ha-1 additionally increased 89 kg P2O5 ha-1 (1.3% P). Further, the injudicious and long term application of fertilizer by the farmers without assessing the soil available P status might have contributed to soil P buildup. The cane growers of this region adopt the regular practice of soil application of 100 kg FeSO4 and 37.5 kg ZnSO4 ha-1 irrespective of the soil Fe and Zn status. However, the available data on DTPA-Zn has indicated Zn deficiency in more than 50% soil samples of the 6 out of the 8 divisions analyzed highly the antagonistic relationship between phosphorus and zinc. Thus, there is an indication of build-up of phosphorus in sugarcane growing areas of Theni district under high intensity irrigated cultivation. Bali et al. (2010) also reported a similar trend in soils of Punjab where, about 45% of the area is high in available P status.
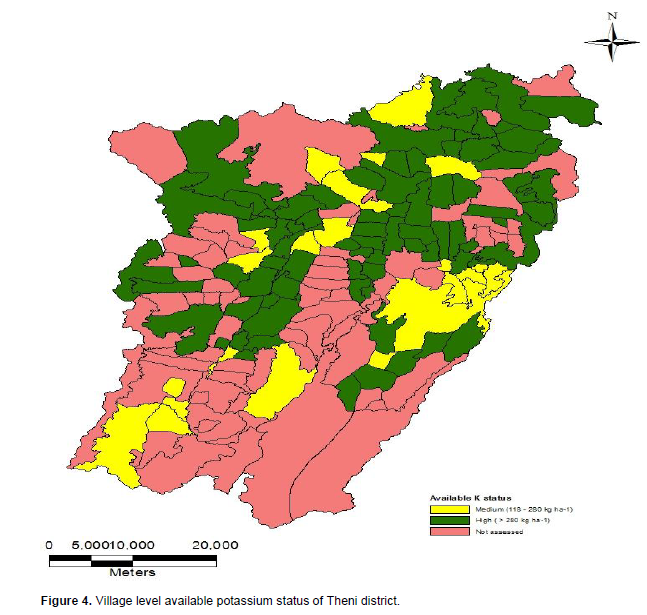
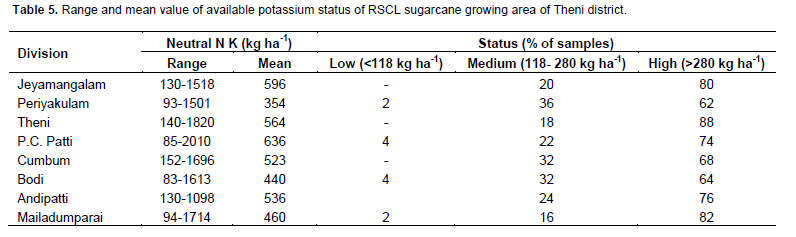
The available potassium content of soil samples ranged from 83 to 2010 kg ha-1 with a mean value of 514 kg ha-1. As shown in Figure 4, about 20 to 35% of the soils from these areas recorded medium status of available potassium. The highest mean value of available K (636 kg ha-1) was recorded in P. C. Patti and the lowest mean value of 203 kg ha-1 was recorded in Andipatti division of Theni district (Table 5). Available potassium had a significant positive correlation with EC (r=0.2976*), OC (r=0.2204*) and available nitrogen (r=0.2491*) which was in alignment with the results reported by Bali et al. (2010). The average available sulphur content in the soil samples varied from 1.02 to 98 ppm with a mean value of 20 ppm. Considering 10 ppm as critical limit for available sulphur, 50% of soils of the sugarcane growing area are found to be adequate in sulphur content. The average calcium carbonate content in the soil samples varied from 1.0 to 47.3 g kg-1 with a mean value of 12.2 g kg-1 in all the divisions. Invariably all the soil samples collected from the 8 divisions of sugarcane growing area recorded CaCO3 of less than 50 g kg-1 (critical limit for free CaCO3) indicating that the soils are free from calcareousness.However, the available rate of calcium carbonate content had a significant and positive correlation with soil pH (r=0.3358**) and a non-significant negative correlation with available iron (r=-0.1505).
Available micronutrients
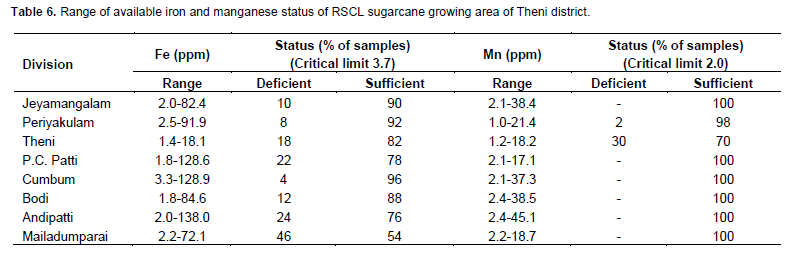
The available iron content of soil samples varied from 1.4 to 129 mg kg-1 with a mean value of 12.99 mg kg-1 and is comparable with those reported by Talukdar et al. (2009) in soils of Assam. The highest mean value was found in Cumbum division (21.28 mg kg-1) and lowest was found in Mailadumparai division (7.51 mg kg-1). About 54 to 96% of samples from five divisions were found to have available iron content above the critical limit (3.7 mg Fe kg-1). However from Mailadumparai, Andipatti and P.C. Patti divisions had 46, 24 and 22% of soil samples were deficient in available Fe. This might be due to precipitation of Fe2+ in higher pH of the sodic soils in these soils and this can be confirmed through the significant and negative correlation of soil pH with available iron (r=-0.5184**) which was also reported by Verma et al. (2007).
As shown in Table 6, the available manganese content of soil samples ranged from 0.98 to 45.10 mg kg-1 with a mean value of 7.76 mg kg-1. The highest and lowest mean values 13.37 and 3.73 mg kg-1 respectively of available Mn content were recorded in Cumbum and Theni division. All the divisions recorded sufficient available Mn content except Theni division, where 30% of the samples were observed to be deficient in DTPA-Mn. The Mn bearing minerals in the parent material of these soils might be the reason for higher Mn content of soils. Negative significant correlations of available Mn with pH (r=-0.4426**) and non-significant correlation with organic carbon (r=0.0506) was also reported. Similar results were also reported in Lachimpur series of Jharkhand (Rakesh et al., 2009) which may be due to the formation of insoluble higher valent oxides of Mn at high pH (Naheed et al., 2010).
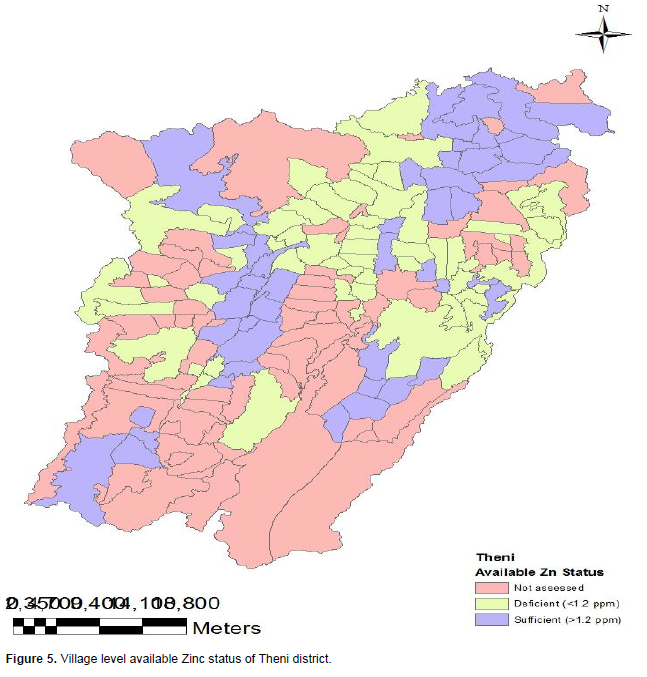
The available zinc content of soil samples ranged from 0.1 to 12.78 mg kg-1 with a mean value of 1.60 mg kg-1. As shown in Figure 5, more than 50% of soil samples were found to be deficient from all divisions except Jeyamangalam, Cumbum and Mailadumparai where, 80, 66 and 56% of samples, respectively were observed to be sufficient in available zinc (1.2 mg kg-1 critical limit) as per Muhr et al. (1965). The higher sufficient content of available zinc might be due to highest content of organic carbon as well as finer fractions of soils leading to increase in the surface ion exchange and hence contributed to the higher amount of DTPA-Zn in those soils (Sharma et al., 2003). This was confirmed when the available zinc content of soil samples showed a significant and positive correlation with organic carbon (r=0.277*) mentioned in Table 7. A significant and negative correlation (r=-0.3050*) (Table 8) with pH indicated the availability of Zn decreases with increase in soil pH.
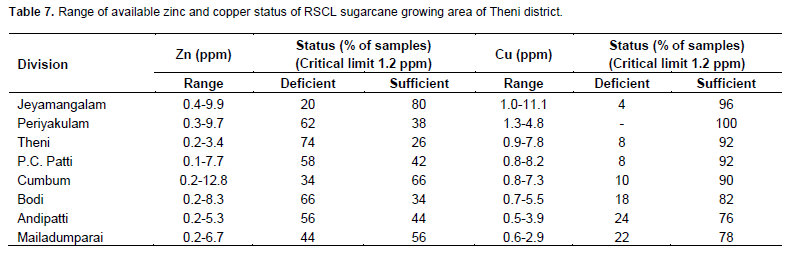
The available copper content of soil samples from all the cane divisions of sugar mill ranged from 0.52 to 11.13 mg kg-1 with a mean value of 2.42 mg kg-1. All the divisions recorded sufficient in status of available copper content. It showed a significant and positive correlation with organic carbon, available nitrogen, phosphorus and potassium, DTPA-Fe and Zn Table 7. The increased availability of Cu2+ may be due to the fact that, DTPA being organic chelating agent extracts micronutrient cations from different pools and the higher amount of organic carbon coupled with low pH values is further likely to increase the solubility of micronutrient cations (Talukdar et al., 2009).
It can be concluded that the soils of the Theni district as assessed in the major blocks are acidic to alkaline in reaction. Invariably all the soil samples collected from the 8 divisions of sugarcane growing area recorded EC of less than 2 dS m-1 indicating that the soils are free from salinity. Low available nitrogen status (< 280 kg ha-1) indicates that nitrogen is the major limiting nutrient in the soils. The soil samples were high in available phosphorus (> 22 kg ha-1) and high in available potassium (>280 kg ha-1) status. More than 50% of the soil samples were deficient in available zinc from all the sugarcane growing divisions except Jeyamangalam. The maps generated under the study will be useful for generating homogenous units and guiding the farmers to decide the amount and kind of macro as well as micronutrients to be applied for optimizing/economic returns based on the site specific nutrient management. The geo-referenced sampling sites can be revisited with the help of GPS, which helps in monitoring the changes in the status of nutrients over a period of time, which otherwise is not possible by traditional methods of sampling.
The authors have not declared any conflict of interest.
We would like to express our sincere thanks to M/s Rajshree Sugars and Chemicals Ltd., for their support and co-operation in conducting soil survey and sampling as the part of research on balanced fertilization model of sugarcane growing area of Theni district, Tamil Nadu.
REFERENCES
|
Bali S, Raj KK, Kuldeep SHS, Bhupinder S (2010). GIS aided mapping of DTPA extractable zinc and soil characteristics in the state of Punjab. J. Indian Soc. Soil Sci. 58(2):189-199. |
|
|
|
Binita NK, Dasog GS, Patil PL (2009). Soil fertility mapping in Ghataprabha left bank canal command area of north Karnataka by geographic information system technique. Karnataka J. Agric. Sci. 22(1):73-76. |
|
|
|
Economics Survey (2013). Department of Economics and Statistics, Government of India, 2013. |
|
|
|
Hesse PR (1971). Soil Chemical Analysis. John Murray Publication Ltd., Londan. |
|
|
|
Jackson ML (1973). Soil Chemical Analysis. Prentice Hall of India Private Limited, New Delhi, pp. 134-182. |
|
|
Lindsay WL, Norvell WA (1978) Development of a DTPA soil test for zinc, iron, manganese and copper. Soil Sci. Soc. Am. J. 42:421-428.
Crossref |
|
|
|
Mahendra S (2010). Soil management in relation to sustainable food production. J. Indian Soc. Soil Sci. 58(supplement):65-72. |
|
|
|
Mani SG, James P, Balaji T, Saravanan A, Nagaendra RT (2006). Balanced fertilization for maximizing the quality of sugarcane Co 86032 in Periyar Vaigai Command area. Indian Sugar 56(12):49-56. |
|
|
|
Muhr GR, Datt NP, Sankarasubramani H, Leley VK, Dunabha RL (1965) Soil testing in India. Second edition, USAID- Mission to India, New Delhi. |
|
|
|
Naheed A, Denich M, Goldbach H (2010). Using GIS approach to map soil fertility in Hyderabad district of Pakistan., In: Proceedings Of 19th World Congress of Soil Science, 1-6 Aug, 2010, Brisbane, Australia. Soil Solutions for a changing World, pp. 280-282. |
|
|
|
Olsen SR, Cole CV, Watanabe FS, Dean L (1954). Estimation of available phosphorus in soils by extraction with sodium bicarbonate. U.S.D.A. Circular, 939. U.S. Govt. Printing Office, Washington DC. |
|
|
Palaniswami C, Gopalasundaram P, Bhaskaran A (2011). Application of GPS and GIS in Sugarcane Agriculture. Sugar Tech. 13(4):360-365.
Crossref |
|
|
|
Rakesh KA, Sarkar K, Singh KP, Agarwal BK, Karmakar S (2009). Appraisal of available nutrients status in Santhal Paraganas Region of Jharkhand. J. Indian Soc. Soil Sci. 57(3):366-369. |
|
|
Rashid A, Ryan J (2004). Micronutrients constraints to crop production in soils with Mediterranean type characteristics: A review. Plant Nutr. 27:959-975.
Crossref |
|
|
|
Sharma RP, Singh AK (2001). Characterization and properties of soil under two dominant land use systems in Western Rajasthan. J. Indian Soc. Soil Sci. 49(3):373-377. |
|
|
|
Sharma RP, Singh M, Sharma JP (2003). Correlation studies on micronutrients vis-à-vis soil properties in some soils of Nagpur district in semi-arid region of Rajasthan. J. Indian Society Soil Sci. 51(4):522-527. |
|
|
|
Singh KN, Raju NS, Subba RA, Rathore A, Srivastava S, Savanta RK, Maji AK (2005). Prescribing optimum doses of nutrients for targeted yield through soil fertility maps in Andhra Pradesh. J. Indian Soc. Agric. Stat. 59(2):131-140. |
|
|
|
Sood A, Sharma PK, Tur NS, Nayyar VK (2009). Micronutrient status and spatial variability in soils of Muktsar district of Punjab- A GIS Approach. J. Indian Society Soil Sci. 57(3):300-306. |
|
|
|
Srivastava TK, Singh AK, Kumari VV (2013). Fertilizer Best Management Practices in sugarcane. Indian J. Fertil. 9(4):96-107. |
|
|
|
Subbiah BV, Asija GL (1956). A rapid procedure for estimation of available nitrogen in soils. Curr. Sci. 25:259-260. |
|
|
|
Talukdar MC, Basumatary A, Dutta SK (2009). Status of DTPA extractable cationic micronutrients in soils under rice and sugarcane ecosystems of Golaghat district in Assam. J. Indian Soc. Soil Sci. 57(3):313-316. |
|
|
|
Verma VK, Setia RK, Sharma PK, Khurana MPS, Kang GS (2007). Pedopheric distribution of micronutrient cations in soils developed on various landforms in North-East Punjab. J. Indian Soc. Soil Sci. 55(4):515-520. |
|
|
Walkley A, Black CA (1934). Estimation of soil organic carbon by the chromic acid titration method. Soil Sci. 37:29-38.
Crossref |
|
|
Watanabe FS, Olsen SR (1965) Test of ascorbic acid method for determining phosphorus in water and sodium bicarbonate extracts of soil. Soil Sci. Soc. Am. J. 29:677-678.
Crossref |
|
|
Williams CH, Steinbergs A (1959). Soil sulphur fractions as chemical indices of available sulphur in some Australian Soils. Austra. J. Agric. Res.10:340-352.
Crossref |
|
|