ABSTRACT
Cowpea, Vigna Unguiculata plays an important role in human diets because of its good protein quality and high nutritional value. On hand are two cowpea lines sourced from a local Zimbabwean humanitarian organization, with an aim to diversify the local germplasm base of cowpea. Activities involved characterizing and evaluating the foreign sourced lines alongside local ones for morphological and random amplified polymorphic DNA-polymerase chain reaction (RAPD-PCR) diversity. Five seed characteristics were evaluated, namely seed size, color, uniformity, presence or absence of seed spots and hilum color using specified scales. For RAPD-PCR analysis, a set of five oligonucleotides was used. DNA extraction, quantification, amplification, electrophoresis and band analysis of presence or absence of bands was carried out. Data was collected and an ANOVA was carried out using genstat discovery software. After an ANOVA, principal components analysis (PCA) and hierarchical cluster analysis were used to examine distribution patterns in the germplasm. Significant differences were observed for the five variables (p˂0.001). Both morphological and molecular data for the cowpea lines show limited diversity from results of multivariate analysis. The dendrogram for morphological data shows an overall similarity index of 78%, whereas for molecular data shows a similarity index of 75%. Of the two foreign lines, the white seeded foreign line, NGO1, seems to be consistently diverse from the rest. It will be a valuable addition to the collection and will be useful for possible introgression in future. The genetic diversity for the collection is generally low and may require continued enrichment with introductions in future.
Key words: Random amplified polymorphic DNA-polymerase chain reaction (RAPD-PCR) characterization, variables, primers, electrophoresis, gel scoring.
Cowpea, Vigna unguiculata is a tropical grain legume which plays an important nutritional role in developing countries of the tropics and subtropics, namely sub-Saharan Africa, Asia, Central and South America (Badiane et al., 2012; Fang et al., 2007; Singh et al., 1997). The African origin of cowpea was suggested as early as 1847 and since then no one is contesting the idea because wild cowpea plants are found only in tropical Africa and Madagascar. However, where the crop was first domesticated is still uncertain (Pasquet, 1999).
The genus Vigna currently includes around 80 species of which unguiculata is one (Ba et al., 2004). The crop is grown for consumption of its young leaves green pods and dry seeds (Zannou et al., 2004). The residues are important as stock feed (Sharawy and El-Fiky, 2002). Cowpea is often termed the “poor man’s meat” because the seed protein contents range from 23 to 32% of seed weight and are rich in lysine and tryptophan, and a substantial amount of mineral and vitamins, folic acid and vitamin B (Huaqiang et al., 2012). Cowpea is reported as having superior nutritional qualities to dry beans (Phaseolus vulgaris L.) (Spiaggia et al., 2008). The Food and Agriculture Organization, 2009, acknowledges that of the twelve and a half metric tons of cowpea produced globally, more than sixty four percent are from resource-poor, subsistent production. Cowpea is reported as the most cultivated and the most consumed among grain legumes especially in Asia and in tropical Africa (Diouf, 2011).
Cowpea can grow under low fertility conditions due to its ability to fix nitrogen and withstand the low pH (Prasanthi et al., 2012). The plant is generally drought tolerant and is effectively used in rotation with cereals for soil fertility restoration. However, the yields produced which average 1 ton/ha in sub-Saharan regions, fail to meet the needs of consumers (FAO, 2009). In drought prone areas like Southern Africa, in particular Zimbabwe, cowpea usually survives dry spells and is one of the few crop species that may escape moisture stress due to its short life span (Nhamo et al., 2003). Its importance as a rescue species during humanitarian crisis cannot be overemphasized as the grain is often donated to human communities struggling for nutrition.
However, the genetic diversity in the species is reportedly narrow, in spite of substantial variation in seed color, seed proteins, plant type, pod type and seed size among cultivated cowpeas (Sharawy and El-Fiky, 2002). Morphological characterization is the first step in the description and classification of germplasm collections (Sarutayophat et al., 2007).
Information regarding genetic diversity is a key component for the development of novel and desirable traits (Kholghi et al., 2011). Molecular characterization is also increasingly becoming an important source of genetic information. Molecular markers have been observed to detect more genetic diversity than morphological and protein-based markers in cowpea as they can identify functional as well as neutral genetic variation (Zannou et al., 2008). Sometimes morphological attributes do not necessarily reflect real genetic relationships as the environment has significant effect on morphological traits.
Estimating genetic diversity and determining the relationships among germplasm collections enhances efficient germplasm, management and genetic improvement (Iqbal et al., 2014). The study was carried out as a preliminary evaluation of two NGO lines meant for drought relief, although some farmers in Zimbabwe now seem interested in them alongside local landraces. This may be important to enrich the genetic base of cowpea which is important because germplasm with wider genetic base provides buffer and resilience against climatic and other environmental changes and ensures sustainable food security (Adewale et al., 2011). It is hoped they can be adopted in the national breeding program for a more widespread evaluation and eventual distribution.
Germplasm
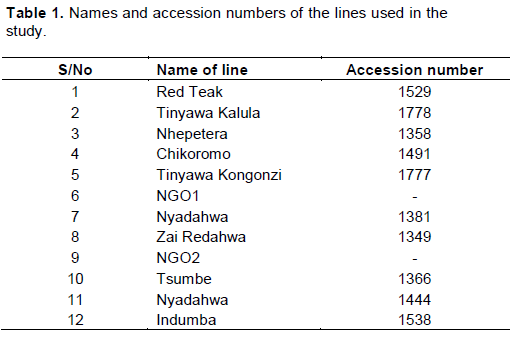
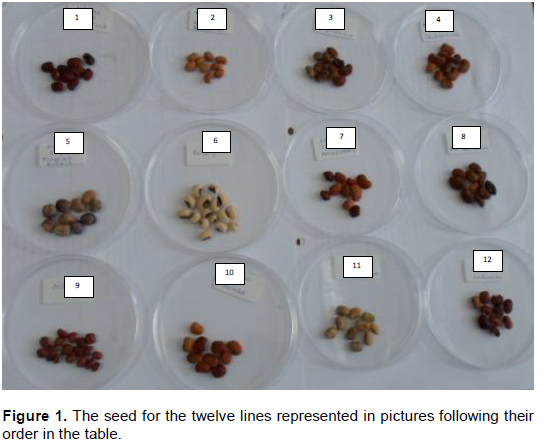
Twelve lines of cowpea Vigna Anguiculata were used for morphological characterisation and Random amplified polymorphic DNA-polymerase chain reaction (RAPD-PCR) analysis. Two of the lines were obtained from a local Zimbabwean humanitarian organisation working in Mashonaland Central. These lines were named NGO 1 and NGO 2 in the study. They were meant for drought relief but however farmers now seem keen to perpetuate them along local landraces. Ten other lines were obtained from the national gene bank, six Zimbabwean landraces, Nhepetera, Chikoromo, Nyadahwa 1381, Zai Redahwa, Tsumbe and Nyadahwa 1444 and an additional four foreign lines also kept at the gene bank namely Red Teak, Tinyawa Kalula, Tinyawa Kongonzi and Indumba. For RAPD-PCR analysis, common bean was used as control. A complete list of the lines is shown in Table 1. A picture of seed taken for each accession in the same order as in the table from left to right is shown in Figure 1.
The experiment was carried out in the Biosciences Department, Bindura University of Science Education, Bindura, Zimbabwe. Seed characteristics were scored after which RAPD-PCR characterization was carried out in the laboratory at African institute of Biomedical Research.
Morphological characterisation
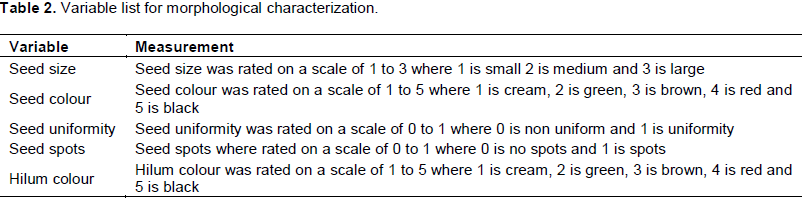
The lines show diversity in terms of seed characteristics e.g. colour, shape, size etc. Five seed variables namely seed size, seed colour, seed uniformity, hilum colour, presence and absence of seed spots were evaluated using scales specified in Table 2. Five seeds were scored for each entry in order to carry out ANOVA and also calculate means.
Genstat Discovery Version 4.0 software was used to analyse all the measured traits. The same software was used to carry out the hierarchical cluster analysis and also to establish the level of relatedness among the lines with respect to seed characteristics.
RAPD-PCR characterisation
The following stages were followed towards RAPD-PCR analysis, DNA extraction, quantification, PCR optimization, amplification, electrophoresis and band analysis. For extraction, the cetyl trimethylammonium bromide (CTAB) protocol was used for the extraction of DNA from the plant tissues (Harisha, 2007; Hoelzel, 1998).
DNA extraction
Fresh leaf tissue was obtained separately from the seedlings of the twelve cowpea lines. They were placed in a mortar, liquid N2 added to lyophilize the plant tissue before grinding to a fine powder with a pestle. Two milligram of the fine powder was weighed and put into 2 ml Eppendorf tubes. One milliliter of CTAB buffer previously heated at 65°C for approximately 20 min was added. The contents were mixed gently and incubated in the water bath for 2 h at 65°C. The tubes were removed from the water bath cooled down for five minutes at room temperature five hundred microlitres of chloroform/iso-amyl alcohol (24:1) were added. It was then mixed by gentle inversion or rocking approximately 100 times. The mixture was spinned in a table-top centrifuge for 10 min at 3600 round per minute (rpm). Six hundred microlitres of clear liquid was pipetted and incubated at room temperature for 15 min after which 400 ul of ice cold isopropanol was added.
The mixture was mixed by gentle inversion for 15 min till a precipitation was formed and then spinned in a centrifuge at 12 000 rpm for 10 min. The isopropanol was decanted carefully and 1 ml of 70% ethanol added, then mixed by inversion. The mixture was centrifuged at 12000 rpm for 10 min. The supernatant was poured off carefully by inverting the tube to obtain the pellet of DNA. The pellet was dried by leaving the tubes open in the laminar air flow. Hundred microliters of TE buffer of pH 8.0 was added and rocked gently overnight in the cold room to dissolve the DNA.
DNA quantification and quality check
DNA quantification was carried out using the UV spectrophotometer. For each sample, 5 ul of the DNA were pipetted and mixed with 995 ul of TE buffer in 1 ml quartz microcuvette. The mixture was read at 260 nm against a TE-buffer blank. The actual quantity of the DNA was calculated by converting the optical density (OD) readings to ug/ml (a reading of 1.0 at OD260 is equivalent to 50ug of DNA/ml) (Weising et al., 1995). The conversion also took into account the dilution factor. Finally all the quantified samples were aliquoted into dilutions of 4 ng/ul as required by the PCR conditions used.
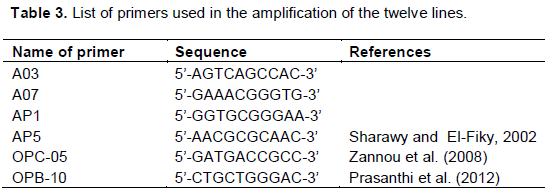
The Random Amplified Polymorphic DNA analysis was carried out using primers that have been successfully used in cowpea by other researchers in various studies predominantly molecular characterisation studies (Sharawy and El-Fiky, 2002; Zannou et al., 2008; Prasanthi et al., 2012). A gel run of the twelve lines plus a common bean control was carried out to determine the success of the extraction process.
List of primers
The list of primers in Table 3 were tried for use in the study. The primers were sourced from University of Cape Town South Africa.
The RAPD-PCR procedure
The primers were used for both amplification and detection of polymorphisms among the cowpea lines. Temperature cycling was carried out on the Gene Amp 2400 thermocycler. A number of reaction contents and protocols were tried by performing permutations between 3 sets of different reaction contents against 3 sets of different reaction conditions (Nienhuis et al., 1995). Each set of reaction was performed in 10 ul volumes containing, 1X RAPD buffer, 1.1 mM deoxynucleotide triphosphates (dNTPs), 4 mM primer, 1.25 units Taq DNA polymerase and 20 ng of genomic DNA. The only differences among the 3 sets were on the magnesium concentrations.
Amplification was performed in 0.2 ml tubes using a thermocycler (Eppendorf, Germany) programmed for initial denaturation at 94°C for 3 min followed by 45 cycles of denaturation at 94°C for 1 min at 35°C for 1 min and 72°C for 2 min. The amplification was completed at 72°C for 7 min and holding temperature of 4°C (Zannou et al., 2008).
RAPD-PCR products were separated run on a 1.5% agarose gel (Weising et al., 1995). The molten gel was stained with a 10 mg/ml ethidium bromide stock to a final concentration of 0.5 ug/ml before it had set (Henry, 1997). To each well, 10 ml of the sample in 1X loading dye, were loaded. The samples were electrophoresed in 0.5X TBE buffer at 80 V (1-5 V/cm) for 2 h.
Morphological characterization
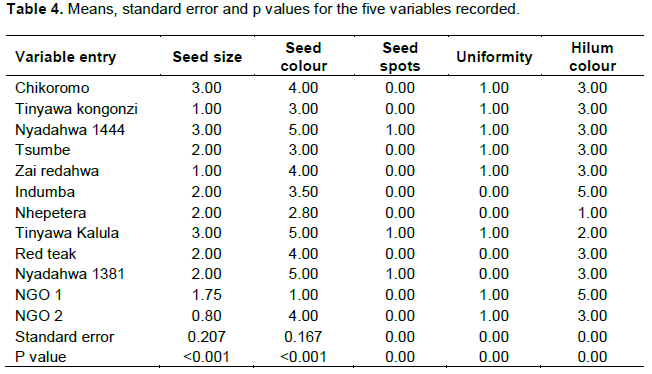
The lines show diversity in terms of various seed characteristics that were scored namely seed colour, hilum colour, seed size, presence and absence of seed spots and seed uniformity. ANOVA results were generated using two-way analysis of variance (ANOVA) using Genstat Discovery Edition 4 software. The lines showed significant differences with respect to all of the variables namely seed size, seed spots, seed uniformity, hilum colour and seed colour, with p<0.001. Table 4 shows the means, standard error and the p values.
The means for the 12 lines are presented in Table 4 for the purposes of multivariate analysis. Principal component analysis (PCA) and hierarchical cluster analysis were used for the construction of a scatter plot and a dendrogram respectively.
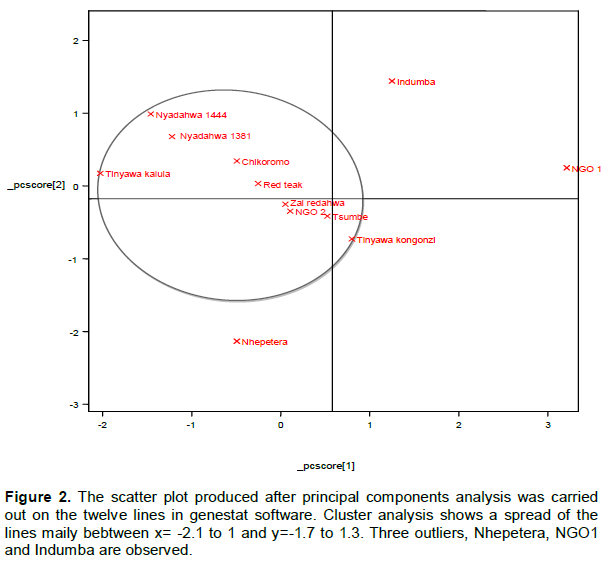
Principal components analysis
PCA first converted the five variables to two vectors which can be plotted on a 2 dimensional scatter plot (Figure 2). The scatter plot produced after principal components analysis showed that most of the lines are clustered together in a large group, x-coordinates -2 to 1 and y coordinates -1.7 to 1.2 on the two dimentional plane. This group which is on the left hand plane includes entries, Nyadahwa 1444, Nyadahwa 1381, Tinyawa Kalula, Chikoromo, Red Teak, Zai Redahwa, NGO2, Tsumbe, Tinyawa Kongonzi and NGO2 with three outliers, Indumba, NGO1 and Nhepetera. This is an indication of similarity or uniformity within the group and the outliers may be significantly diverse from the rest.
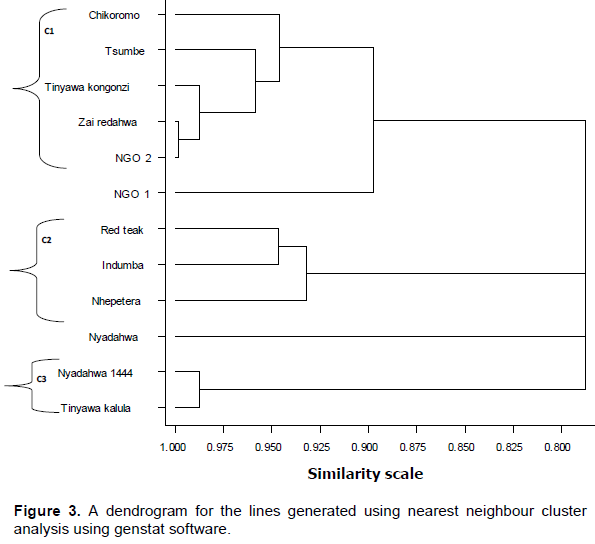
Cluster analysis
After hierarchical cluster analysis a dendrogram was constructed and presented in Figure 3. On a similarity scale of 0 to 1, total similarity index for the collection is 0.78. Zai redahwa and NGO2 are the most similar whereas Nyadahwa is the most dissimilar from the rest. Three main clusters are observed labelled C1, containing lines, Chikoromo, Tsumbe, Tinyawa Kongonzi, Zai redahwa and NGO2, C2 containing lines, Red Teak, indumba and Nhepetera and C3 containing lines, Nyadahwa 1444 and tinyawa Kalula. Each cluster has lines which are most related amongst themselves. Nyadahwa and NGO1 do not belong to any particular clusters.
Molecular characterisation
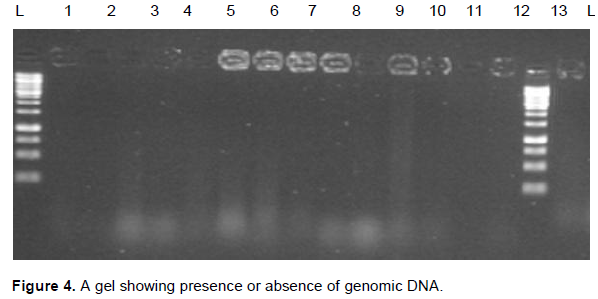
When the DNA samples were run on the gel to ascertain
success of the extraction process, the following gel picture was captured (Figure 4). The DNA shows very faint bands showing some presence of the genetic material.
PCR analysis results
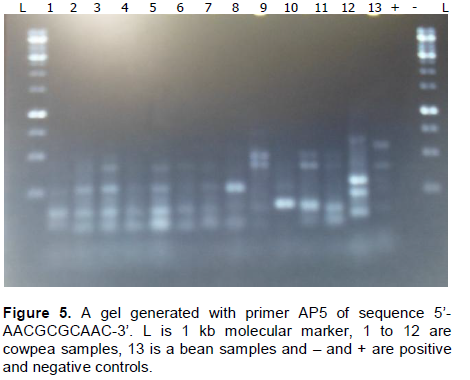
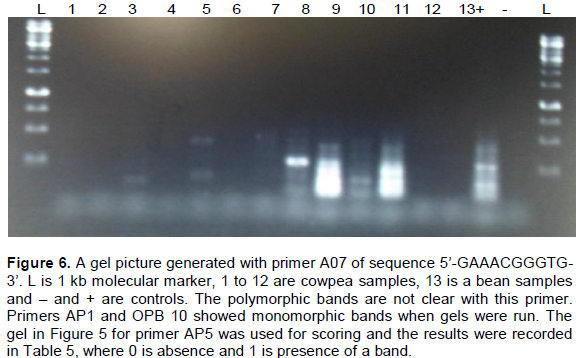
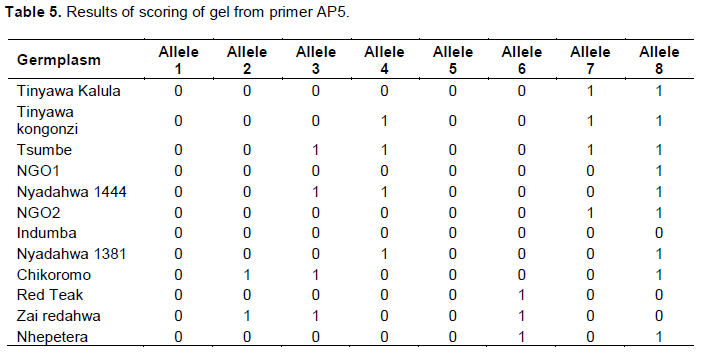
The banding patterns for primers AP5 and A07 are shown in Figures 5 and 6 respectively. Figure 5 shows DNA polymorphisms detected in the 12 accessions screened using primer AP5. While primer A07 was unable to clearly distinguish these accessions (Figure 6). Primer AP5 managed to detect polymorphic bands showing important variations among these accessions.
Principal components analysis
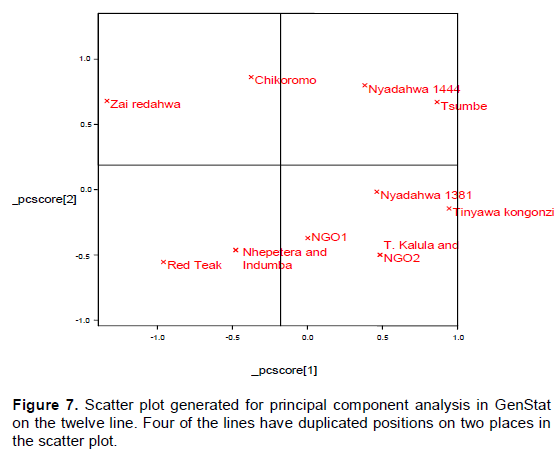
PCA converts the 8 alleles into two vectors which were again plotted on a 2 dimensional scatter plot. The scatter plot produced after principal components analysis showed the lines are distributed all over the plane some above y=0 and the other group below y=0. Figure 7 shows the scatter plot produced after principal component analysis was carried out.
The distribution is highly clustered together when the coordinates are examined which have small intervals although visually they seem widely distributed.
Cluster analysis
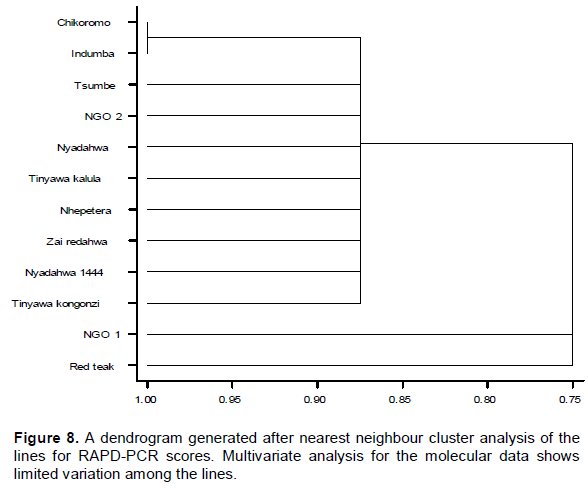
The dendrogram for RAPD-PCR data shows an overall similarity index of 75% or dissimilarity of 25%. It presents one main cluster containing eight lines (Tsumbe, NGO2, Nyadahwa, Tinyawa Kalula, Nhepetera, Zai Redahwa, Nyadahwa and Tinyawa Kongonzi. Red Teak and NGO 1 are the most dissimilar from the rest while Chikoromo and Indumba are the most similar (Figure 8).
The distribution pattern for morphological data are observed as different. Despite efforts to enrich a sample of cowpea lines from the gene bank, the genetic diversity is consistently low. It is comparable to literature reports that say genetic diversity in cowpea is generally low in spite of substantial variation seed color, seed proteins, plant type, pod type and seed size among cultivated cowpeas (Sharawy and El-Fiky, 2002). According to Huaqiang et al. (2012) the genetic diversity among cowpea cultivars they studied ranged from 0.1742 to 0.4054 on a scale of 0 to 1. Malviya et al. (2012) reported genetic diversity levels ranging 0.2 to 0.4 on diversity analysis of ten Indian cultivars.
Both morphological and molecular data for the cowpea lines show limited diversity after multivariate analysis was carried out. The germplasm collection may require continuous enrichment. The white seeded line NGO1, consistently seem to be diverse from the multivariate analysis carried out. It will certainly be a valuable addition and will be useful for possible introgression in future.
There are no conflicts of interests regarding this publication.
This work was partially funded by the Postgraduate Research Center, Bindura University of Science Education - the purchase of primers and laboratory fees at African Institute of Biomedical Research (AiBST). The National Gene Bank of Zimbabwe was the source of some of the germplasm used in the study. Laboratory technical support from AiBST staff is also greatly appreciated.
REFERENCES
|
Adewale BD, Adeigbe OO Aremu CO (2011). Genetic distance and Diversity among some Cowpea (Vigna unguiculata L. Walp) genotypes. Int. J. Res. Plant Sci. 1(2):9-14.
View
|
|
|
Ba FS, Pasquet RS and Gepts P (2004). Genet. Resourc. Crop Evol. 51(5):539-550.
Crossref |
|
|
Badiane FA, Gowda BS, Cissé N, Diouf D, Sadio O and Timko MP (2012). Genetic relationship of cowpea (Vigna unguiculata) varieties from Senegal based on SSR markers. Genet. Mol. Res. 11(1):292-304
Crossref |
|
|
|
Diouf D (2011). Recent advances in cowpea [Vigna unguiculata (L.) Walp.] research for genetic improvement. Afr. J. Biotechnol. 10(15):2803-2810. |
|
|
Fang J, Roberts PA, Ehlers JD, Chih-Cheng T (2007). Genetic diversity of cowpea [Vigna unguiculata (L.) Walp.] in four West African and USA breeding programs as determined by AFLP analysis. Genet. Resourc. Crop Evol. 54(6):1197-1209
Crossref |
|
|
|
Harisha S (2007). Biotechnology Procedures And Experiments Handbook. Biotechnology Laboratory Manuals. ISBN-13: 978-1-934015-11-7. I. |
|
|
|
Henry RJ (1997). Practical application of plant molecular biology. Chapman and Hall. London. pp 3-6, 8-13 |
|
|
|
Hoelzel AR (1998). Molecular genetic analysis of populations; a practical approach. |
|
|
|
Huaqiang T, Manman T, Qian L, Yongpeng Z, Jia L and Huanxiu L (2012). A review of molecular makers applied in Cowpea (Vigna unguiculata L. Walp.). J. Life Sci. 6:1190-1199 |
|
|
|
Iqbal A, Khan M, Khan A, Nausheen I, Nisar M (2014). Estimation of genetic diversity in commercial Trifolium repens reported from Pakistan using Biochemical Makers (SDS-PAGE). Int. J. Adv. Res. 2(4):873-877.
View
|
|
|
|
Kholghi M, Bernousi I, Darvishzadeh R, Pirzad A, Maleki HH (2011). Collection, evaluation and classiï¬cation of Iranian confectionary sunflower (Helianthus annuus L.) populations using multivaraite statistical techniques. Afr. J. Biotechnol. 10 (28):5444-5451. |
|
|
Malviya N, Sarangi B, Yadav M, Yadav D (2012). Analysis of genetic diversity in cowpea (Vigna unguiculata) cultivars with random amplified polymorphic DNA markers. Plant Syst. Evol. 298(2):523.
Crossref |
|
|
|
Nienhuis J, Tivang J, Skroch P, Dos Santos JB (1995). Genetic relationships among cultivars and landraces of lima bean (Phaseolus lunatus) as measured by RAPD markers. J. Am. Soc. Horticult. Sci. 120:300-306. |
|
|
|
Nhamo N, Mupangwa W, Siziba S, Gatsi T, Chikazunga D (2003). The role of Cowpea (Vigna unguiculata) among other grain legumes in the management of soil fertility in the smallholder-farming sector of Zimbabwe. |
|
|
Pasquet RS (1999). Genetic relationships among subspecies of Vigna unguiculata (L.) Walp. based on allozyme variation. Theor. Appl. Gen. 98:1104-1119.
Crossref |
|
|
|
Prasanthi L, Geetha B, Ramya BN, Jyothi and Raja Reddy K (2012). Evaluation of genetic diversity in cowpea, Vigna unguiculata (L.) gentotypes using Random Amplified Polymorphic DNA (RAPD). Curr. Biot. 6(1):22-31. |
|
|
|
Sarutayophat T, Nualsri C, Santipracha Q, Saereeprasert V (2007). Characterization and genetic relatedness among 37 yardlong bean and cowpea accessions based on morphological characters and RAPD analysis. J. Sci. Technol. 29.3:591-600. |
|
|
|
Sharawy WM, El-Fiky ZA (2002). Characterization of cowpea (Vigna unguiculata L.) genotypes based on yield traits and RAPD-PCR analyses. Arab J. Biotechnol. 6(1):67–78. |
|
|
|
Singh BB, MohanRaj DR, Dashiell KE, Jackai L (1997). Advances in cowpea research. IITA-JIRCAS, Ibadan, Nigeria. P. 215. |
|
|
|
Spiaggia F, Reginaldo C, Benko-Iseppon AM (2008). Preliminary Molecular Characterization of cowpea (Vigna unguiculata (L.) Walp.) Accessions by DNA Amplification Fingerprinting (DAF). Dept. Genetics, Universidade Federal de Pernambuco, CCB. 50732-970. |
|
|
|
The Food and Agriculture organisation (2009). Quarterly Bulletin of Statistics. Food and Agricultural Organization of United Nations, Rome. |
|
|
|
Weising K, Nybon H, Wolff K, Meyer W (1995). DNA Fingerprinting in plants and fungi. CRC Press. London. pp 3-4, 8-10, 27-36, 77, 130-154. |
|
|
|
Zannou A, Kossou DK, Ahanchédé A, Zoundjihékpon J, Agbicodo E, Struik PC and Sanni A (2008). Genetic variability of cultivated cowpea in Benin assessed by random amplified polymorphic DNA. Afr.J. Biotechnol. 7(24):4407-441. |