ABSTRACT
This study examines the quantitative effects of market price in cotton producing areas of China. It also analyzes the qualitative effects of price regulation on cotton production. Secondary time series data were collected from National Bureau of Statistics in China, between 1990 and 2013. Calculation of the growth rate of cotton in production was done using linear trend model and multi-regression model to analyze the correlations between production, area and market price. The results of regression between the dependent variable (cotton production) and independent variables such as the previous year’s area, current year’s area and the previous year’s market price showed that the R-Square and adjusted R-Square values are 0.89 and 0.87, respectively, and the t-statistics of all independent variables rejected null hypothesis of no correlation at the 1% significant level. This infers that the market price and cultivating area of cotton crop has a highly significant relationship with the production. What’s more, the coefficients of current year’s area and previous year’s market price are higher than 0, denoting a positive impact on production. However, coefficient of previous year’s area is smaller than 0, implicating a negative influence on cotton production. In addition, the value of dry weight calculated is 1.94, which means no series auto-correlation exists. Despite this, it can be concluded from the regression results is that cultivating area and market price have time lag impacts on cotton production. Furthermore, price regulation has indirect positive impacts on cotton production.
Key words: Cotton productivity, growth rate model, multi-regression.
Cotton is one of the most important non-food cash crops and it is an important source of foreign currencies earning in China. Four major countries like China, India, USA and Pakistan produce cotton; however, China ranks 1st among these four countries (Wang et al., 2009). Twenty four provinces out of thirty one provinces produce cotton in China; about 300 million Chinese are involved directly or indirectly in cotton production activities (National Bureau of Statistics in China, 2008). From 1978 to 1984, cotton production of China increased steadily and reached a significant level of 6.26 million metric tons in 1984 (UNEP, 2002). Later the production increased from 4.1 to 5.7 million tons. However, it decreased to 3.8 million tons in 1999. Cotton production value accountedfor 13% in the added value of the economy and contributed to the agricultural gross domestic product by 0.6% (Stat, 2015). In china, the area used for cotton plantation is about 4,219 thousand hectares, with a production of about 616.0 million tons of cotton in 2014. Cotton consumption in China was expected to remain stable at a level of around 8 million tons, which accounts for one third of the global consumption. In 2015, the cotton consumption in China surpassed that of neighboring countries like India and Pakistan (ICAC, 2015). In addition, cotton provides raw material for textile industries, which is the biggest sector in China and which also offers employment for about 10 million people (China National Garment Association, 2014; Fashion United, 2013). Therefore, China has positively followed the trend of technology advancement and upgraded its textile industries (Studwell, 2013). The rise in China’s exports over the past 10 years has contributed to some of the complexities in its import (Wang and Wei, 2008; Amiti and Fruend, 2010).
China has three major cotton growing areas (Yang and Cui, 2010), which are Xinjiang, Yangtze River Basin (Which includes Jiangsu and Hubei province) and Huang-He districts (which includes Hubei, Henan, and Shandong). Cotton is, also a labor intensive crop which provides work opportunities for rural people, especially for women (picking) (Lokhande, 1995). Cotton is cultivated in almost every country of the world. The major producers, consumers and exporters are China, USA, the previous Soviet Union, India, and Pakistan. It accounts for more than 20% of world production and nearly 20% of world consumption. The development of China has had a significant impact on cotton market of the world. In 1997, China imported 783 thousand metric tons of cotton which was 13.6% of the total world import, but since 1999, China has become a net-exporter at a trading level of 330 thousand tons (UNEP, 2002). Before 1993, cotton domestic price in China was very low, around 32.91 US cents/pound. Thus, the Chinese government increased the cotton purchasing price to 47% in 1994. Again in 1995, Chinese government increased the purchasing price of cotton by 29%, which instigated a massive increase in domestic cotton price, then the purchasing cotton price in domestic market went upto 76.79 US cents/pound. In 1999, Chinese government decided to make cotton price free. Subsequently, the domestic cotton price dropped to 42.02 US cents/pound, while in 2000 the price went from 54.72 to 63.47 US cents/pound (UNEP, 2002).
The overview of Chinese cotton policies
As cotton is an important economic crop in China, the production and price of cotton have significant effects on the agricultural development of the country. This has made the Chinese government implement many policies to keep the cotton industry stable. From 1949 to 1954, the Chinese government has implemented free marketing policy and the official has also used many methods such as cotton cooperation and order advancement to make the cotton industry stable. From 1954 to 1985, the Chinese government implemented the cotton reserving plan bill. During this period only the government can purchase or sell cotton, and private cotton business was illegal. Later from 1985 to 1999, in order to keep up with the change of agriculture industry structure and develop the commodity economy in agriculture, Chinese government changed unified purchase and sale policy into contracts transaction. After 1999, China has started the market reform with the development. China’s cotton policy transited in market-oriented systems. However, in 2010, the price of cotton rose sharply in the world and domestic market. In order to stabilize the price in domestic market, in March 2011, the Chinese government enacted price regulation policy of cotton to protect the farmers’ cotton cultivation profits and consequently achieve the target of cotton production. The target price as the form of price regulation lasted for 3 years, from 2011 to 2013. In 2011, target price was 19,800 yuan/ton and in 2012 and 2013, it was 20,400 yuan/ton. China also adopted price distinguished policies for staple food grains, such as rice, wheat and corn. The policy aimed at rice and wheat was described as a minimum procurement price policy, and a policy of complete or virtual self-sufficiency in which these grains can be predictable for the foreseeable future (Zhu, 2011; Gale, 2013). When the price of cotton floated dramatically, the government would carry out price regulation policy.
For example, when the market price declined to a large extent, the government will purchase the cotton from farmers at the target price. Currently, the target price policy is merely implemented in Xinjiang, which serves as a policy testing area. In 2014, China`s policy makers gradually started to diminish the market value of cotton, which was vended from intervention stockpiles. Because of the high degree of price uncertainty shaped through the scope of China`s stock. The gradually reducing prices due to the standard of China`s stock made itself the main significant factor for policy changes including going back to the price support and offering a lower level of support policy for cotton. However the sales from stock was diverse in different ways. During 2009-2010, stock auctions were assumed as target price increases, nonetheless during 2012-2013 the planning of stock sales was combined with efforts to support price. Stock product was offered for sale with the value of 5-10 percent lower than the price of the product purchased, although the edge price was 60% lower than the purchased price. By the acknowledged price floor, the auctions aimed at cotton reserve were open to public mechanisms of current discussions between textile industry and government. The government restrictions on cotton imports, which increased the price of stock cotton and permitted the government to connect the delivery of import quota to purchases at the stock sales, is an essential module of the planning of reserve auctions prices. During 2012-2013 the sum of stock auctions was greater than 6.5 million tons, nevertheless not sufficient to stop the reserve from increasing to an unparalleled level.
During the period of 2011-2013, China`s interference with purchasing cotton at the support price level was extended from previous practices, but such interventions was not fully preoccupied beforehand. The disruption from 2012 to 13 was that the stockpile of China`s cotton planning was converted to piece support organization, with reserve consciously increasing to unparalleled scope and flattering the possible source of world market unpredictability rather than gadget of price predictability. In 2014, Chinese government lowered the auction price for interference reserve, gesturing to decline the price support (Mcdoland 2015). Following are the researchers working on cotton price related topics in China. Du and Min (2010) carried out research on Investigation and Analysis on Production and Market Behavior of Cotton Growers in China; Gale & Fared(2013) performed a topic on Growth and Evolution in China’s Agricultural Support Policies; FAO(2013) implemented a research about The United Nations and International Cotton Advisory Committee; Hua Liu(2013) expressed his insight on Thoughts of the Implementation of Macro Regulatory Policy for Cotton and CNCRC’s Development Strategy; Ge et al(2010) did some research on Cotton market integration and the impact of China’s new exchange rate regime; Huang et al (2013) shared his investigation on The subsidization of farming households in China’s agriculture; Cater et al(2012) made explorations on Advances in Chinese Agriculture and its Global Implications; ITMF(2014) conducted Cotton Contamination Surveys in 2003, 2005, 2007, 2009, 2011, 2013 & 2014.The allocation of the rest parts is as follows: Section 2 outlines the methodologies of the study; Section 3 displays the empirical results and discussion; Section 4 analyses the effects of price regulation on cotton production; Section 5 lists out the conclusion.
The study covers a period of 24 years from 1990 to 2013. Data were collected from various government publications from the National Bureau of Statistics in China. All variables for multi- regression analysis are in natural logarithms.
Growth rate model
Data of time series of cotton production, area and yield were analyzed to estimate their growth rate by subsequence of growth model (Koondhar et al., 2016; Magsi 2012), which is as follows:

where gx= geometric average growth rate, X0 = initial value of variable X, XT = final value of variable X, 0 = base year, and T = final year.
Multi-regression model
Test of assumptions is an important task which a researcher utilizes in a multi-regression model. Serious assumption violations can result from biased estimates of relationships, over or under-confident estimates of the precision of regression coefficients (that is, biased standard errors), and untrustworthy confidence intervals and significance tests (Chatterjee and Hadi, 2012; Cohen et al., 2003). To figure out the relations between cotton production, market price and cultivating area, multi-regression model was used as the method of analyses. The following are the different equation design hypothesis based on general economic regularities:
Equation hypothesis 1: LnYt = α0 + β1lnAt+ β2lnPt +â„° (1)
where Yt = current year’s cotton production, α0 = intercept, At= current year’s cultivating area, β1 = coefficient of current year’s cultivating area, which is expected to be above 0, Pt = current year’s market price, β2 = coefficient of current year’s market price, which is expected to be above 0, and â„° = error term.
Equation hypothesis 2: LnPt = C1+ β1lnPt-1+ â„° (2)
where Pt= current year’s market price, C1= intercept, β1 = coefficient of previous year’s market price, which is expected to be below 0, Pt-1= previous year’s market price, and â„° = error term.
Equation hypothesis 3: LnYt = C3+ β1lnAt+ β2lnAt-1+ β3lnPt-1+ â„° (3)
where Yt = current year’s production, C3 = intercept, β1 = coefficient of current year’s area which is expected to be above 0, At= current year’s cultivating area, β 2 = coefficient of previous year’s cultivating area which is expected to be below 0, At-1=previous year’s cultivating area, β3 = coefficient of previous year’s market price which is expected to be above 0, Pt-1= previous year’s market price, and â„° = error term. These equations were estimated using ordinary least square method.
EMPIRICAL RESULTS AND DISCUSSION
Figure1 represents the trend of cotton cultivation in China, which is fluctuate upward and downward from the period of 2006-2013 may due to water shortage, climate changes, pest and insect attack, rainfall and may also fluctuation of the cotton market price. Subsequently the interception data of cotton production in 2007 wasrecorded 762.4 million tons, but the largest cotton cultivated area was recorded 6,835, thousand hectares in 1992 and the highest yield was estimated 1458 kg/ha in 2012. When it comes to 2010, the relationship of cotton area and production is more worrying due to the sharp price change in domestic cotton market and some technical reasons. From 2007to2013, the yield of cotton was stable, but the cotton production decreased due to cotton cultivated area. Table 1 indicates the average growth rate of area, production and yield of cotton in China. From 1990 to 1995, the average growth rate was 9.4% in area, 0.4% in production and 2.5% in yield respectively. Nevertheless, from 1996 to 2000, it was recorded 1.1% growth in area, 5.7%in production and 4.6% in yield. The average growth rate of production increased 5.3%, yield 2.1% but growth of area was much lower in 1996-2000 compared with period of 1990-1995. Again, the growth rate of area rose to 3.3% from2001to2007.In this period, production increased 0.4% and the yield decreased1.6% compared with the period of 1996-2000.And from the period 2008-2013,the average growth rate of cotton cultivated area was -4.9%, production -2.8% and yield 2.7%. In the period 2008-2013, the average growth rate of cotton cultivated area and production is much lower than the period 1990-1995, which is due to some technical issues during cultivation and the price decrease of cotton in domestic market.
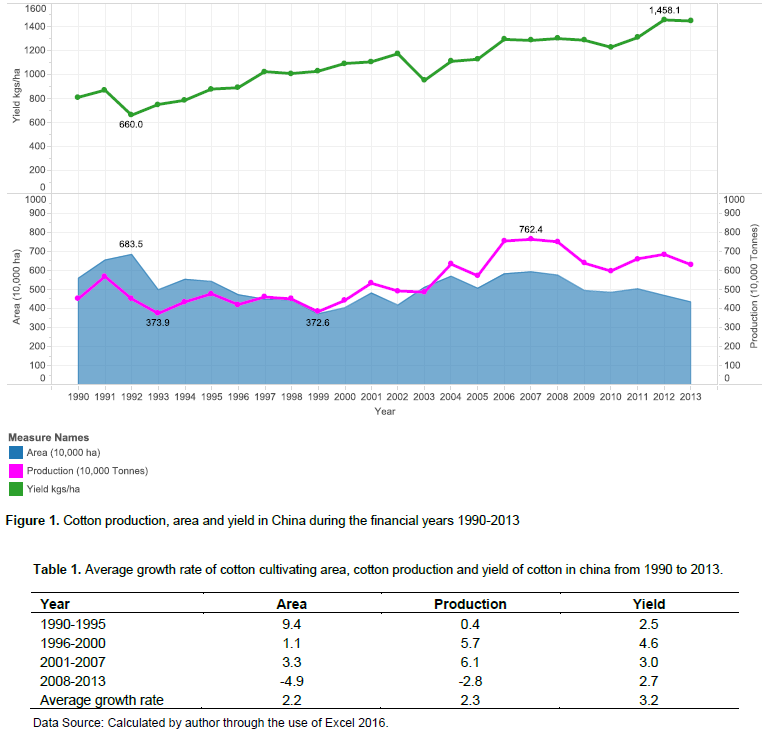
According to the history data of cotton in China during 1990-2013, the total average growth rate of area is 2.2%, production w 2.3% and yield 3.2%. Table 2 shows the significant relationship between current year`s market price and previous year`s market price. The value of R2 and adjust R2 are 0.87 and 0.86 respectively, which means previous year`s market price has highly linear tendency with current year`s market price of cotton. Therefore, the result of D.W value has positive relationship which is 2.07 means independent variables does not have auto-correlation. Furthermore the variable of previous year`s market price reaches 1% significant level, and it`s coefficient is 0.926, which represents it has strongly positive linear relationship with current year`s market price. Besides it means if the previous year`s market price increase 1%, the current year market price will proportionately increase 0.926%. The positive coefficient of previous year’s market price obviously goes against the equation hypothesis 2. According to hypothesis of rational economic body, if the previous year’s price is relatively high, then the farmers will be apt to cultivate more cotton, ultimately resulting in higher supply than demand, which will subsequently leads to price decline. As there is time lag in the reaction of market mechanism, therefore, rise in the previous year’s price will decrease the price in the current year.
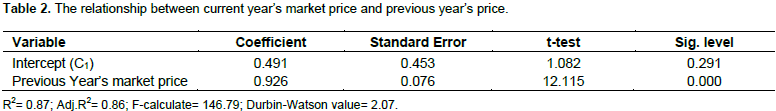
Table 3 shows that the R-square and adjust R-square value are 0.86 and 0.85, which indicate that the equation has a good correlation, furthermore the value of D.W is 1.81 which indicate that there is no serious autocorrelation between current year cultivated area under cotton crop and market price. Therefore, the intercept passed T-test at the significant level is 10%, and the current year area and market price reached 1% significant level. The above results identify that the independent variables (current year`s market price and current year`s cultivated area) has correlative with dependent variable (current year`s production). Apart from what’s explained above, the coefficients in the table connotes that current year’s area and market prices have positive impacts on the production. It means when current year’s area increases 1%, the production will rise by 0.344%, and when current year’s market price increases 1%. The production will rise by 0.249%, which conforms to the equation hypothesis 1. Table 4 indicates that the comparing results of Tables 3 and 4 show that the R-square and adjust R-square values are 0.89 and 0.87 respectively, which concludes that the equation has a highly significant relationship.
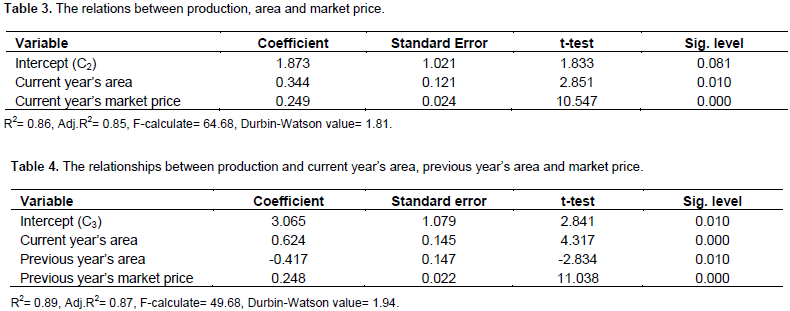
The value of D.W has calculated 1.94, which means no series auto-correlation exists. Furthermore, t-test results also have significant levels which are 1% it is more than Table 2. With respect to the variables’ coefficients, current year’s area and previous year’s market prices have positive correlations with production; however, previous year’s area is negatively correlative with production, which means if previous year’s area rises, the production will decrease. Furthermore, current year’s market price or previous year’s market price is positively proportional to the production. Results above are consistent with equation hypothesis 3. Nevertheless, the reason why previous year’s area has negative influence on production remains to be considered in a deeper sense. If the previous year’s cultivated area is large under the unchanged input ratio and technology, which means the production will correspondingly increase, the cotton supply in the market will rise. Under the circumstance that market demand is stable, the increasing supply will tend to exceed the demand, and consequently the market price is lower, which obeys the regularities of supply and demand. When the market price goes down, the farmers’ cultivating interest will also decrease, subsequently reducing cultivated area or input, which will eventually bring down the production.
Effects of price regulation on cotton production
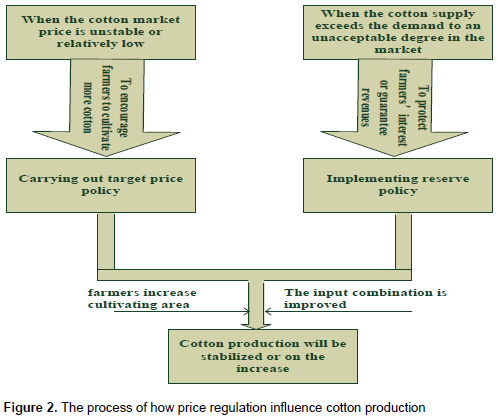
Since 2011, China has carried out cotton price regulation policies, one of which is cotton reserve policy, and the other is target price policy. Target price is the price which is announced by the government for willingness to buy farm products at a certain price, which is always announced before sowing. It is announced for encouraging farmers to steadily cultivate cotton (Motie et al 1998). The reserve policy works when the cotton supply is on great excess over demand in the market, functioning as an market regulation method, which plays a vital role in protecting farmers’ cotton planting revenue. What’s different between target price policy and reserve policy is that the former is carried out beforehand, but in contrast, the latter is performed afterwards. It implies that the target price policy is encouragement and incentive, however the reserve policy serves as the compensation in case that farmers will suffer from loss. The oscillation arose in cotton production, and yielded in the period 1990-2012 due to climate change, attack of pests, rainfall. Furthermore, the key factor which affected the yield and production more is the reduction of cotton market price, on account of which the farmers were reluctant to cultivate more cotton by implementing more application of inputs so area and yield of cotton was decrease, which is the effect on the production of cotton. As cultivating cotton can only bring a relatively lower interest, the farmers will be more apt to reduce the cultivated area of cotton. To stabilize the cotton production, taking effective measures to guarantee the cotton planting farmer’s revenues is of great importance. According to rules of supply and demand, if the target price goes up, the corresponding supply will also increase consequently, in which sense target price has close relations with cotton production.
When the government carries out higher target price, then the farmer will have keen interest in increasing the area of cotton cultivation for achieving the government targets (Figure 2).The cotton price in domestic and international market changed greatly in 2010, making the production unstable. Consequently, the Chinese government increased the target price for maintaining the production. In order to maintain the cotton production, protect the farmers’ benefit and boost their willingness to cultivate cotton, Chinese government implemented the reserve policy during the year 2011-2013 and target price policy in the year 2014. According to these policies, the government purchased cotton at 19,800yuan /ton in 2011 and also increased to 20,400 yuan/ton in 2012 and 2013. In 2014 the government adjusted the price policy: set a target price in 2014 and 2015, which are 19,100yuan /ton to 19,800yuan /ton respectively. From 2011 to 2015 price regulation effected positively on cotton production in domestic China. The consequences discoursed by important consultations clearly indicate that variation in production depends greatly on market price and price regulation of cotton. As market price changes more dramatically, price regulation has significant influence on stabilizing production and price in domestic market. Generally the rise of target price will reassure farmers so that they will cultivate cotton in a larger area or increase the usage of modern technologies and better inputs for achieving desirable production. Nevertheless, target price policy was only implemented in several places without being enlarged nationwide. Therefore, extension of target price policy remains to be done.
Cotton is one of the most important non-food cash crops and great contributions to the foreign currency earning in China. This study analyzed the effects of market price, price regulation and cultivating area on cotton production. Multi-regression model was used to examine the quantitative impacts of market price and cultivating area on cotton production from 1990 to 2013. Moreover, qualitative effects of price regulation on cotton production were also discussed. The regression results reveal that current year’s market price and cultivating area have positive influence on cotton production, showing 1% rise in current year’s market price. Increasing production by 0.249 and 1% led to current year’s cultivating area increase. Increase in production by 0.344%, conforms to equation hypothesis 1. In addition, the empirical results display that current year’s cultivating area and previous year’s market price exerts positive effects on cotton production, nevertheless, negative impact of previous year’s area on production was found, suggesting 1% increase in the current year’s cultivating area, thus, increasing production by 0.624%; 1% rise in previous year’s market price increases production by 0.248; 1% increase in previous year’s cultivating area decreases production by 0.417%, denoting market price and cultivating area have time lag effects on production and the coefficients are consistent with equation hypothesis 3. Moreover, analyzing results connotes that previous year’s market price has positive influence on current year’s market price, showing that 1% rise in previous market price increases current year’s price, which disobeys equation hypothesis 2. Apart from the regressive analysis, qualitative analysis was made to evaluate the effects of price regulation on cotton production, which showed price regulation has indirectly positive effects on cotton production. To stabilize the cotton production in China, on one hand, the government should actively adopt price regulation policies such as target price policy and reserve policy to cope with the unexpected change of the market price, which is sustainable to protect farmers’ interests; On the other hand, the government ought to take effective measures to protect the farmland and guarantee a reasonable land scale of cotton cultivation, which means the government should take responsibility for maintaining the area of cotton cultivation within a proper range.
The authors have not declared any conflict of interests.
REFERENCES
|
Amiti M, Fruend C (2010). "The Anatomy of China's Export Growth," in China's Growing Role in World Trade, Robert Feenstra and Shang-Jine Wei (eds.), University of Chicago Press.
|
|
|
|
Carter C, Zhong F, Jing Z (2012) "Advances in Chinese Agriculture and its Global Implications," Appl. Econ. Perspect. Policy 34(1):1-36.
Crossref
|
|
|
|
|
Chatterjee S, Hadi AS (2012). Regression analysis by example (5th ed.). Hoboken, NJ: John Wiley & Sons.
|
|
|
|
|
China National Garment Association (CNGA) (2014). An Overview of China's Garment Industry.
|
|
|
|
|
Cohen J, Cohen P, West SG, Aiken LS (2003). Applied multiple regression/correlation analysis for the behavioral sciences (3rd ed.). Mahwah, NJ: Lawrence Erlbaum Associates.
|
|
|
|
|
Du M (2011). Investigation and Analysis on Production and Market Behavior of Cotton Growers in China, presentation at 2011 China International Cotton Conference, Dalian, China, June 15-15, 2011.
|
|
|
|
|
FAO (2013). Food and Agriculture Organization of the United Nations and International Cotton Advisory Committee. World Apparel Fiber Consumption Survey
|
|
|
|
|
Gale F (2013). Growth and Evolution in China's Agricultural Support Policies,. ERR-153. U.S. Department of Agriculture, Economic Research Service.
|
|
|
|
|
Ge YL, Holly W, Sung H (2010). Cotton market integration and the impact of China's new exchange rate regime. Agric. Econ. 41(5):443-451.
Crossref
|
|
|
|
|
Hua L (2013). Thoughts of the Implementation of Macro Regulatory Policy for Cotton and CNCRC's Development Strategy, presentation at Dialog on China's Cotton and Textile Industry Evolution, New York, July 15, 2013.
|
|
|
|
|
Huang J, Xiaoping W, Scott R (2013). The subsidization of farming households in China's agriculture. Food Policy 41:124-132.
Crossref
|
|
|
|
|
International cotton Advisory committee (ICAC) (2015). International cotton Advisory committee, press release on consumption may overtake production in 2015-16.
|
|
|
|
|
International Textile Manufacturers Federation (ITMF) (2014). Cotton Contamination Surveys (2003, 2005, 2007, 2009, 2011, and 2013).
|
|
|
|
|
Koondhar MA, Chandio AA, He G, Joyo MA, Koondhar MA, Jamali RH (2016). An Effect of support price toward the growth rate of Sugarcane production: Evidence from Sindh and Punjab provinces of Pakistan. Int. J. Agric. Mark. 3(1):097101.
|
|
|
|
|
Lokhande RK, Rao GV, Mohan P (1995). Economics of cotton production in India. Adv. Plant Sci. 8:109-114.
|
|
|
|
|
Magsi H (2012).support price: growth rate of cotton production in Pakistan. Agric. J. 7 (1):21-25.
|
|
|
|
|
Motie N, Sadrolashrafi M (1998). Investigation the effect of agriculture price policy on Cultivated Area of basic products in Iran. Iran. J. Agric. Sci. 29:435-445.
|
|
|
|
|
National Bureau of Statistics of China (2008). Communiqué on Major Data of the Second National Agricultural Census of China (No.1). Copy on Internet Archive.
|
|
|
|
|
Stat (2015). Statistics Bureau of China 2015.
View
|
|
|
|
|
Studwell J (2013). How Asia Works: Success and Failure in the World's Most Dynamic Region, New York: Grove Press.
|
|
|
|
|
UNEP (2002). Integrated Assessment of Trade Liberalization and Trade-Related Policies, A country study cotton sector of china.
|
|
|
|
|
Wang W, Li XH, Wang XF, Wang XZ, Lu H, Jiang XN, Xu XB (2009). Levels and chiral signatures of organ chlorine pesticides in urban soils of Yinchuan, China. Bull. Environ. Contam. Toxicol. 82:505-509
Crossref
|
|
|
|
|
Wang Z, Wei SJ (2008). What accounts for the rising sophistication of China's exports?, National Bureau of Economic Research. Working Paper 13771.
|
|
|
|
|
Yang HQ, Cui WG (2010). Cotton industry in China, status and development strategies. Crops 5:13-17
|
|
|
|
|
Zhu L (2011). Food Security and Agricultural Changes in the Course of China's Urbanization. China World Econ. 19(2):40-59.
Crossref
|
|


