ABSTRACT
Considering that mechanized digging is an important stage in the productive chain of peanut, the studies related to the quantification of visible, invisible and total losses are still scarce, making it necessary to investigate these losses in order to obtain the operation control. In this context, the aim of this study was to evaluate the losses mentioned and the operational performance in the mechanized peanut digging related with five rotations in the tractor power take-off (PTO), verified by statistical control of the process (SCP). The experiment was carried out in tracks with eight replications for each treatment, making a total of 40 sampling points. There was no influence of PTO rotations in the visible, invisible and total loss averages during digging. The PTO rotation in 378 rpm (6.3 Hz) presents smaller variability of visible, invisible and total digging losses. The lowest fuel consumption variability and average speed are obtained with 486 rpm (8.1 Hz) and 378 rpm (6.3 Hz) PTO rotation, respectively.
Key words: Arachis hypogaea L., harvest losses, vibratory treadmill, control charts.
In Brazil, peanut (Arachis hypogaea L.) cultivation has expanded, influenced by mechanization, from sowing until harvesting and the São Paulo state is the greatest Brazilian producer; accounting for about 80% of production (Santos et al., 2013). Most peanut production occurs under highly intensive conventional tillage systems (Jackson et al., 2011). According to Jackson et al. (2011), growers can experience yield loss when switching from peanut conventional tillage to strip-tillage in certain soil types due to the lack of an elevated bed at harvest time. In São Paulo it is common its utilization in areas of sugar cane renovation under conventional tillage systems. Mechanized harvesting of peanuts in Brazil is recent and has more losses compared with other crops. Peanut digging losses are inevitable, reaching higher levels with compacted soil and lower soil water content, with weak peduncle because of maturation excess, and premature defoliation caused by diseases (Roberson, 2008). Among the factors affecting digging stand out: the digger, knife sharpening, cut depth, the vibration in the shaking conveyor, and the relation between the forward speed and the treadmill speed. The incorrectly determined peanut maturity at harvest can lead to high economic losses for farmers and the peanut industry as a whole (Rowland et al., 2006).
The mechanical loss, termed digging loss, is the retention of pods in the soil during the digging process due to separation of the pod from the stem attached to the plant (Rowland et al., 2006). Digging losses have been estimated to be 8% of the total yield but can reach 40% at dates beyond optimal maturity (Young et al., 1982; Lamb et al., 2004). In Brazil some authors have used the statistical control of the process to identify harvest losses using the variables evaluated as quality indicators, whose tools to identify the nonrandom causes are usually the control charts (Cassia et al., 2013; Peloia et al., 2010).
Given the above, it is presupposed that the change of rotation in the tractor power take-off (PTO) can influence the digger performance, affecting the quality of operation, considering that there is a manufacturer indication to work with rotation in PTO below 540 rpm (9.0 Hz). This study aimed to evaluate the operational quality of the peanut mechanized digging with five rotations in PTO, was used as quality indicators the digging losses and operational performance of the mechanized set.
The experiment was carried out in the experimental area of the Machines and Agricultural Mechanization Lab of UNESP/Jaboticabal, in the state of São Paulo, Brazil, at 21°14’ S and 48°16’ W, with average altitude of 560 m, average slope of 4% and climate Cwa (subtropical), according to the Köeppen classification. The soil of the experimental area is classified as Oxissoil. The rainfall and average temperature during the experiment were 141.1 mm and 21°C, respectively.
The soil tillage was conventional, with one plowing and two harrowing, and the peanut sowing was performed in 10th November, 2011 with a pneumatic fertilizer seeder in spaces of 0.9 m between lines, using 18 seeds m-1; the cultivar used as Runner IAC 886 (Virginia Group). The digging operation was performed in 30th March, 2012, using one digger mounted 2x1 (two lines and one windrow), model C-200, pulled by a tractor model BMi 125, 4x2 TDA with power of 91.9 kW in rotation of 38,33 Hz (2300 rpm) in engine.
The experimental design was in tracks, with five rotations of PTO: 324 rpm (5.4 Hz), 378 rpm (6.3 Hz), 432 rpm (7.2 Hz), 486 rpm (8.1 Hz) and 540 rpm (9.0 Hz); defined by the variation of engine rotations (20.0, 23.3, 26.7, 30.0, 33.3 and 38.3 Hz, respectively), and eight replications. Consequently, the variation of PTO rotation promoted alterations in the rotation of shaking conveyor of the digger (1.5, 1.7, 1.9, 2.1 and 2.3 Hz, respectively). By the digging operation, the losses (visible (VDL), invisible (IDL) and total (TDL)), the fuel consumption and the average speed were evaluated.
The losses were evaluated by using a metal frame of 2 m² (1.11 x 1.80 m). This measure of the frame was determined for reaching the exact width of the digger, being placed on two peanut lines. The visible digging losses (VDL) consisted in the collect of all pods and peanut seeds found in soil surface after the digging operation, and the invisible losses (IDL) are the pods found under the soil surface, in the same place of evaluation of the visible losses. The sum of these two losses results in the total digging losses (TDL). For the determination of fuel consumption was performed using a flowmeter, comprising of two flow meters installed in series with two temperature gauges for monitoring the flow and return of the injection pump. Displacement speed values were obtained by the radar unit located on the right side of the tractor, forming an angle of 45° with the ground.
During the harvesting, soil samples were collected in layers from 0 to 0.15 m, in all sampling points, for the characterization of the soil water content. It was also collected 30 pods for the characterization of the pods water content. The characterization of yield was performed by the collect of one sampling point for each rotation evaluated. It was quantified by the sum of all totally developed pods taken off the plants, including the visible and invisible digging losses. The characterizations were performed after the digger passage.
The samples of soil, losses, pods and yield were sent to the lab for the determination of mass in digital balance, with precision of 0.01 g. Afterwards they were taken to an electric oven, in a temperature of 105 ±3°C, during 24 h, for obtainment of the dry masses. All the samples went through a sieving before the weighing, for the detachment of the soil in the pods. The samples of losses and yield were corrected to 8% (water content of peanut storage). The characterization of pods maturation was performed by Hull Scrape method (Williams and Drexler, 1981), with the collect of 200 pods in 10 random chosen plants in the studied area. The characterization of water content, in the soil and in the pods, maturation and yield presented approximate values of 26.68, 55.48 and 74.37%, 2.43 Mg ha-1, respectively.
The results were submitted to descriptive statistics analysis to the calculus of central tendency measures (mean and median), dispersion measures (range, standard deviation and variation coefficient), measure of skewness and kurtosis. The Anderson-Darling test was performed in order to verify the normality of data or the need of transformation for normalization. The variables transformed were those that presented non-normality distribution, being transformed through the function: y=1/√y.
The averages were compared by Tukey test to 5% of probability, when there was significance in the variance analysis (Snedecor F test to 5% of probability). The averages were represented by box plots, that illustrate the variability and the symmetry of the data set; the presence of outliers was indicated by (*). The box plot can be indicated to the comparison of two or more data group located inside a variable. It helps in the interpretation of the behavior of a data group based in descriptive parameters, like median (Q2), lower quartile (Q1), upper quartile (Q3), interquartile range (IQR = Q3 ? Q1), and the maximum and minimum values.
The results were also evaluated by statistical control of process, using control charts, type I-MR (individual value and moving range), that have central lines (general average and mean range), as well as the upper and lower control limit, defined as UCL and LCL. These limits were calculated based on variables standard deviation (for UCL, average plus three times the standard deviation, and for LCL, average minus three times the standard deviation, when bigger than zero). These charts were used in order to identify the non-randomness caused by some external factor, and to evaluate the operation quality, using as quality indicators the variables described above.
Descriptive and variance analysis
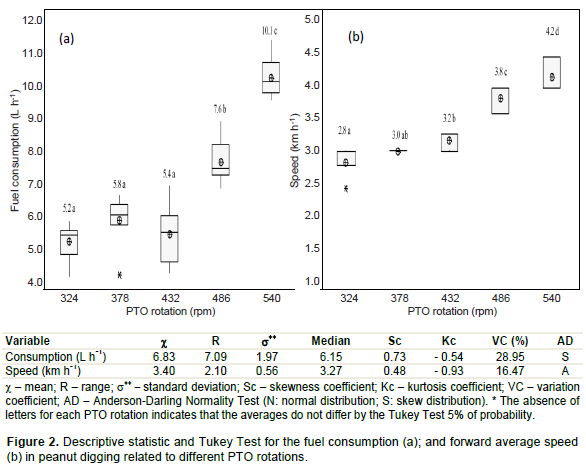
In the analyzed variables there were outliers that can be seen in the box plots. These results were kept in all the statistical analysis performed, once that these outliers are part of the process and can help to identify the occurrence of non-random causes. The variables referring to the losses (Figure 1) presented non-normality distribution by the Anderson-Darling test. This asymmetry was also indicated for the VDL variable that presented positive skewness coefficient, demonstrating that themean is higher than the median; therefore, the results tend to concentrate below average. Besides, the negative kurtosis coefficient shows the existence of a platykurtic distribution curve. For the variables IDL and TDL it was verified the positive coefficients of skewness and kurtosis. The last one is represented by high values that characterize a more elongated distribution curve, in relation to the normal distribution curve. The rotations of 432, 486 and 540 rpm showed larger interquartile intervals for VDL and TDL, what indicates larger variability of these data sets. On the other hand, the same rotations in PTO to VDL presented smaller intervals, evidencing smaller variability for this variable. The smallest interquartile distance for VDL, IDL and TDL was found for the rotation in PTO in 378 rpm.
In the treatments evaluated there was no difference in losses (VDL, IDL, TDL) in function of the PTO rotation, what can be explained by the very high values of variation coefficients and the ranges. The manufacturer recommendation to work below 540 rpm in PTO, reaching 350 rpm in PTO, cannot be supported because there is no difference of the digging losses to the different tested rotations.
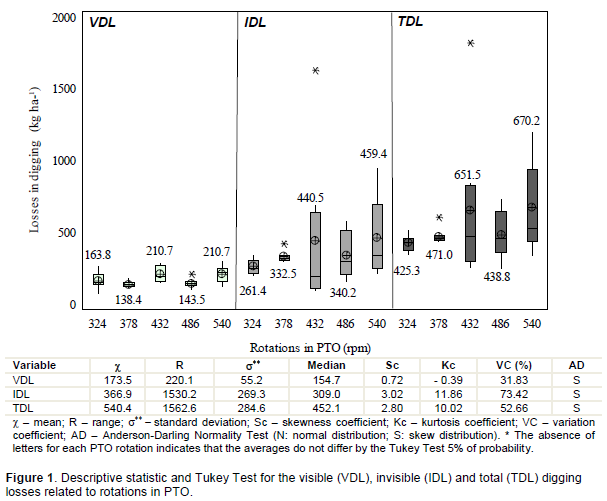
The fuel consumption (Figure 2a) presented non-normality distribution according to the Anderson-Darling test. The distribution presented positive skewness coefficient and negative kurtosis coefficient, indicating that the curve is more elongated to the right and more flattened in relation to the normal distribution curve, respectively. For the fuel consumption variable there was difference in treatments, the PTO rotation in 540 rpm showed the highest consumption, followed by the rotation of 486 rpm, and other treatments there was no difference in the results. It was observed that increasing the engine rotation there was also an increase in fuel consumption because of the power demand of the digger-tractor set; it is evidenced by the engine characteristic curve. According to Márquez (2011), minimum specific consumption of an engine is obtained at an operating point close to the maximum torque, that is, with less rapid
engine which corresponds to the nominal operating regime.
In this way, in relation to the manufacturer recommendation to work with the PTO rotation below 540 rpm, it is necessary to considerate that the machine is being used in inappropriate conditions, in spite of the losses did not differ to the evaluated rotations and the increasing of rotation had affected the fuel consumption. In the region it is common the usage of tractors with power of 91.9 kW for the peanut digging operation. Once that for higher rotation (greater consumption), there is a proximity of the great consumption point, which corresponds to the operational condition in which the point of minimum specific consumption occurs.
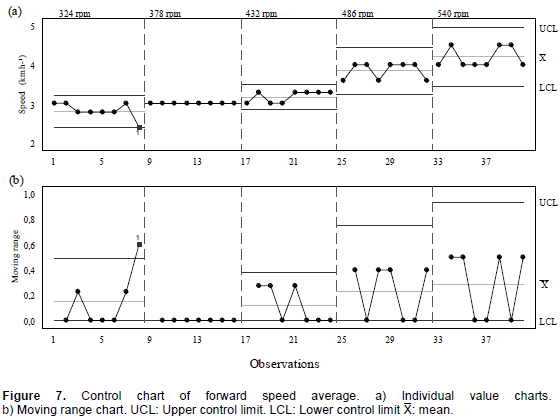
The forward speed average (Figure 2b) presented data set non-normality distribution, verified by the positive skewness coefficient and the negative kurtosis. It indicates that data behavior is dislocated below average and with characteristic of a flattened curve, where values tend to go farther of average. This quality indicator was greater in PTO rotation of 540 rpm. In spite of the differences observed, the increase of average speed did not result in increasing of digging losses.
Operation quality analysis
With the quality indicator (VDL, the process was kept stable, showing that only random causes influenced (Figure 3), as in the individual values charts, far as in the moving range. The PTO rotation in 378 rpm was the treatment that obtained lower standard deviation, evidenced by the control limits (UCL and LCL). It can be pointed as the rotation with the greatest operation quality. Although the process has been stable, the values verified in the individual value charts can indicate clustering and/or oscillations runs for the PTO rotation in 378 and 486 rpm. The other evaluated PTO rotations, specially in 324 rpm, presented wide variation of the control limits, what can be associated with the high standard deviation values, with the variation coefficients and with the ranges.
In relation to the evaluated rotations, the IDL presented stable behavior, confirming the non-existence of special causes inherent to the process (Figure 4). For the PTO rotations in 324 and 378 rpm the values tended to focus around the average, what can indicate lower variability of invisible losses (moving range chart), in spite of the variation coefficient, in general high, it can be associated to the soil water content, machine regulation, appropriate PTO rotation and operation quality performed by the machine operator.
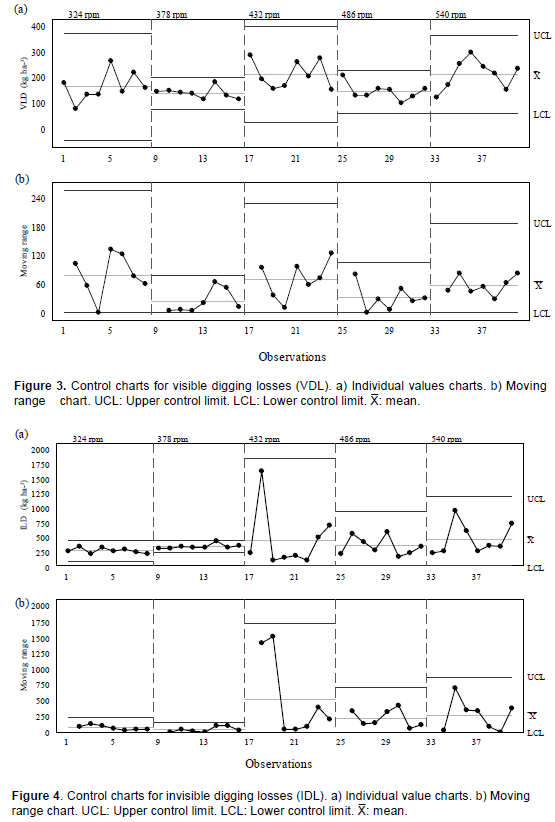
It was also observed that the PTO rotation in 432 rpm presented one isolated point of high IDL, creating a high standard deviation, consequently, the control limits were wider, overestimating the losses. In other rotations there was an increase in the variability of these losses in relation to those found in 324 and 378 rpm in PTO, which means the sampled points were more distant of the average. It can be proven by the higher standard deviation and range (in the individual value charts and moving range, respectively) and by increase the rotation of PTO, implicating in higher invisible losses.
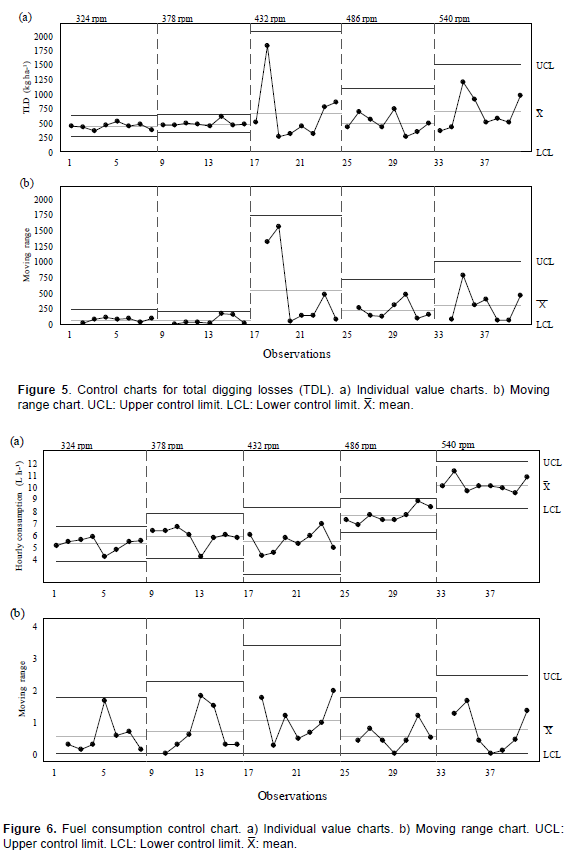
The TDL were stable in relation to the studied rotations. According to the optic of statistical control of process, it indicates that randomness existent is intrinsic to the process (Figure 5). This variable presented similar behavior to the quality indicator IDL, what is observed in the individual value charts and moving range charts. It is explained by the fact that the IDL average was higher in relation to the VDL. When both were added, for the creation of TDL, there was greater predominance of invisible losses. This consideration can indicate that the mean cause of losses in peanut mechanized digging operation is associated to the invisible losses, independently of the rotation used in PTO, representing about 64% of total digging losses.
The PTO rotation that caused lower variability in the process, or the one that had the higher operation quality, was with 378 rpm. The TDL presented lower variability in rotation of 324 and 486 rpm in PTO in relation to the IDL, indicating that the higher operation quality for total losses in peanut digging was verified in these situations. And, they can be evidenced in the variation process chart (moving range). In others evaluated rotations the variability was higher when associated with the invisible digging losses. For the fuel consumption (Figure 6) the process can be considered stable, once that there was no existence of point above or below the upper and lower limits of control, indicating the absence of special causes. For the evaluated rotations, the data may have suffered the clustering effect around the average, in some points. It can be verified by the individual value charts, and it can influence in possible variations throughout the process. As the engine rotation is altered it is noticeable the increase of fuel consumption, because the machine needs more power to work and keep the desirable speed.
The PTO rotation of 378 rpm (6.3 Hz) presents lower variability in the visible, invisible and total digging losses, and there was no influence of PTO rotations in the averages of the visible, invisible and total digging losses. The lower variability of fuel consumption is obtained when it is used rotation of 486 rpm (8.1 Hz) in PTO. The forward speed average presents higher operational quality in the rotation of 378 rpm (6.3 Hz) in PTO. The fuel consumption and the forward speed average are greater in the PTO rotation in 540 rpm (9.0 Hz).
The authors have not declared any conflict of interest.
REFERENCES
Cassia MT, Silva RP, Chioderolli CA, Noronha RHF, Santos EP (2013). Quality of mechanized coffee harvesting in circular planting system. Ciência Rural. Santa Maria. 43(1):28-34.
Crossref |
|
|
Jackson JL, Beasley JPJR, Tubbs RS, Lee RD, Grey TL (2011). Fall-Bedding for Reduced Digging Losses and Improved Yield in Strip-Till Peanut. Peanut Science. College Station. 38:31-40.
Crossref |
|
|
Lamb MC, Masters MH, Rowland D, Sorensen RB, Zhu H, Blankenship PD, Butts CL (2004). Impact of sprinkler irrigation amount and rotation on peanut yield. Peanut Science. College Station 31:108–113.
Crossref |
|
|
|
Márquez L (2011). Agricultural Tractors: technology and use. Blake y Helsey Espa-a S. L., Madrid, Espa-a. (in Spanish). |
|
|
Peloia PR, Milan M, Romanelli TL (2010). Capacity of the mechanical harvesting process of sugar cane billets. Scientia Agricola, Piracicaba 67(6):619-623.
Crossref |
|
|
|
Roberson GT (2008). Planting, harvesting, and curing peanuts. In: Peanut information. Coop. Ext. Ser. Series AG-331. North Carolina State Univ, Raleigh, NC. pp. 121-134. |
|
|
Rowland DL, Sorensen RB, Butts CL, Faircloth WH (2006). Determination of Maturity and Degree Day Indices and their Success in Predicting Peanut Maturity. Peanut Science. College Station. 33:125–136.
Crossref |
|
|
Santos EP, Silva RP, Bertonha RS, Noronha RHF, Zerbato C (2013). Produtividade e perdas de amendoim em cinco diferentes datas de arranquio. Revista Ciência Agronômica, Fortaleza, CE, Brasil. 44(4):695-702.
Crossref |
|
|
Williams EJ, Drexler JS (1981). A non destructive method for determining peanut podmaturity. Peanut Science. College Station 8(2):134-141.
Crossref |
|
|
|
Young JH, Person NK, Donald JO, Mayfield WD (1982). Harvesting, curing and energy utilization. In H.E. Pattee and C.T. Young (eds.). Peanut Science and Technology. Amer. Peanut Res. Educ. Society., Inc., Yoakum, TX, USA, pp. 458–485. |