African Journal of
Biotechnology

  • Abbreviation: Afr. J. Biotechnol.
  • Language: English
  • ISSN: 1684-5315
  • DOI: 10.5897/AJB
  • Start Year: 2002
  • Published Articles: 12488

Full Length Research Paper

Assessment of genetic diversity among cassava landraces using single nucleotide polymorphic markers

Ruth Naa Ashiokai Prempeh
  • Ruth Naa Ashiokai Prempeh
  • Biotechnology Section, CSIR-Crops Research Institute P. O. Box 3785 Kumasi, Ghana.
  • Google Scholar
Joseph Akwasi Manu-Aduening
  • Joseph Akwasi Manu-Aduening
  • Biotechnology Section, CSIR-Crops Research Institute P. O. Box 3785 Kumasi, Ghana.
  • Google Scholar
Marian Dorcas Quain
  • Marian Dorcas Quain
  • Biotechnology Section, CSIR-Crops Research Institute P. O. Box 3785 Kumasi, Ghana.
  • Google Scholar
Isaac Kwasi Asante
  • Isaac Kwasi Asante
  • Department of Crop Science, Faculty of Agriculture, University of Ghana, Legon Ghana.
  • Google Scholar
Samuel Kwasi Offei
  • Samuel Kwasi Offei
  • Department of Crop Science, Faculty of Agriculture, University of Ghana, Legon Ghana.
  • Google Scholar
Eric Yirenkyi Danquah
  • Eric Yirenkyi Danquah
  • Department of Crop Science, Faculty of Agriculture, University of Ghana, Legon Ghana.
  • Google Scholar


  •  Received: 31 January 2018
  •  Accepted: 15 June 2020
  •  Published: 30 June 2020

 ABSTRACT

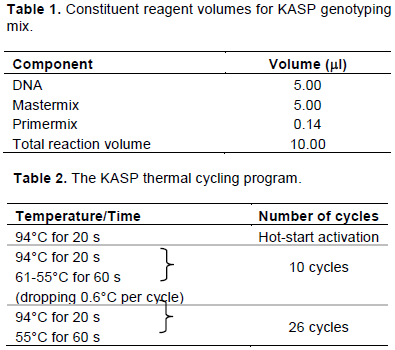
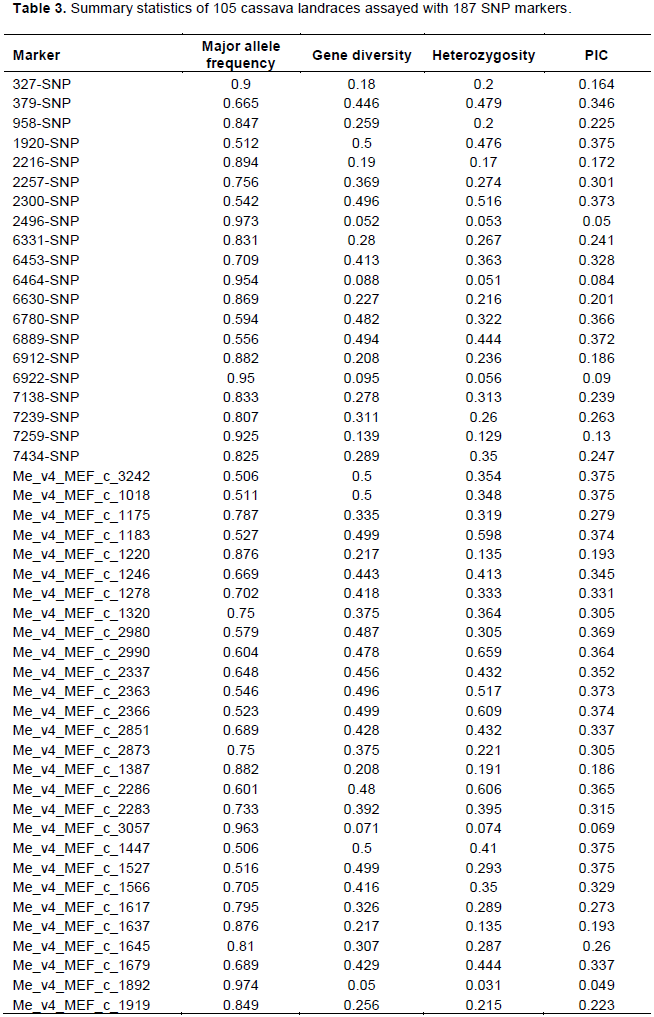
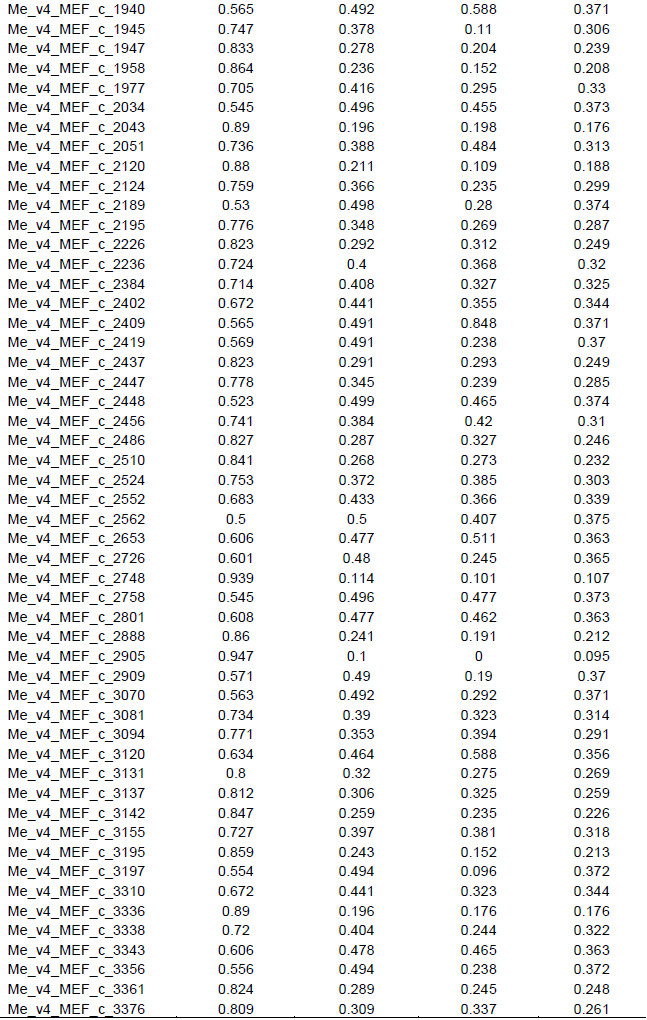
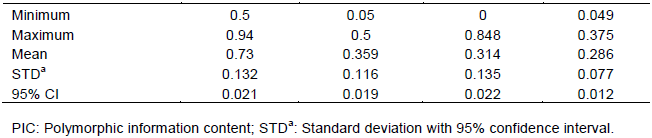
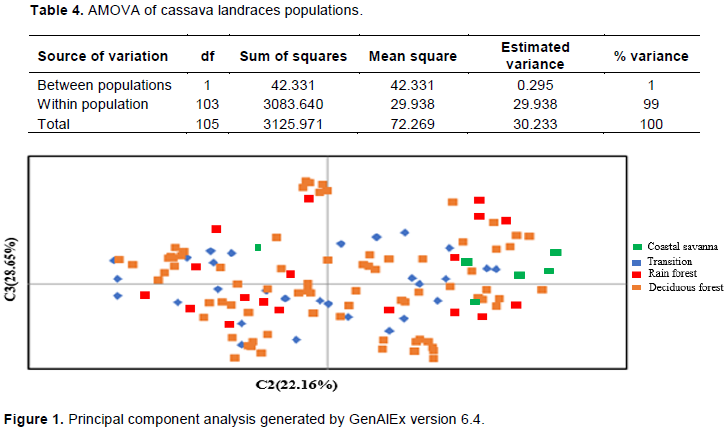
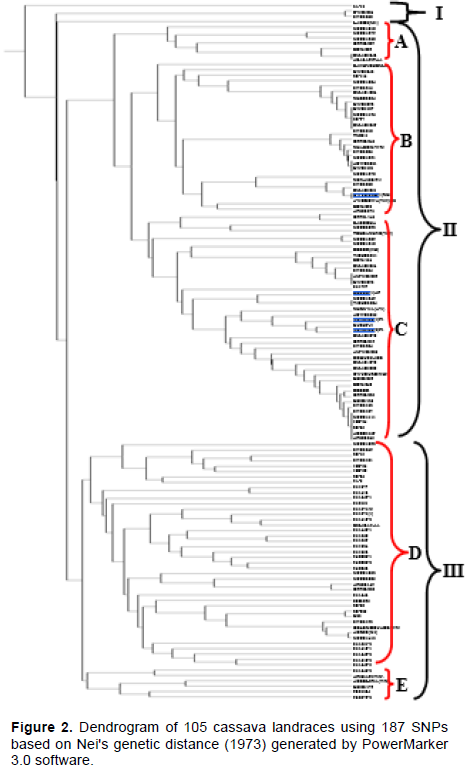
This study seeks to determine the genetic diversity among cassava landraces using single nucleotide polymorphic (SNP) markers. One hundred and five cassava landraces were assayed with 195 SNP markers. Major allele frequency varied from 0.500 to 0.942 with an average of 0.728. Average gene diversity, heterozygosity and polymorphic information content (PIC) were 0.359, 0.314 and 0.286 respectively. These values were generally high considering the bi-allelic nature of SNPs, hence the cassava landraces studied showed moderate to high genetic diversity. This suggests availability of unique and useful alleles that could be exploited for breeding purposes. Inclusion of these landraces in our crop improvement activities will enhance the development of farmer preferred cassava varieties. SNP markers used for the study were highly informative, polymorphic and revealed good estimates of genetic diversity among the landraces. Higher level of genetic variation was observed within population based on analysis of molecular variance (AMOVA). Principal component analysis (PCA) and cluster analysis also grouped landraces into three distinct clusters; however, they did not group in accordance to geographical origin. This could be due to high frequency of germplasm exchange between farmers and subsequent change of the name of the same cultivar. Results from this study may contribute significantly to cassava breeding and germplasm conservation programs.


Key words: Genetic diversity, single nucleotide polymorphisms (SNPs), polymorphic information content (PIC), polymorphic, alleles, heterozygosity, germplasm.


 INTRODUCTION

Cassava (Manihot esculenta Crantz), member of the family Euphorbiaceae is a major root crop cultivated in most countries in sub-Saharan Africa. It is a staple for millions of households (Rabbi et al., 2014) and a subsistence crop due to its flexibility in planting and harvesting times. Cassava serves as a food security crop because of  its  high  source  of  carbohydrate,  ability  to thrive under different climatic conditions (Tumuhimbise et al., 2014) and multipurpose uses for human consumption, animal feed and industrial applications (Rabbi et al., 2012). In Ghana, cassava is a major root crop and it is cultivated in all regions in the country. The livelihoods of about 70% of smallholder farmers depend on the crop. Over  the  years,  a  lot  of   improved   cassava   varieties
 
have been developed and disseminated in Ghana. However, farmers still keep diverse sets of landraces on their farms, although they may be low yielding and susceptible to some biotic and abiotic stresses. These landraces may have increased genetic diversity which could promote gene flow through hybridization (Turyagyenda et al., 2012). Thus, landraces are important genetic resources (Mtunguja et al., 2014) for breeding and other crop improvement activities. They have different attributes which may present favorable characteristics that can contribute to food and nutritional security since it gives species the ability to adapt to changing environments including new pests, new diseases and new climatic conditions. They also provide opportunity for plant breeders to develop new and improved cultivars with desirable characteristics, for in situ conservation and studies on genetic diversity and evolution. To guarantee the security of these genetic resources, landraces must be maintained to avoid losses. However, they need to be characterized before they are maintained or conserved. This is necessary since there could be a mix up in the landraces where the same accession may have different names or different accessions may have the same name in different places. In addition, continuous exchange of planting materials between different farmers through both formal and informal distribution systems, make pedigree information limited and unreliable. Therefore, characterization of landraces is necessary as it will facilitate the removal of duplicates and creation of core collection for utilization by plant breeders. A prerequisite for any breeding programme is knowledge of the extent of genetic variability among cultivars. Such information guides the breeder to select distant parents to broaden the genetic base and to produce superior progenies.
 
Recent advances in molecular techniques have provided useful tools for characterization. Thus, molecular markers are widely used in plant genetic research and breeding. These markers permit the detection of genetic differences among closely related landraces, highly polymorphic, more stable and less influenced by the environment (Tiago et al., 2016). Several molecular markers have been used to characterize cassava germplasm to identify genetic variability. These include Random Amplified Polymorphic DNA (Rimoldi et al., 2010), Amplified Fragment Length Polymorphism (Benesi et al., 2010), microsatellites (Gonçalves et al., 2017) and more recently, Single nucleotide polymorphic (SNP) markers (Mtunguja et al., 2017).
 
With recent advances in high-throughput genotyping technologies, SNPs are increasingly becoming markers of choice for plant genetic studies and breeding. This is because of its cost effectiveness, locus specificity and co-dominant nature (Ren et al., 2013). Expressed sequence tags (ESTs) are fragments of mRNA sequences derived through   single   sequencing   reactions   performed    on randomly selected clones from cDNA libraries (Parkinson and Blaxter, 2009). EST collections have been used to detect SNPs in crops such as maize (Ching et al., 2002) and soybean (Zhu et al., 2003). These SNPs have proved to be effective in the characterization of these crops. Similar studies in cassava has also led to the detection of SNPs from ESTs (Lopez et al., 2005; Ferguson et al., 2012), of which 1,190 have been validated and could be used in characterizing cassava. The aim of this study was to assess the genetic diversity among cassava landraces in Ghana using SNP markers. Understanding the extent of genetic diversity among cassava landraces may enhance efficient utilization by breeders for improving the crop.


 MATERIALS AND METHODS

Source of germplasm
 
A total of 105 cassava landraces were collected from farmers’ field in four major cassava growing zones (the rain forest, deciduous forest, transition and coastal savannah zones) of Ghana.
 
Screen house establishment
 
The planting materials were sprouted at the experimental station of the CSIR-Crops Research Institute, Kumasi, Ghana (6°41’N, 1°28’W).
 
Molecular characterization
 
DNA extraction
 
Total genomic DNA was extracted using standard procedures according to Egnin et al. (1998). About 200 mg of freshly harvested apical leaves of each accession were ground in liquid nitrogen into fine powder. Eight hundred microliters of extraction buffer (50 mM Tris HCL, pH 8.0, 300 mM NaCl, 20 mM EDTA, 20% PVP, 1.5% Sarcosine and 0.1 g/L Na2S2O2) were used to lyse nuclear membranes.
 
Proteins and polysaccharides were precipitated by adding 400 µl of 5 M potassium acetate (instead of 800 µl of phenol chloroform isomyl alcohol) as used by Egnin et al. (1998) and the samples centrifuged at 13,000 rpm for 10 min. RNA was removed by adding 4 µl RNase A (10 mg/ml) and incubated at 37°C for thirty minutes. DNA was precipitated using 700 µl of ice-cold isopropanol and centrifuged at 13,000 rpm for ten minutes. Eighty percent ethanol was used to wash DNA and centrifuged at 13,000 rpm for five minutes. Ethanol was discarded and DNA pellets were air-dried at room temperature. DNA pellets were resuspended in 200 µl 1Ò² TE (Tris-ethylenediaminetetracetic acid) buffer after which quality of DNA was determined on 0.8% (w/v) ethidium bromide stained agarose gel. The purity and quantification of DNA was determined by measuring the absorbance at 260 nm (A260) and 280 nm (A280) with a spectrophotometer (Biochrom Libra S12).
 
SNP genotyping
 
KASPar technology was employed for SNP genotyping at the KBiosciences laboratories (United Kingdom). One hundred and ninety-five SNP markers developed from the Generation Challenge Programme (GCP) were used for the genotyping.
 
The genotyping assay for KASPar consisted of two reagent components (KASP Primer mix and KASP Master mix) plus the DNA sample. The KASP Primer mix was made up of two allele-specific forward primers and one common reverse primer. The KASP Master mix contained the FAM and HEX specific FRET cassette system, Taq polymerase, dNTP's, 5-carboxy-X-rhodamine, succinimidyl ester (ROX) and MgCl2 in an optimized buffer solution. The KASP Primer mix was combined with the KASP Master mix and added to the DNA samples (5 - 50 ng) to be genotyped (Table 1) in a 96-well plate and sealed using the KubeTM heat-based sealer. The reaction was carried out in a standard thermal cycler with conditions comprising two temperatures (Table 2). After completion of the PCR run, the scan results were read, and allele call was generated from the KlusterCaller software. SNP markers that were monomorphic were considered non informative and were removed from further analysis. A total of 187 SNP markers were therefore retained for genetic diversity analysis.
 
 
Data analysis
 
The genetic analysis package PowerMarker version 3.2 (Liu and Muse, 2005) was used to generate the following genetic diversity parameters: gene diversity, heterozygosity and polymorphic information content (PIC) (Bostein and White, 1980). PIC values were calculated with the equation: PIC=1-ΣP2iï¼Σ 2P2i P2J Where: ΣP2i = sum of each squared ith haplotype frequency. The software was used to calculate genetic distances among genotypes using the Euclidean method and neighbour-joining (NJ) algorithm (Nei, 1973) to construct a dendrogram from the distance matrix using MEGA 5.2 software (Tamura et al., 2007) embedded in PowerMarker. Analysis of molecular variance (AMOVA) and principal component analysis were performed using GenAlEx 6.4 software (Peakall and Smouse, 2006).


 RESULTS AND DISCUSSION

Genetic diversity
 
Genetic  variation  among   genotypes   is   important   for sustainable use of genetic resources to meet the demand for future food security as well as conservation strategies. This study was conducted to establish the genetic diversity among cassava landraces. Polymorphism frequencies are an important criterion that can be used to assess the value of molecular markers for germplasm characterization (Singh et al., 2013). From a total of 195 SNPs markers used for the study, 187 (96%) were polymorphic and 8 (4%) were monomorphic. The polymorphism observed in this study can be attributed to the fact that cassava landraces used for the study were diverse. In this regard 187 out of 195 SNPs used provided adequate informative polymorphism to evaluate genetic diversity of the cassava landraces. The high number of polymorphic SNPs is consistent with the mode of reproduction, genetic breeding system, and level of genetic variation in cassava. The results of this study were in close agreement with findings by Oliveira et al. (2014) who reported 1.5% of monomorphic SNPs when 1,280 cassava accessions were analyzed with 402 SNP markers.
 
PIC is a measure of the informativeness of a marker. The higher the PIC value the more informative the marker. PIC values varied from 0.049 to 0.375 with an average of 0.286 (Table 3), and approximately 56% of SNPs had estimates over 0.30. This suggests that the SNPs were informative and could discriminate among genotypes, hence could be candidate markers for genetic variability studies. Although the SNPs were informative, PIC values obtained with SNPs are generally lower compared to other molecular markers such as Simple Sequence Repeat (SSR) markers. In a recent study, PIC value varied between 0.030 to 0.780 when 89 cassava accessions were assayed with 35 SSRs (Adjebeng-Danquah et al., 2020). The low PIC value observed in this study is due to the bi-allelic  nature  of  SNPs,  hence PIC values can range from 0.000 to 0.500, compared with SSRs which are multiallelic and can have PIC values above 0.500 and up to 1.000. Consequently, results from this present study demonstrate that the set of SNPs used were sufficiently informative and can be used for cassava genotyping to establish the relatedness between genotypes. PIC values however, observed in this present study was higher than that observed (PIC=0.170) by Karim et al. (2020) where cassava collections were analyzed with 5600 SNPs. The discrepancy could be attributed to differences in composition of experimental material, number and selection of SNP markers used for the studies.
 
 
Major allele frequency (MaF) for all the markers was generally high. It ranged from 0.500 to 0.942 with an average of 0.728 (Table 3). More than 50% of the polymorphic loci showed a major allele frequency higher than 0.700 and 9 loci showed more than 0.900. This is an indication that all the markers were polymorphic.
 
Heterozygosity, which is a measure of allelic diversity at a locus varied from 0.000 to 0.848 with an average of 0.314 (Table 3). Approximately 91% of the estimates were lower than 0.500. In contrast gene diversity (GD) varied from 0.50 to 0.500 with an average of 0.359, and only 29% of GD estimates were greater than 0.450. As heterozygosity is a measure of genetic variation among genotypes, the average heterozygosity observed could be expected to correlate with moderate to high genetic diversity. Average heterozygosity values however, observed in this present study was lower than that observed by Ferguson et al. (2019), who used 1,536 SNPs to genotype 522 cassava accessions (0.366). This is expected since most of the accessions used were collected from South America which encompasses the presumed centre of domestication and diversity of the crop. Average gene diversity value observed in this present study was higher than that observed by Kamanda et al. (2020), where 5,634 SNPs were used to assay 183 provitamin-A cassava accessions (GD=0.190). The differences could be attributed to the experimental materials and selection of SNP markers used. The average gene diversity was however higher than the heterozygosity in this study, suggesting inbreeding or heterozygote deficit in relation to that expected under the Hardy Weinberg equilibrium in the case of natural populations. A similar trend (GD=0.300; heterozygosity=0.230) was also observed by de Albuquerque et al. (2018). The high allelic richness coupled with estimates of gene diversity suggests a moderate to high genetic diversity among  the  cassava landraces. With SNPs, diversity values are generally low, and this could be explained by the bi-allelic nature, hence, the maximum gene diversity for a SNP marker is 0.5. In addition, cassava is allogamous and there is the possibility of identifying several alleles per locus.
 
According to several reports, to get the same level of information as SSRs for genetic diversity studies, a larger number of SNPs (7 to 11 times or more as compared to SSRs) must be used (Filippi et al., 2015). It is therefore important that the number and selection of SNPs, as well as the use of a large panel of accessions is considered to prevent bias and enhance the accuracy of diversity studies (Emmanuelli et al., 2013). However, Kawuki et al. (2009) have also reported that the number of SNPs required for a diversity studies is also dependent on the nature of the genetic resources. Hence, the more diverse the genetic resources, the fewer the markers required. In this study, 187 polymorphic SNPs were able to detect the genetic diversity in the cassava landraces which suggests that the number of SNPs used is within a suitable range. This suggests that the cassava landraces are diverse, and it supports the assertion by Kawuki et al. (2009). A similar trend was observed by Oliveira et al. (2014) who used 402 polymorphic SNPs to assess 1280 cassava accessions (Table 3).
 
Analysis of molecular variance (AMOVA)
 
AMOVA based on the SNP marker data suggests higher within group variation which accounted for 99% of the total variation compared with variation between groups which accounted for only 1% of the total variation (Table 4). The results suggest that there is a higher genetic diversity within population than as seen between populations. This result is similar to studies by Pedri et al. (2019) where analysis of molecular variance revealed a within group variation of 92%.
 
Principal coordinates analysis (PCoA)
 
The principal coordinates analysis generated is graphically presented in Figure 1. The coordinates were calculated for axes 2 and 3 with positive eigen values. The two axes accounted for 50.81% of the total variation with the second axis (PCoA2) accounting for 22.16% and third axis (PCoA3) accounting for 28.65%. The PCoA showed loose  clustering and  cassava  landraces  were dispersed in all four quadrants. However, those which clustered together could suggest that they share some common alleles. The PCA analyses, however, showed a similar result to the clustering supporting the presence of four populations.
 
 
Cluster analysis
 
The dendrogram was constructed using Nei's genetic distance (1973) and this separated the 105 cassava landraces into three main Clusters (I, II and III) and five distinct sub-clusters (Figure 2). Clustering did not reflect the zones from which these landraces were collected and subsequently no duplicates were found. Cluster I composed of landraces from the coastal savanna zone while all other landraces from the rain forest, deciduous forest and transition grouped across the other two Clusters (II and III).
 
Grouping of landraces from different agro-ecological zones across the different clusters could be attributed to the high frequency of germpalsm exchange among farmers. Within cluster II, three sub-clusters (A, B and C) were formed, while two sub-clusters (D and E) were formed in cluster III. Sub-cluster size varied from four to 65. The largest sub-clusters, C and D had 33% each of the cassava landraces, while sub-clusters A and E had 6% each and sub-cluster B had 22%. Cluster analysis with the SNP markers was useful in revealing three distinct groups which  may  have  diverse  morphological, agronomical, physiological and molecular characteristics that may provide valuable genetic resources. This may enable breeders select diverse parents for targeted crosses to develop superior progenies.


 CONCLUSION

This study concluded that 187 out of 195 SNP markers were highly informative and polymorphic to distinguish among the cassava landraces. These SNPs could therefore be used for future genetic diversity studies in cassava. In addition, SNP markers were able to separate the landraces into different clusters. However, they were not grouped in accordance to their geographical origin. Furthermore, this study has confirmed that fewer SNPs could be used to assess the genetic diversity if the genetic resources are diverse. The cassava landraces used for this study showed moderate to high genetic diversity, suggesting the availability of useful and unique alleles for desirable traits that could be exploited for breeding purposes. Inclusion of such landraces in cassava improvement activities would enhance the development of end-user varieties that will be easily adopted by farmers and other stakeholders along the value chain. The information generated will contribute significantly to manage conserved germplasm, develop core collections from which parental lines could be selected to improve existing cultivars.


 CONFLICT OF INTERESTS

The authors have not declared any conflict of interests.


 ACKNOWLEDGEMENTS

The authors appreciate the Generation Challenge Program (GCP) for the financial support and staff of the CSIR-Crops Research Institute for their technical support.


 REFERENCES

Adjebeng-Danquah J, Manu-Aduening J, Asante IK, Agyare RY, Gracen V, Offei SK (2020). Genetic diversity and population structure analysis of Ghanaian and exotic cassava accessions using simple sequence repeat (SSR) markers. Heliyon 6(1):e03154.
Crossref


Benesi IRM, Labuschagne MT, Herselman L, Mahungu N (2010). Ethnobotany, morphology and genotyping of cassava germplasm from Malawi. Journal of Biological Sciences 10:616-623.
Crossref


Bostein D, White RL (1980). Construction of a genetic map in man using restriction fragment polymorphism. American Journal of Human Genetics 32(3):314-331.


Ching A, Caldwell KS, Jung M, Dolan M, Smith OS, Tingey S, Morgante M, Rafalski AJ (2002). SNP frequency, haplotype structure and linkage disequilibrium in elite maize inbred lines. BioMed Central Genetics 3:19.
Crossref


de Albuquerque HYG, Carmo CD, Brito AC, de Oliveira EJ (2018). Genetic diversity of Manihot esculenta Crantz germplasm based on single nucleotide polymorphism markers. Annals of Applied Biology 2018:1-14.


Egnin M, Mora A, Prakash CS (1998). Factors enhancing Agrobacterium tumefaciens mediated gene transfer in peanut (Arachis Hypoges L.). In vitro cellular and Developmental Biology Plants 34:310-318.
Crossref


Emmanuelli F, Lorenzi S, Grzeskowiak L, Catalano V, Stefanini M, Troggio M, Myles S, Martinez-Zapater JM, Zyprian E, Moreira FM, Grando MS (2013). Genetic diversity and population structure assessed by SSR and SNP markers in a large germplasm collection of grape. BMC Plant Biology 2013:13:39.
Crossref


Ferguson ME, Shah T, Kulakow P, Ceballos H (2019). A global overview of cassava genetic diversity. PLoS ONE 14(11):e0224763.
Crossref


Ferguson ME, Hearne SJ, Close TJ, Wanamaker S, Moskal WA, Town CD, de Young J, Marri PR, Rabbi IY, de Villiers EP (2012). Identification, validation and high-throughput genotyping of transcribed gene SNPs in cassava. Theoretical Applied Genetics 124(4):685-695.
Crossref


Filippi CV, Aguirre N, Rivas JG, Zubrzycki J, Puebla A, Cordes D, Moreno MV, Fusari CM, Alvarez D, Heinz RA (2015). Population structure and genetic diversity characterization of a sunflower association mapping population using SSR and SNP markers. BMC Plant Biology 15:52.
Crossref


Gonçalves TM, Vidigal F, Vidigal PS, Ferreira MCG, Rocha RCU, Ortiz VPC, Kvitschal MV (2017). Genetic diversity and population structure of traditional sweet cassava accessions from Southern of Minas Gerais State, Brazil, using microsatellite markers. African Journal of Biotechnology 16:346-358.
Crossref


Kamanda I, Blay ET, Asante IK, Danquah A, Ifie BE, Parkes E, Kulakow P, Rabbi I, Conteh A, Kamara JS, Mensah HK, Whyte JBA, Sesay S (2020). Genetic diversity of provitamin-A cassava (Manihot esculenta Crantz) in Sierra Leone. Genetic Resources and Crop Evolution 67:1193-1208.
Crossref


Karim KY, Ifie B, Dzidzienyo D, Danquah EY, Blay ET, Whyte JBA, Kulakow P, Rabbi I, Parkes E, Omoigui L, Norman PE, Iluebbey P (2020). Genetic characterization of cassava (Manihot esculenta Crantz) genotypes using agro-morphological and single nucleotide polymorphism markers. Journal of Physiology and Molecular Biology of Plants 26(2):317-330.
Crossref


Kawuki RS, Ferguson M, Labuschagne M, Herselman L, Kim DJ (2009). Identification, characterization and application of single nucleotide polymorphisms for diversity assessment in cassava (Manihot esculenta Crantz). Molecular Breeding 9:9264-9280.


Liu K, Muse SV (2005). PowerMarker: Integrated analysis environment for genetic marker data. Bioinformatics 21(9):2128-2129.
Crossref


Lopez C, Piegu B, Cooke R, Delseny M, Tohme J, Verdier V (2005). Using cDNA and genomic sequences as tools to develop SNP strategies in cassava (Manihot esculent Crantz). Theoretical and Applied Genetics 110:425-431.
Crossref


Mtunguja MK, Ranjan A, Laswai HS, Muzanila Y, Ndunguru J, Sinha NR (2017). Genetic diversity of farmer-preferred cassava landraces in Tanzania based on morphological descriptors and single nucleotide polymorphisms. Plant Genetic Resources 15:138-146.
Crossref


Mtunguja MK, Laswai HS, Muzanila YC Ndunguru J (2014). Farmer's knowledge on selection and conservation of cassava (Manihot esculenta) genetic resources in Tanzania. Journal of Biology Agriculture and Healthcare 4:120-129.


Nei M (1973). Analysis of gene diversity in subdivided populations. Proceedings of the National Academy of Sciences USA 70:3321-3323.
Crossref


Oliveira EJ, De Ferreira CF, Santos VS, Jesus ON, Oliveira GAF, Silva MS Da. (2014). Potential of SNP markers for the characterization of Brazilian cassava germplasm. Theoretical and Applied Genetics 127:1423-1440.
Crossref


Parkinson J, Blaxter M (2009). Expressed sequence tags: An overview. Methods Molecular Biology 533:1‐12.
Crossref


Peakall R, Smouse PE (2006). GENALEX 6: genetic analysis in excel. Population genetic software for teaching and research. Molecular Ecology Notes 6:288-295.
Crossref


Pedri ECM, Hoogerheide ESS, Tiago AV, Cardoso ES, Pinto JMA, Santos LL, Yamashita OM, Rossi AAB (2019). Genetic diversity of cassava landraces cultivated in northern Mato Grosso State, Brazil, using microsatellite markers. Genetics and Molecular Research 18(3):gmr18315.
Crossref


Rabbi I, Hamblin M, Gedil M, Kulakow P, Ferguson M, Ikpan AS (2014). Genetic mapping using genotyping-by-sequencing in the clonally propagated cassava. Crop Science 54(4):1384-1396.
Crossref


Rabbi IY, Kulembeka HP, Masumba E, Marri PR, Ferguson M (2012). An EST-derived SNP and SSR genetic linkage map of cassava (Manihot esculenta Crantz). Theoretical and Applied Genetics 125:329-342.
Crossref


Ren J, Sun D, Chen L, You FM, Wang J, Peng Y, Nevo E, Sun D, Luo MC, Peng J (2013). Genetic diversity revealed by single nucleotide polymorphism markers in a worldwide germplasm collection of durum wheat. International Journal of Molecular Sciences 14:7061-7088.
Crossref


Rimoldi F, Vidigal-Filho PS, Kvitschal MV, Goncalves‑Vidigal, MC, Prioli AJ, Prioli SM, Costa TR (2010). Genetic divergence in sweet cassava cultivars using morphological agronomic traits and RAPD molecular markers. Brazilian Archives of Biology and Technology 53:1477-1486.
Crossref


Singh N, Choudhury DR, Singh AK, Kumar S, Srinivasan K, Tyagi RK, Singh NK, Singh R (2013). Comparison of SSR and SNP markers in estimation of genetic diversity and population structure of Indian rice varieties. PLoS ONE 8:e84136.
Crossref


Tamura K, Dudley J, Nei M, Kumar S (2007). MEGA4: Molecular evolutionary genetics analysis (MEGA) software version 4.0. Molecular Biology and Evolution 24:1596-1599.
Crossref


Tiago AV, Rossi AAB, Tiago PV, Carpejani AA, Silva BM, Hoogerheide ESS, Yamashita OM (2016). Genetic diversity in cassava landraces grown on farms in Alta Floresta-MT, Brazil A.V. Genetics and Molecular Research 15(3):1-10.
Crossref


Tumuhimbise T, Shanahan P, Melis R, Kawuki R (2014). Combining ability analysis of storage root yield and related traits in cassava at the seedling evaluation stage of breeding. Journal of Crop Improvement 28(4):530-546.
Crossref


Turyagyenda LF, Kizito EB, Ferguson ME, Baguma Y, Harvey JW, Gibson P, Wanjala BW, Osiru DSO (2012). Genetic diversity among farmer-preferred cassava landraces in Uganda. African Crop Science Journal 20(1):15-30.


Zhu YL, Song QJ, Hyten DL, Tasell CP, Matukumali LK, Grim DR, Hyatt SM, Fickus EW, Young ND, Cregan PB (2003). Single nucleotide polymorphisms in soybean. Genetics 163:1123-1134.


          */?>