Full Length Research Paper

ABSTRACT
Phaseolus vulgaris L. (family Leguminosae), is a leguminous crop widely distributed in all parts of the world. In Ethiopia, common bean is cultivated as a source of protein for local consumption and for export. Mostly, it grows in the warm and lowland areas of the country. The aim of this research was to investigate the genetic diversity of P. vulgaris accessions from Ethiopia. Twelve accessions of P. vulgaris were used to estimate the genetic diversity among and within accessions using inter simple sequence repeat (ISSR) markers. Seven selected ISSR primers yielded 69 reproducible bands from 96 individuals studied. All the loci were found to be polymorphic. The total genetic diversity (H) and Shannon’s diversity information index (I) for the entire accessions showed 0.35 and 0.53, respectively. Individuals from Shinile site showed the highest level of gene diversity (H = 0.29, I = 0.43); while the lowest variability was shown by accessions from Metekel (L) (H = 0.10, I = 0.15). Variation within accessions was higher (62.55%) as compared to that of inter accessions (37.45%) based on AMOVA. In PCoA, majority individuals of Metekel (L) tended to form separate group. The result of the study confirmed the presence of genetic diversity that can be exploited to improve the productivity. This calls for a conserted efforts in the collection, conservation and sustainable use of P. vulgaris.
Key words: Genetic diversity, ISSR, Phaseolus vulgaris
INTRODUCTION
Common bean (Phaseolus vulgaris L.) is a diploid (2n=22) annual leguminous plant that belongs to the genus Phaseolus, and it is characterized by pinnately compound trifoliate leaves. There are about 50 species under the genus Phaseolus (Hedberg and Edwards, 1989). P. vulgaris was derived from wild ancestors distributed from Northern Mexico to Northwestern Argentina (Ibarra-Perez et al., 1997; Debouck, 1999). The ancestors of P. vulgaris appear to have formed two distinct gene pools one in Mesoamerica (Mexico and Central America) and the other in the Southern Andes, a mountain range in South America (Zeven, 1997; Gepts and Bliss, 1988; Blair et al., 2007; Burle et al., 2010). An ancestral wild form is still found at the boundary between temperate and sub-tropical dry climatic regions (Debouck, 1999). They were brought to Europe and Africa during the 16th century by returning Spanish and Portuguese explorers
(Gepts and Debouck, 1991; Ibarra-Perez et al., 1997). Since that time, it has been developed into many different forms through selective breeding by local farmers. About 30% of the current world production comes from Mexico, Central and South America, and significant quantities are grown in Asia and Africa (Ibarra-Perez et al., 1997; Burle et al., 2010). In Ethiopia, common beans are concentrated in the dry and warmer parts of the country mainly along the Rift Valley (for example Alemu Demelash and Bekele Adam, Ethiopia, unpublished paper). They are adapted to the low and mid altitude areas at an altitudunal range of 900-2100 m.a.s.l. Besides, common beans grow in areas with annual rainfall range of 200 to 600 mm (IFPRI, 2010). Common bean is largely a self-pollinated plant though cross pollination is possible (Ibarra-Perez et al., 1997). The seeds are non-endospermic and vary greatly in size and color from the small black wild type to the large white, brown, red and spotted types (Cobley and Steele, 1976). It shows variation in growth habits from determinate bush to indeterminate extreme climbing types. The bushy type is the most predominant bean grown in Africa (Buruchara, 2007). Nutritionally, common bean contains high protein content, a good source of energy and also provides folic acid, dietary fibre and complex carbohydrates (Edje et al., 1980; Sousa and Delgado, 1993; Svetleva et al., 2006). For the poor, it plays a strategic role in alleviating malnutrition and for other health related functions. Even though it is an important crop as a food security, production of the crop is inconsistent due to biotic and abiotic stresses. There was no genetic diversity study on Ethiopian P. vulgaris, particularly using molecular markers. In this study, we assess the genetic diversity of common bean accessions collected from different parts of Ethiopia. Common bean was considered for this research because of its economic importance in the country serving as a cash crop for smallholder farmers. It can be cultivated at times of irregular rainfall and previous reports also indicated that it can grow in the lowlands of Ethiopia where soils are relatively affected by salt (Alemu and Seifu, 2003). The aim of this study was therefore to investigate the genetic diversity of P. vulgaris accessions collected from Ethiopia using ISSR markers on accessions collected from different parts of Ethiopia. This will provide information on the overall genetic variability of P. vulgaris accessions which may assist in the identification and selection of the genetic materials for conservation for different regions of Ethiopia.
MATERIALS AND METHODS
This study was conducted from September 2011 to August 2012 at Addis Ababa University, Ethiopia and the following materials and methods were employed.
Plant materials
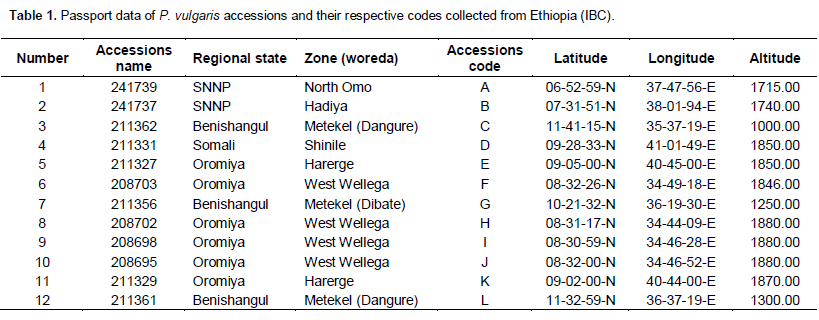
The common bean accessions were obtained from the Institute of Biodiversity and Conservation (IBC), Addis Ababa, Ethiopia. Each of the 12 landrace accessions was represented by eight individuals making the total number 96. The individual samples were sown in the greenhouse to obtain young leaves for DNA extraction. The accessions were collected from different lowland areas of Ethiopia (Table 1 and Figure 1).

DNA extraction
About 300 mg young leaves from each representative plant sample were ground in liquid nitrogen and total template DNA was isolated by using Cetyl Trimethyl Ammonium Bromide (CTAB) method of Borsch et al. (2003) extraction protocol with slight modifications in the extraction fraction.Quality of the DNA was checked by electro-phoresis of the samples on 1% (w/v) agarose gel and staining with ethidium bromide. Then, the template DNA samples were diluted with sterile double distilled water in 1:20 ratio, for PCR amplification.
PCR amplification and electrophoresis
Nineteen ISSR primers (Sigma-Aldrich) were screened using different individuals of common bean accessions, and then seven ISSR primers, 825, 827, 834, 836, 841,866 (Bold), that produced polymorphic and clear band pattern were selected for further study (Table 2 ). DNA amplification was carried out in a total volume of 25 µl reaction mixture containing 2 µl template DNA, 17.07 µl of H2O, 0.2 µl of 100 mM with each dNTPs (Himedia, India), 2.5 µl PCR buffer B (Himedia, India), 2.5 µl of 25 mM MgCl2, 0.5 µl primer (20 pmol/ml) and 0.2 µl of 5 U/ml firepol Taq DNA Polymerase (Solisbiodye, Estonia). Amplification was performed using Techne, Model FTC41H2D Thermal Cycler. ISSR amplication was carried out for a cycle of 5 min at 94°C, followed by 40 cycles of 30 s at 94°C, 1 min at 49/45°C, and 2 min at 72°C and a final cycle of 7 min at 72°C. The amplification products were resolved by electro-phoresis using 1.7% (w/v) agarose gel with 1 X TAE buffer. 10 µl of each amplication product were loaded with 2 µl of 6x loading dye. Gels were stained with ethidium bromide and band detection was performed using a BIO-RAD Gel Doc.

Data scoring and analysis
Each ISSR band was considered as an independent locus and polymorphic bands were scored as present (1) or absent (0) for all the 96 individual samples. Only clearly reproducible bands were scored and differences in band intensity were not considered. Data analysis was conducted using only the polymorphic bands. Analysis of Molecular Variance (AMOVA) was used to calculate variation among and within accessions using Areliquin version 3.01 (Excoffier et al., 2006). NTSYS (Numerical Taxonomy and Multiware Analysis System) - pc version 2.02 (Rohlf, 2000) and Free Tree 0.9.1.50 (Pavlicek et al., 1999) software’s were used to calculate Jaccard’s similarity coefficient. The Unweighted Pair Group Method with Arithmetic mean (UPGMA) (Sneath and Sokal, 1973) was used to evaluate and compare individual samples and accessions, and generates dendrogram using Numerical taxonomy and multivariate analysis system (NTSYS)- pc version 2.02 (Rohlf, 2000). The Neighbor Joining (NJ) method (Saitou and Nei, 1987; Studier and Keppler, 1988) was used to compare individual genotypes and evaluate patterns of genotype clustering using Free Tree 0.9.1.50 Software (Pavlicek et al., 1999). A principal coordinate analysis was performed based on Jaccard (1908) for all individuals and a plot was generated using 3D coordinates.
RESULTS
ISSR primers and their banding patterns
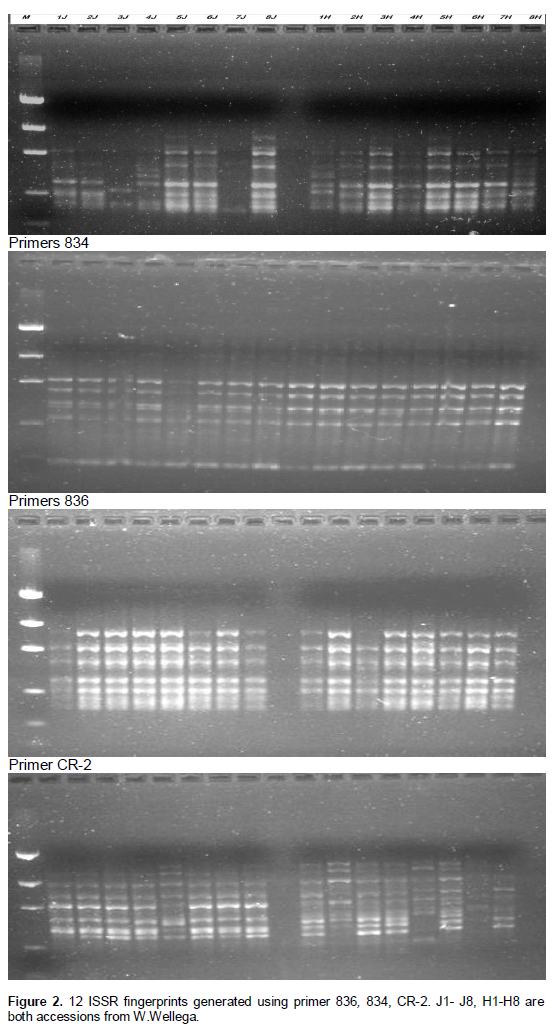
The total number of scored bands varied from six for primer 825 to 13 and 12 for primers 836 and CR-2 respectively (Table 2). The remaining primers, 827,834, 841 and 866, showed eight, 11, ten and nine polymorphic bands, respectively, with a mean of 9.85 bands per primer and the size of the bands ranged from 100 bp to 800 bp. Figure 2 shows the amplification pattern of primer 836. All the primers showed 100% polymorphism. Among the 12 accessions, the highest gene diversity was obtained for Shinile (H = 0.29); while Metekel (L) was the least diverse (H=0.10). In addition, similar values in gene diversity were found for North Omo (H = 0.28) and Metekel (C) (H = 0.26). The overall gene diversity for the total accession was 0.35 (Table 3). Relatively, similar gene diversity patterns were also observed in Shannon Diversity Index (I) (Table 3).

Analysis of molecular variance (AMOVA)
Analysis of molecular variance on 12 accessions (without grouping samples by region or geographic location) revealed that highest percentage of variation is attributed to variation within accessions (62.55%) (Table 4). Variation among accession accounted for the 37.45% of total variation. Generally, the result of AMOVA revealed patterns of genetic diversity and it supports the larger genetic diversity found within the accessions but low genetic diversity was found among accessions (Table 5).


Cluster analysis
NJ tree showed that there were three major distinct clusters and two subclusters within the third major cluster (Figure 3). In some cases, individuals from each accession tended to form their own cluster; while few individuals from each accession were distributed all over the tree. Among the twelve accessions, Metekel (L) (major cluster I), North Omo (A) (major cluster II) and Harerge (E) (major cluster III, sub-cluster I) showed a relatively clear grouping UPGMA based analysis resulting in the separation of the twelve common bean accessions into two main clusters. Accession from Harerge (K) was an outlier whereas, the rest 11 accessions together grouped into clusters II (Figure 4). Jaccard similarity coefficient based pair wise comparisons showed that Harerge (E) and West Wellega (F) have a similarity coefficient value of 0.53; whereas Harerge (K) with accessions of Hadiya, Shinile and West Wellega (F) showed a distant relation with similarity coefficient of 0.28, 0.29 and 0.29, respectively (Table 6).


Moreover, individual based UPGMA clustering of an overall analysis showed a strong clustering of individuals with respect to their accessions, like the two individuals of Metekel (G and L), where as some individuals of Hadiya(B) were intermixed with Harerge (E) (Figure 5). This result is similar to that of individual based NJ analysis.

Principal coordinate analysis (PCoA)
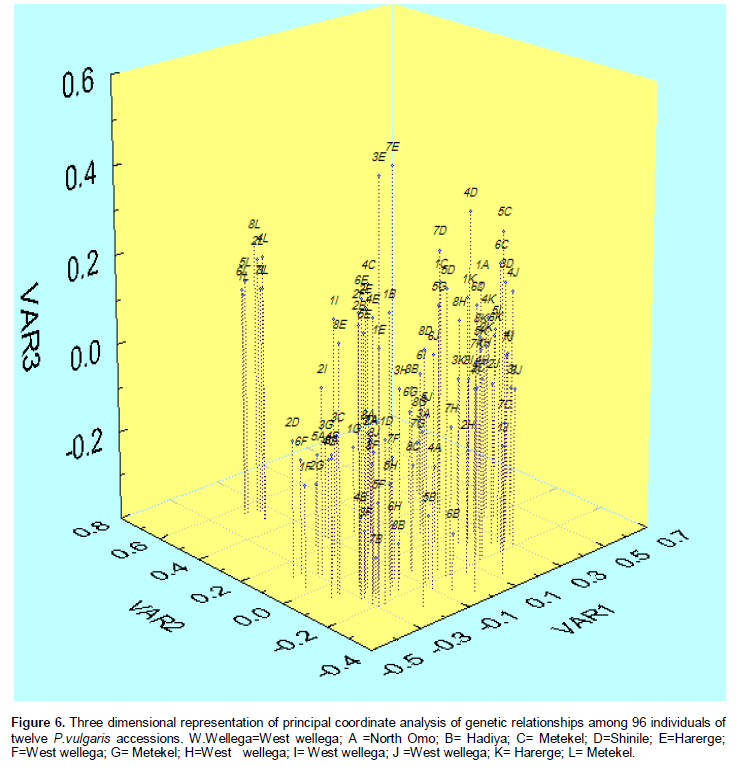
The first three coordinates of the PCoA having Eigen values of 4.95, 3.41 and 2.25 with a variance of 12.22, 8.41 and 5.56%, respectively, were used to reveal the grouping of individuals (Figure 6). Most individuals from Metekel (L) tended to form their own grouping. The remaining individuals from each accession did not show a clear assembly rather they were inter-mixed with each other. Moreover, mixed individuals did not show separate group within each other (Figure 6).
DISCUSSION
In this study, all the diversity parameters verify that there is medium to high gene diversity in accessions of P. vulgaris. Accessions from Shinile, North Omo, Metekel (C) and West Wellega (H) having 0.29, 0.28, 0.26 and 0.24 gene diversity, respectively, were indeed high. Similarly, the result from Shannon diversity index illustrates that individuals from Shinile were the most diverse (I=0.43). The overall total Nei’s gene diversity and Shanon’s diversity index were high, 0.35 and 0.53, respectively. This result is in agreement with data obtained from the study of other bean species from tropical, subtropical or warm temperate regions that have been recently studied with ISSR markers, such as Vicia faba (Abdel-Razzak et al., 2012), and Dalbergia cochinchinensis (Hien and Phong, 2012). Our result is also in line with the reports of Sadeghi and Cheghamirza (2012) that accessions of P. vulgaris showed high genetic diversity using ISSR markers.
AMOVA showed that there is higher genetic variation within accessions (62.55%) than among accessions (37.45%). Cruz et al. (2004), studing wild accessions of P.vulgaris L. from Mexico using ISSR markers, reported similar results, 55 to 60% and 40 to 45% of genetic diversity, within and among accession, respectively. A number of reasons may contribute for the high levels of genetic diversity within accessions. These could be high seed exchange among community, human activities during harvesting and marketing and presence of large accession size. Hence, these may lead to the intermixing of accessions. In general, in breeding species with more or less continuously distributed accessions, the proportion of internal variation is often above 70%; while below 30% is attributed to inter accession difference (Hamrick et al., 1992).
The UPGMA analysis showed that each accession formed a discrete cluster based on accessions from nearby localities, for example, Shinile and Harerge (E), accessions from Metekel (G, L) and the two accessions from West Wellega (H, J). This clustering may be formed becausof seed movement between the areas because of geographical and cultural factors. On the otherhand, accessions from different localities may tend to form their own clustering like Hadiya and W.Wellega (F). This indicates that there may be massive seed movements in distant geographical areas. This movement is associated with response to recurrent drought donation by relief agencies such as NGOs and governmental organizations as well as during marketing. The separation and formation of a cluster between accessions may suggest that accessions may have been isolated from each other for a longer period in time and as a result there was limited gene flow due to long distance. Genetic variability is useful for heterotic patterns in hybrid breeding and for relating the observed pattern with presence of certain economically important traits. Such information can be used to design effective germplasm conservation and for setting germ-plasm collection task as well as to guess or predict the risk of genetic erosion in certain areas. So, understanding the genetic diversity of P.vulgaris will be valuable for further crop improvement through breeding programs and for taking appropriate conservation efforts.
PCoA analysis showed similar result to UPGMA except most individuals from Metekel (L) tended to form their own grouping. The remaining individuals from each accession did not show a clear assembly rather they were intermixed with each other. The reason for these inter mixing could be explained by gene flow from one area to the other due to various factors, for example marketing.
Conclusion
The present study shows that the existence of wide range of genetic diversity in common bean accessions of Ethiopia which mostly resides within accessions, and this indicated that different regions harbor high levels of diversity. This is an important landmark both for improvement and conservation programs. Although, the study was based on a limited number of markers, this obser-vation should be taken in to account in planning future conservation and research programs of the species. Furthermore, the wider molecular variability observed represents a good indication for breeding programs. This is an encouraging result for further collection activities so as to capture more variability from other agroecologies of the country. The current common bean collection in the Ethiopian gene bank contains predominantly samples from South, East and West parts of the country. Thus, it would be useful to increase representative samples from Northern parts of the country to capture the maximum diversity. Furthermore, the present study showed accessions from Shinile and North Omo sites exhibited higher genetic diversity than accessions from Harerge (E). These areas may have a conducive environment for better adaptation of the plant.
CONFLICT OF INTERESTS
The author(s) have not declared any conflict of interests.
ACKNOWLEDGEMENTS
The authors acknowledge the Institute of Biodiversity Conservation, Addis Ababa, Ethiopia, for providing the P. vulgaris germplasm used in this study. The authors also thank Dr. Kassahun Tesfaye for his comments during the research work.
REFERENCES
|
Abdel-Razzak HS, Alfrmawy AM, Ibrahim HM, El-Hanafy A (2012). Genetic diversity in faba bean (Vicia faba L.). Using inter-simple sequence repeat (ISSR) markers and protein analysis. J. Life Sci. 9(2):497-503. |
|
|
Alemu D, Seifu D (2003). Haricot bean marketing and export performance: Constraints and opportunities. Research Report, No. 54. Ethiopian Agricultural Research Organization. |
|
|
Blair MW, Diaz JM, Hidalgo R, Diaz LM, Duque MC (2007). Microsatellite characterization of Andean races of common bean (Phaseolus vulgaris L.). Theor. Appl. Genet. 116: 29-43 |
|
|
Borsch T, Hilu K, Quandt D, Wilde V, Neinhuis C, Barthlottm W (2003). Non coding plastid trnT-trnF sequences reveal a well resolved phylogeny of basal angiosperms. Evol. Biol. 16:558-576. |
|
|
Burle ML, Fonseca JR, Kami JA, Gepts P (2010) Microsatellite diversity and genetic structure among common bean (Phaseolus vulgaris L.) landraces in Brazil, a secondary center of diversity. Theor. Appl. Genet.121: 801-813 |
|
|
Buruchara R (2007). Background information on Common Beans (Phaseolus vulgaris L.) in Biotechnology, Breeding and Seed Systems for African Crops. |
|
|
Cobley LS, Steele WM (1976). An Introduction to the Botany of Tropical Crops. Longman Group Limited, London. |
|
|
Cruz P, Gepts P, Colunga P, Marin G, Villareal DZ (2004). Spatial distribution of genetic diversity in wild populations of P. vulgaris L. from Guanajuato and Michoacan, Mexico. Genetic Resources and Crop Evol, 01:1-11. |
|
|
Debouck D (1999). Diversity in Phaseolus species in relation to common bean. In: Common Bean Improvement in the Twenty-First Century. (Singh, S.P., ed.). Kluwer Academic Publishers, Dordrech. pp. 25-52. |
|
|
Edje OT, Mughogho LK, Rao YP, Msuku WA (1980). Bean Production in Malawi. In Potential for Field Beans in Eastern Africa. Proceedings of a Regional Workshop Help in Lilongwe, Malawi. pp. 9-14. |
|
|
Excoffier L (2006). An Integrated Software Package for Population Genetics Data Analysis. Computational and Molecular population Genetics Lab. (MPG), Institute of Zoology, University of Bern, Switzerland. |
|
|
Gepts P, Bliss FA (1988). Dissemination pathways of common bean (Phaseolus vulgaris) deduced from phaseolin electrophoretic variability II. Europe and Africa. Econ. Bot. 42:86-104. |
|
|
Gepts P, Debouck DG (1991). Origin, domestication and evolution of the common bean, Phaseolus vulgaris. In: Common Beans: Research for Crop Improvement 2nd Edn.(Voysest, O. and Schoonhoven, A.V. eds). CAB, Oxford, UK. pp. 7-53. |
|
|
Hamrick JL, Godt MJ, Sherman-Broyles SL (1992). Factors influencing levels of genetic diversity in woody plant species. New Forests. 6:95-124. |
|
|
Hien VT, Phong DT (2012). Genetic diversity among endangered rare Dalbergia cochinchinensis (Fabaceae) genotypes in Vietnam revealed by random amplified polymorphic DNA (RAPD) and Inter Simple Sequence Repeats (ISSR) markers Vietnam. Afr. J. Biotechnol. 11(35):8632-8644. |
|
|
Ibarra-Perez F, Ehdaie B, Waines G (1997). Estimation of out crossing rate in common bean. Crop Sci. 37:60-65. |
|
|
IFPRI (2010). Pulses value chain in Ethiopia, constraints and opportunities for exchangingexports, working paper, International Food Policy Research Institute, Washington.| July 2010 |
|
|
Jaccard (1908). Nouvelles researchers Sur la distribution florale. Bull. Soc. Vaud. Sci. Nat. 44:223-270. |
|
|
Pavlicek A, Hrda S, Flegr J (1999). Free-tree-freeware program for construction of phylogenetic trees on the basis of distance data and bootstrap/jackknife analysis of the tree robustness, application in the RAPD analysis of genus. Frenkelia. Folia Biol. 45: 97-99. |
|
|
Powell W, Machray GC, Provan J (1996). Polymorphism revealed by simple sequence repeats. Tren. Plant Sci. 1:215-222. |
|
|
Rohlf FJ (2000). NTSYS-pc ver 2.11T. Exter Software, Setauket, New York. |
|
|
Sadeghi A, Cheghamirza K (2012). Efficiency of RAPD and ISSR marker systems for studying genetic diversity in common bean (P. vulgaris L.) cultivars. Annals of Biol. Research. 7:3267-3273. |
|
|
Saitou N, Nei M (1987). The neighbor-joining method: a new method for reconstructing phylogenetic trees. Mol. Biol. Evol. 4: 406-425. |
|
|
Sneath PH, Sokal RR (1973). Numerical Taxonomy. Freeman, Sanfrancisco.USA. |
|
|
Sousa SM, Delgado A (1993). Mexican Leguminosae: phytogeography, endemism and origins. In: Biological Diversity of Mexico. (Ramamoorthy T P, Bye R A, Lot J. eds). Oxford University Press, New York. pp. 459-511. |
|
|
Stat soft. Inc. (2001). Statistica data analysis system, Statistica software. |
|
|
Studier JA, Keppler KL (1988). A note on the neighbor-joining algorithm of Saitou and Nei. Mol. Biol. Evol., 5:729-731. |
|
|
Svetleva D, Pereira G, Carlier J, Cabrita L, Leitao J, Genchev D (2006). Molecular characterization of Phaseolus vulgaris L. genotypes included in Bulgarian collection by ISSR and AFLPTM analyses. Sci. Hortic., 109:198-206 |
|
|
Yeh FC, Yang RC, Boyle TJ, Ye Z, Mao JX (1999). POPGENE, the User Friendly Shareware for Population Genetics Analysis, Version 1.3.1. Molecular Biotechnology Center, University of Aleberta, Canada. |
|
|
Zeven AC (1997). The introduction of the common bean (Phaseolus vulgaris L.) into Western Europe and the phenotypic variation of dry beans collected in The Netherlands in 1946. Euphytica. 94:319-328. |
|
Copyright © 2024 Author(s) retain the copyright of this article.
This article is published under the terms of the Creative Commons Attribution License 4.0


