Full Length Research Paper

ABSTRACT
Ethanol is commercially produced by fermenting agricultural products that contain high sugar or starch contents. In this study, the juices of Opilia amentacea and Curcubita pepo were used to produce bioethanol. A mixture of Urea (CON2H4), monosodium glutamate (C5H8NNaO4), potassium dihydrogen phosphate (KH2PO4), and magnesium sulfate heptahydrate (MgSO4.7H2O) is used to promote batch ethanol production with four strains of Saccharomyces cerevisiae as the fermenting organisms. The results obtained have shown that the nutrients mixture significantly affected kinetic parameters and enhanced bioethanol production. Subsequently, the highest outputs of 60.72 ± 0.68 and 50.93 ± 1.61 g ethanol/kg were obtained respectively with O. amentacea and C. pepo. In the same time, 460.97 ± 8.66 g ethanol/kg were got as maximum output from sucrose (NG).
Key words: Fruit juices, enrichment, Saccharomyces cerevisiae, fermentation, bioethanol.
INTRODUCTION
Growing environmental concerns and increasing petroleum products prices have recently stimulated interest in optimazing fermentation processes for large-scale production of alternative fuels such as bioethanol (Wyman, 2001). The yeast “Saccharomyces cerevisiae” is the major industrial ethanol producer, because it is generally acknowledged as a safe microorganism that can produce ethanol by fermentation up to 20% (v/v) from carbon sources (Cot et al., 2007). Typically, ethanol fermentation is carried out under Normal Gravity (NG) technology, which is defined as the preparation and fermentation of mashes containing 20-24% of dissolved solids (Thomas et al., 1996).
Ethanol can be produced from many different raw materials such as corn grain (in USA), sugarcane (in Brazil), tapioca and molasses (in Thailand) (Khongsay et al., 2010). In Togo, ethanol is commonly produced in artisanal way by using palm wine, corn, sorghum or millet as raw materials for local beer brewing. Ethanol is also produced in industrial scale with sugarcane molasses and cassava chips at Anié (Togo) by a Chinese company called “Sinto’’. The Actual challenge is to use less agricultural value products/residues or wastes which are not competing with common food production.
Therefore more interest are devoted to ethanol production by developing and implementing advanced process technologies (Mielenz, 2001). Thus, wild fruits from different plants with potentially higher level of sugars can be used as an alternative low-cost feedstock (Mazmanci, 2011).
In this study, bioethanol production from two types of local fruits (Opilia amentacea and Curcubita pepo) is compared to sucrose fermentation using four strains of S. cerevisiae. The cells growth and effects on main fermentation kinetic parameters were investigated.
MATERIALS AND METHODS
Microorganism and inoculum preparation
Four strains of S. cerevisiae were used as fermentative yeasts. The first strain of S. cerevisiae called “Safelevure’’ (noted S1) is generally used in bakery and in the artisanal production of local beers in Togo. The three other ones (noted S2, S3 and S4) obtained from “Ryan Wu” Company, are the first new biotec-hnology products in China which has been widely used in the production of drinking alcohol, dehydrated alcohol and fuel ethanol. 1.00 g of each strain of active dry yeast was introduced into 250 mL of a preculture medium which had the following composition (in g/L): Yeast extract, 10.00; Tryptone, 20.00; Glucose (Prolabo ®), 20.00 and NaCl (Prolabo®), 9.00. After homogenization, the liquid mixture is incubated at the room temperature (30-32°C) with continuous stirring using a magnetic stirrer. After 24 h of incubation, the active cells were then harvested and used as inoculum for ethanol production (EP) (Novidzro et al., 2013).
Raw materials
O. amentacea (Opiliaceae) and C. pepo (Curcubitaceae) fruits were harvested in June 2010 in Agou-Akplolo forests, located on the foot of Mount Agou in Togo. The juices were extracted with distilled water and autoclaved at 121°C during 15 min to prevent conta-mination as well as to enhance their sugar concentration (Mazmanci, 2011). Then the samples were centrifuged and filtered. Filtrates were kept at -23°C against bacterial contaminations until their use for reducing sugars analysis and alcoholic fermentation.
Ethanol production media
O. amentacea and C. pepo fruit juices containing total soluble solids of 20°Bx supplemented with/without a mixture of four nutrients were used as EP media. Referring to the literature, four nutrients were mixed in following proportions (Al-Obaidi et al., 1987; Acourene and Tama, 2001; Novidzro et al., 2013) and used as additional supplements to study their effects on EP with the mashes. Their contents in the fermentation broth were (g/L): Urea (CON2H4), 2.00; Monosodium Glutamate (C5H8NNaO4), 1.00; Potassium Dihydrogen Phosphate (KH2PO4), 0.25 and Magnesium sulfate heptahydrate (MgSO4.7H2O), 0.25. A comparison is made with sucrose syrup in the same conditions.
The pHs of the mashes were adjusted then in 4.5 ± 0.2. The EP media were transferred into a capped plastic flask of 1000 mL with a final working volume of 250 mL and then autoclaved at 121°C for 15 min to prevent the final mixtures against contamination. The sterilized mashes were used as fermentation media after cooling down (Novidzro et al., 2013).
Fermentation conditions
Each inoculum, prepared previously, was introduced into 10 % (v/v) of each EP medium so that the concentration of viable cells at the beginning of the fermentation must be equal to 2.8 × 10⁶ viable cells/mL 106 viable cells/mL. After a step of pre fermentation during 12 h, the 90% of the staying mashes were added to each pre fermented EP medium. The fermentation was operated in batch mode and performed in a shaker at 100 rpm (Khongsay et al., 2010) in the laboratory at room temperature of 30 ± 2°C for 10-15 days. Data were expressed as the mean of four experiments. Samples were taken at appropriate time intervals for tests.
Analytical methods
The fruits juices have been characterized to determine chemical groups present in the mesocarps of the fruits such as polyphenols, via the reaction with ferric chloride (Rafael et al., 2005), and flavonoïds via the reaction “with cyanidine” (Brock et al., 2006; Konkon et al., 2008).
The cell numbers in the fermentation broth were determined by direct counting method with methylene blue staining on Motic/B1 Series/System Microscopes instrument using Malassez hemacyto-meter, while the total soluble solids (TSS) were determined by Fabre Mesurelec hand-held refractometer ((RAM 0-80% 106), respectively as described by Khongsay et al. (2010). The pH was measured by pH-meter (CRISON/PH 25).
The fermentation broth was centrifuged at 13,000 rpm for 10 min (Laopaiboon et al., 2008). The supernatant was then determined for the total residual sugars by phenol sulfuric acid method (Mecozzi, 2005) and the reading absorbance was 490 nm, using a calibration curve produced with glucose in DMS 300 UV VISIBLE Spectro-photometer. The reducing sugars were determined by Bertrand Method and sucrose in fruit juices by the following formula (Acourene and Tama, 2001):
[Sucrose] = ([Total Sugars] – [Reducing Sugars]) × 0.95 (1)
Percentage of total sugars consumption rate (SCR: %) was calculated as the ratio of the consumed mass of total sugars to the initial mass of total sugars (Laopaiboon et al., 2008). Ethanol concentration was analyzed by high-performing liquid chromate-graphy (using Chrompack pump; Chromapack/RI Detector; Merck/D-2500/Chromato-Integrator and C18 (25 cm x 4.6 mm) column. The volumetric ethanol productivity (Qp: g/L/h) and the percentage of conversion or yield efficiency (Ey:%) were calculated by the following equations (Khongsay et al., 2010):

where, P (g/L) is the final ethanol concentration produced, t (h) the fermentation time giving the highest ethanol concentration during batch fermentation on EP media under NG conditions and 0.54 the maximum theoretical ethanol of sucrose consumption.
The ethanol yield (Yp/s: g/g) is calculated by the following formula (Swain et al., 2007):

Statistical analysis was carried out via Turkey test by one-way and two-way ANOVA using MSTATC.EXE software. All the experiments were performed in four times and the results were expressed as mean ± standard deviation (SD) of the four experiments.
RESULTS AND DISCUSSION
The fruits juices biochemical composition
The characteristics of raw juices extracted from 1000 g of each fruit are shown on Table 1. To extract juices of identical initial concentration of 20.0 ± 0.1 Bx, the volume of water used varied from one fruit to another. O. amentacea juice appeared on Table 1, as the richest substratum in total sugars, with a concentration of 122.7 ± 2.3 g/L corresponding to a quantity of total sugars of 147.2 ± 2.8 g/kg of fruit while the juice of C. pepo could be distinguished like the weakest in total sugar, with its concentration of 101.1 ± 2.4 g/L in total sugars, equivalent to a quantity of 111.2 ± 2.6 g/kg of fruit. The quantities of total sugars in the fruit juices were low by comparison to sucrose syrup (230 g/L) with the same initial concentration of 20.0 ± 0.1°Bx.

With a concentration of 114.1 ± 2.7 g/L, or a quantity of 136.9 ± 3.2 g/kg of fruit, O. amentacea was also the fruit which had the most elevated content in reducing sugars. The one of C. pepo was only of 56.9 ± 3.0 g/L, or a quantity of 62.6 ± 3.3 g/kg of fruit. But, about the sucrose content, C. pepo was the best, with a concentration of 42.0 ± 0.6 g/L, or a quantity of 46.2 ± 0.7 g/kg of fruit, against a concentration of 8.2 ± 0.4 g/L and quantity of 8.2 ± 0.4 g/kg of fruit, for O. amentacea. Probably, with these contents in sugars presented in this study, O. amentacea would be the most favorable substratum to the alcohol production. Therefore, the same total soluble solids does not mean the same reducing sugar contents of which different juices should be stated.
The pHs of the fruit juices were 5.35 ± 0.08 and 3.25 ± 0.06, respectively for C. pepo and O. amentacea. These values could contribute to a better conservation of juices, then for good alcohol production. Indeed, it had been proven that, in fermentation broth, an acidic pH allowed to avoiding contaminations or the bad reactions, due to the presence of other micro-organisms, such as the bacteria (Ban et al., 1988).
The two phytochemical tests revealed that O. amentacea juice contained more phenolic compounds (Polyphenols and flavonoïds) in relation to the one of C. pepo. However, phenolic compounds were considered as poisons to yeasts growth, so they could have negative impacts for alcohol production (Almeida et al., 2007).
Evolutions of brix and yeasts population during fermentation period
The curves of Figures 1 and 2 showed the profiles of Brix and the number of the living and dead yeast cells variations, during the fruit juices fermentation. After the inoculation, there is a continuous dropping of the Brix for each strain. However, the dropping of the Brix show three phases: a lag phase at the beginning, followed by an acceleration phase, and then finishing by the deceleration phase. It is known that the Brix reduction is favorable to ethanol pro-duction under anaerobic conditions.


Simultaneously, a slow rhythm increase of the living cells number was observed as the fermentation begun. This was followed respectively by an acceleration phase, an exponential growth phase and finally, by a decline phase, characterized by a rapid decrease in viable cell numbers. These developments are in accordance with works achieved by Aiba et al. (1973). On the other hand, the presence of dead cells happened before a very quick intensified phase. Microbial growth in juices reveals four phases namely lag, exponential, stationary, and death phases. During lag phase, cells got progressively accustomed to the new environment and were growing (there is no increase in cell numbers). Exponential phase was the period when cell numbers increases rapidly. When the growth and death rates of cells were approximately equal, the cells entered the stationary phase. Finally, when the living environment of cells comes to accumulate toxic wastes and to face the lack of nutrients, these eventually results in death of the cells (Fugelsang and Edwards, 2007).
With enrichment of the media by nutrients mixture, the Brix reduction became important, and the cellular growth also rose significantly. Whatever the strain used in the non-enriched media, the reduction of Brix was slow and weak, and the cellular growth always remained lower when compared to enrich experiment case. At the end of fruit juice fermentation, it is noteworthy that number of the dead cells in C. pepo experiment was higher than viable cells. The inverse phenomenon was observed for O. amentacea.
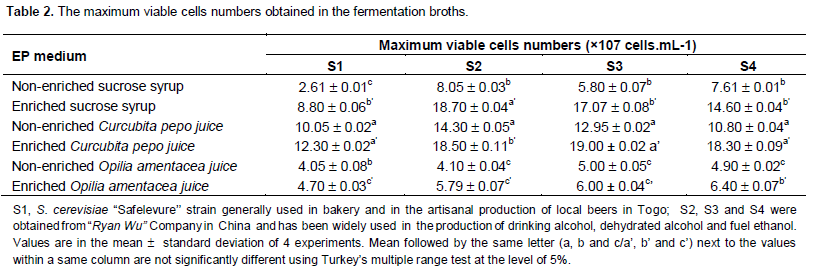
The maximum viable cell numbers during the fermentation
The yeasts proliferation varied from one medium to another (Table 2). The values of the maximal viable cells number of every strain were significantly different (P ≤ 5.0%) in the enriched media as well as in the non-enriched media. Among the three different media investigated, C. pepo juice showed the best yeasts cells growth. So, the maximal viable cells number is obtained in the non-enriched medium with S2 (14.30 ± 0.05 × 1070.02 × 107/mL cells). But O. amentacea juice is the medium in which yeasts cells growth was the poorest.

Sugars consumption
The sugar consumption rate (SCR: %) were respectively 79-89 and 76-87% (Table 2) in the enriched and non-enriched sucrose medium, depending on yeast strains. However, total sugars utilization in the fruit juices was relatively low. Only 49-59 and 53-63% of total sugars are used in C. pepo and O. amentacea non enriched juices, respectively.
When the juices were enriched, these values were improved up 73 to 89% and 63 to78%, respectively (Tables 3 and 4). All the obtained results showed that the enrichment of the medium provokes an increase of the sugar consumption rates.
Approximately 11-37% of initial total sugars content still remained at the end of enriched juices fermentation. Complete sugar utilization may be achieved by optimizing aeration rate, agitation, and other nutrients supplementation, as already evoked by Laopaiboon et al. (2008).
Fermentation time
Fermentation times were very low in enriched media, unlike those of non-enriched media. S1, S2, and S3 gave the same fermentation times which were always lower than those of S4. Moreover, the fermentation times were identical in sucrose and C. pepo media. Comparatively, O. amentacea juices media showed high fermentation times. Possibly, the intensity of inhibitory substances in O. amentacea juice might slow down significantly the fermentation process. The cells growth (Figures 1 and 2) could support this possibility.
Final ethanol concentration (Pexp) produced
The final Pexp values from sucrose media are two or three times higher than those of fruit juices. The maximum Pexp values with enriching approach are 50.60 ± 0.57 g/L (equivalent to 60.72 ± 0.68 g ethanol/kg of fruit) for O. amentacea fruits using S4 (Table 5) and 46.3 ± 1.46 g/L (equivalent to 50.93 ± 1.61 ethanol/kg) for C. pepo fruits using S3 (Table 4). The maximum Pexp value with sucrose medium enriched were 105.97 ± 1.99 g/L (equivalent to 460.97 ± 8.66 g ethanol/kg sucrose NG), reached with S2. From Tables 3, 4 and 5, it can be deduced that ethanol production with O. amentacea juice was slightly better than that with C. pepo. In addition, ethanol produced using S2, S3 and S4 gave better Pexp values relatively to those obtained with S1. It is known that high sugar consumption can lead to a good ethanol production (Khongsay et al., 2012 and Khongsay et al., 2010). So, the weak sugars quantity and the presence of poisonous substances such as phenolic compounds in fruit juices (Almeida et al., 2007), might likely have impacts on the outputs of ethanol production. Therefore, a preliminary detoxification process could contribute to the improvement of ethanol production from these kinds of raw materials (Mazmanci, 2011). Unfermentable carbon source’s existence in the juices might also explain why the ethanol yields were low in the juices.


Ethanol productivity (Qp: g/L/h)
With sucrose, the best productivity (Qp) obtained was 2.208 ± 0.041 g/L/h with S2, and the lowest one was 1.456 ± 0.048 g/L/h with S4. Without nutrients, the best Qp reached with S2 in sucrose mashes was 0.756 ± 0.018 g/L/h, while the lowest one was 0.624 ± 0.011 g/L/h obtained with S1 (Table 3). For C. pepo enriched juice, the best and the lowest Qp obtained by S3 and S4 were 0.643 ± 0.020 g/L/h and 0.461 ± 0.008 g/L/h, respectively. But in the absence of enriching nutrients, C. pepo juice best productivity was 0.225 ± 0.009 g/L/h with S2 and the lowest is 0.187 ± 0.008 g/L/h by S4 (Table 4). In the case of O. amentacea enriched juices, it was S2 which gave the best productivity of 0.408 ± 0.009 g/L/h and the lowest one of 0.294 ± 0.011 g/L/h was given by S1. Without the enrichment of O. amentacea juices, the best productivity of 0.203 ± 0.009 g/L/h was given by S3, and the lowest one of 0.154 ± 0.006 g/L/h by S4 (Table 5). So, to get high ethanol productivity, the fermentation time must be kept in a short time (Khongsay et al., 2010).
Ethanol yield (Yp/s: g/g) and yield efficiency (Ey: %)
The experimental Yp/s values (0.428 ± 0.008 g/g to 0.527 ± 0.006 g/g) and the Ey: values (79.29 ± 1.40 % to 97.67 ± 1.10 %) (Tables 3 and 4)), in relation to the final sugars consumptions, were slightly lower than what were hypothetically the theoretical predicted. The ethanol concentrations produced were also slightly lower than the calculated theoretical ethanol concentrations. Many factors explained this decrease in the expected results. First, the production of by-products such as organic acids, other alcohols, ketones, etc. was harmful for the good productivity. Secondly, the use of parts of sugars by the yeasts to get energy, useful and compulsorily to their growth was also seen as a source of output loss (Ballerini and Alazard-Toux, 2006). The previous reported Yp/s of cane molasses (Reed, 2002), dried sweet potato chips/flour (Woolfe, 1992), and cassava chips/flour (Balagopalan et al., 1987) were 265 to 272 g ethanol/kg, 280 to 320 g ethanol /kg, and (420 to 450 g ethanol /kg), respectively.
In the present study, the maximum ethanol yields calculated were 41.296 g ethanol /kg for O. amentacea fruits and 36.134 ethanol g/kg for C. pepo fruits. Ameyapoh et al. (2006) produced bioethanol from Manguifera indica L. (Anacardiacea) mash of 6°Bx with four strains of S. cerevisiae (AYS01, AYS02 AYS001 and L2056). They got outputs (g/L ethanol) of 7.83; 6.52; 5.21 and 8.65, respectively. On the other hand, beer production achieved by Dahouenon-Ahoussi et al. (2012) from Sorghum bicolor and Musa acuminata mashes, gave the output of 4.86%Vol, equivalent to approximately 37 g ethanol /L. Our results were better than those obtained by Ameyapoh et al., (2006) and Dahouenon-Ahoussi et al. (2012). However, they were lower than those obtained with Washintonia robusta fruit juice containing 105 g/L of reducing sugars, and which succeeded to a maximal production of ethanol of 25 g/L, equivalent to 71.42 ± 1.4 g of ethanol/kg (Mazmanci, 2011).
The improvement of ethanol production yields by using other different microorganisms such as Zymomonas mobilis (Claassen et al., 1999), Saccharomyces bayanus (Castellar et al., 1998), Saccharomyces pastorianus (Fujii et al., 2001), Kluyveromyces fragilis (Szambelan et al., 2004) or genetically modified microorganisms (Ostergaard et al., 2000), will be investigated in the future.
CONCLUSION
The outputs of bioethanol production obtained in this study were 50.60 ± 0.57 g ethanol/L (equivalent to 60.72 ± 0.68 g ethanol/kg of fruit) and 46.3 ± 1.46 g/L (equivalent to 50.93 ± 1.61 g ethanol/kg of fruit), respectively for O. amentacea and C. pepo. Moreover, all the other fermen-tation kinetic parameters mesured in this study showed clearly that the media supplementation with the mixture of nutrients (urea, monosodium glutamate, potassium dihy-drogen phosphate, and magnesium sulfate heptahydrate) improved significantly the batch ethanol production performances. However, the maximal concentration of ethanol produced with sucrose (105.97 ± 1.99 g/L) was comparatively more elevated. All the results we obtained suggested that S4 is the most suitable strain for ethanol production under normal gravity(NG). The use of these conditions can be very attractive in fuel ethanol production domains.
The use of C. pepo and O. amentacea fruits as alternative carbon sources for ethanol production was proposed. Ethanol production yields for the two fruits were very low. However, as these fruits were abundant and inedible, so their eventual exploitation for bioethanol production could be a source of added value for the local population.
This would decrease the use of edible products for fuel production. But, fruit juices detoxification and supple-mentation with little quantity of sucrose or other nitrogen sources and/or other nutrients as well as other fermen-tation processes should be further investigated to improve and complete sugar consumption under normal gravity and very high gravity conditions.
CONFLICT OF INTERESTS
The author(s) have not declared any conflict of interests.
ACKNOWLEDGEMENTS
The authors are grateful to their co-workers and to Université de Lomé (UL). We thank Mr. Senyo AMEVOR for helping in the reading of the manuscript and Mr. Yao HOUEKOU for his technical support.
REFERENCES
|
Acourene S, Tama M (2001). Utilisation des Dattes de Faible Valeur Marchande (Rebuts de Deglet-Nour, Tinissine et Tantboucht) Comme Substrat pour la Fabrication de la Levure Boulangère. Rev. Energ. Ren. : Production et Valorisation–Biomasse: 1-10. |
|
|
Aiba S, Humphrey AE, Millis F (1973). Biochemical Engineering, 2nd edition, University of Tokyo Press (Tokyo). |
|
|
Almeida J, Modig T, Petersson A, Hähn-Hägerdal B, Lidén G and Gorwa-Grauslund MF (2007). Increased tolerance and conversion of inhibitors in lignocellulosic hydrolysates by Saccharomyces cerevisiae. J. Chem. Technol. Biotechnol. 82(4): 340-349. |
|
|
Al-Obaidi ZS, Aziz GM, Al-Hakkak TS, Al-Hilli MA (1987). Optimization of propagation medium for baker's yeast using date extract and molasses. Determination of the optimum concentration of micro-elements and vitamins. Date Palm J. 5(1): 9:65-78. |
|
|
Ameyapoh Y, Wokpor K, De Souza C,(2006). Identification et sélection de siouches de levures performantes pur la production d'alcool. J. Sci. 6:30-40. |
|
|
Balagopalan C, Padmaja G, Nanda SK, Moorthy SN (1988). Cassava in Food, Feed and Industry, CRC Press Inc., Boca Raton, Florida, USA. 205p. |
|
|
Ballerini D, Alazard-Toux N (2006). Les biocarburants - Etat des lieux, perspectives et enjeux du développement Editions Technip; (IFP Publications): Paris, France. |
|
|
Ban KL, Kouadio KG, Kouadio N, Kamenam A (1988). Valorisation des déchets d'ananas par production d'éthanol. I. A. A, 1243-1248 |
|
|
Brock A, Herzfeld T, Paschke R, Koch M,Drager B (2006). Pharmacognosie, Phytochimie, Plantes médicinales. Phytochemistry 67(18):2050-2057. |
|
|
Castellar MR, Aires-Barros MR, Cabral JM S, Iborra JL (1998). Effect of zeolite addition on ethanol production from glucose by Saccharomyces bayanus. Chem. Technol. Biotechnol. 73:377-384. |
|
|
Claassen PAM, Van Lier JB, Contreras AML, Van Niel EWJ, Sijtsma L, Stams AJM, De Vries SS, Weusthuis RA (1999). Utilization of biomass for the supply of energy carriers. Appl. Microbiol. Biotechnol. 52:741-755. |
|
|
Cot M, Loret M-O, François J, Benbadis L (2007). Physiological behavior of Saccharomyces cerevisiae in aerated fed-batch fermentation for high level production of bioethanol. FEMS Yeast Res. 7:22-32. |
|
|
Dahouenon-Ahoussi E, Degnon RG, Adjou ES, Sohounhloue DCK (2012). Stabilisation de la bière produite à partir de matières amylacées locales (Sorghum bicolor et Musa acuminata) par adjonction de l'huile essentielle de Cymbopogon citratus. J. Appl. Biosci. 51:3596-3607. |
|
|
Fugelsang KC, Edwards CG (2007). Wine Microbiology, Practical Applications and Procedures (2nd Ed.). XX, 394p. |
|
|
Fujii N, Oki T, Sakurai A, Suye S, Sakakibara M (2001). Ethanol production from starch by immobilized Aspergillus awamori and Saccharomyces pastorianus using cellulose carriers. Ind. Microbiol. Biotechnol. 27:52-57. |
|
|
Khongsay N, Laopaiboon L, Laopaiboon P (2010). Growth and batch ethanol fermentation of Saccharomyces cerevisiae on sweet sorghum stem juice under normal and very high gravity conditions. Biotechnology 9(1):9-16. |
|
|
Khongsay N, Laopaiboon L, Jaisil P, Laopaiboon P (2012). Optimization of agitation and aeration for very high gravity ethanol fermentation from sweet sorghum juice by Saccharomyces cerevisiae using an orthogonal array design. Energies 5:561-576. |
|
|
Konkon NG, Adjoungoua AL, Manda P, Simaga D, N'Guessan KE, Kone BD (2008). Toxicological and phytochemical screening study of Mitragyna Inermis (willd.) O ktze Rubiaceae), antidiabetic plant. J. Med. Plant. Res. 2(10):279-284. |
|
|
Laopaiboon L, Nuanpeng L, Srinophakun P, Klanrit P, Laopaiboon P (2008). Selection of Saccharmyces cerevisiae and Investigation of Performance for Very High Gravity Ethanol Fermentation. Biotechnology 7 (3):493-498. |
|
|
Mazmanci MA (2011). Ethanol production from Washingtonia robusta fruits by using commercial yeast. Afr. J. Biotechnol. 10 (1):48-53. |
|
|
Mecozzi M (2005). Estimation of total carbohydrate amount in environmental samples by the phenol sulphuric acid method assisted by multivariate calibration. Chemometr. Intell. Lab. Syst. 79:84-90. |
|
|
Mielenz JR (2001). Ethanol production from biomass technology and commercialization status. Curr. Opin. Biotechnol. 4:324-324. |
|
|
Novidzro KM, Agbodan KA, Koumaglo KH (2013). Study of the performance of four strains of Saccharomyces cerevisiae on ethanol production with sucrose enriched musts. J. Soc. Ouest Afr. Chim. (2013) 035:1-7. |
|
|
Ostergaard S, Olsson L, Nielsen J (2000). Metabolic engineering of Saccharomyces cerevisiae. Microbiol. Mol. Biol. Rev. 64 (1): 34-50. |
|
|
Rafael F, Elena C, Marcedes DRC (2005). Pharmacognosie, Phytochimie, Plantes médicinales. Phytochemistry 66: 175-185. |
|
|
Reed G (2002). Production of fermentation alcohol as a fuel source, in fifth ed. Reprinted by CBS Publishers, New Delhi. P. & D. Ind. Microbiol. pp. 835-860. |
|
|
Swain MR, Kar S, Sahoo AK, Ray RC (2007). Ethanol fermentation of Mahula (Madhuca latifolia L.) flowers using free and immobilized yeast Saccharomyces cerevisiae. Microbiol. Res. 162: 93-98. |
|
|
Szambelan K, Nowak J and Czarnecki Z (2004). Use of Zymomonas mobilis and Saccharomyces cerevisiae mixed with Kluyveromyces fragilis for improved ethanol production from Jerusalem artichoke tubers. Biotechnol. Lett. 26: 845-848. |
|
|
Thomas KC, Hynes SH and Ingledew WM (1996). Practical and theoretical considerations in the production of high concentrations of alcohol by fermentation. Process Biochem., 31: 321-331. |
|
|
Woolfe JA (1992). Sweet potato, an Untapped Food Resource. Cambridge University Press, New York. |
|
|
Wyman CE (2001). Twenty years of trials, tribulations, and research progress in bioethanol technology: selected key events along the way. Appl. Biochem. Biotechnol. 91-93:5-21. |
|
Copyright © 2024 Author(s) retain the copyright of this article.
This article is published under the terms of the Creative Commons Attribution License 4.0


