Full Length Research Paper

ABSTRACT
Codon usage bias plays an important role in the regulation of gene expression. A couple of measures are widely used to quantify the codon usage in genes. On the other hand, no quantitative endeavour has been made to compare the pattern of codon usage diversity within and between different genes of Camellia sinensis and Brassica campestris. Nucleotide composition and its relationship with codon usage bias were analyzed. Additionally, the rare codons were identified by computing the recurrence of event of all codons in coding sequences of C. sinensis and B. campestris. The host cell, Escherichia coli used universally, failed to express smoothly many eukaryotic genes. For this, the authors prognosticated the codons showing the highest and the lowest expressivity of the coding sequences of C. sinensis and B. campestris, in E. coli K12 strain to improve the expression level of the genes.
Key words: Codon usage bias, gene expressivity, codon usage pattern, residual value, synonymous codon.
INTRODUCTION
Gene expression is a fundamental cellular process by which proteins are synthesized in a cell based on the information encoded in the genes. Most amino acids can be encoded by more than one codon; such codons are depicted as being synonymous, and mostly vary by one nucleotide in the third position. Synonymous codons are not used uniformly, varies across species and within genome in the same species, the phenomenon is called codon usage bias (CUB) (Akashi, 1994; Behura and Severson, 2013). Molecular evolutionary investigations on codon bias suggest that recurrence of codon use changes between genes from the same genome and also between genomes (Hooper and Berg, 2000). Highly expressed genes are more biased in terms of their codon usage as compared to low expressed genes, and provide differential efficiency as well as accuracy in the translation of genes (Rocha, 2004; Hershberg and Petrov, 2008). The selection associated with translational efficiency/ accuracy is often termed as ‘translation selection’. During the last two decades, numerous lines of evidence suggested that codon usage bias is driven by selection, particularly for species of fungi (Bennetzen and Hall, 1982; Ikemura, 1985), bacteria (Ikemura, 1981; Sharp and Li, 1987a) and insects (Akashi, 1997; Moriyama and Powell, 1997).
Soon, after the discovery of whole genome sequencing technology, codon usage bias was analysed for numerous organisms (Plotkin and Kudla, 2011). Numerous factors have been shown to influence codon usage bias: (i) genomic composition (Supek and Vlahovicek, 2005); (ii) selective forces (Ikemura, 1985); and (iii) horizontal gene transfer, with transferred genes retaining the codon frequencies of their former host (Lawrence and Ochman, 1998). Connections have also been demonstrated between codon usage and several factors namely: (a) gene length (Lawrence and Ochman, 1998); (b) gene translation initiation signal (Ma et al., 2002); (c) expression level (Gouy and Gautier, 1982; Sharp and Li, 1986; Sharp et al., 1986; Sharp and Li, 1987b); (d) protein amino acid composition (Lobry and Gautier, 1994); (e) protein structure (D'Onofrio et al., 2002); (f) tRNA abundance (Ikemura, 1981, 1982); (g) mutation frequency and patterns (Sueoka, 1999); and (h) GC composition (Sueoka and Kawanishi, 2000). Besides, the relative impact of each of these factors varies from genome to genome, and from gene to gene. Despite the fact that there is still no final result on the formation mechanism, codon bias has been widely used to predict the exogenous and endogenous gene expression level (Lee et al., 2007; Yu et al., 2007; Zheng et al., 2007), identify horizontally transferred genes (Goldman et al., 2007), evolutionary relationship (Ram et al., 2007), and confirm the coding sequences. Researchers proposed that in some prokaryotes, many indices exhibit a positive correlation with the gene expression level, such as codon adaptation index (CAI) (Sharp and Li, 1987b), codon bias index (CBI) (Bennetzen and Hall, 1982), and frequency of optimal codons (Kanaya et al., 2001). Then again, in a few eukaryotes there is no confirmation to bolster this, particularly for higher eukaryotes where, the correlation between codon bias and expression level is extremely weak (Murray et al., 1989; Kanaya et al., 2001).
In this study, we investigated the codon usage bias (CUB) for Camellia sinensis and Brassica campestris by analyzing the codon adaptation index (CAI), relative codon usage bias (RCBS), effective number of codons (ENc), synonymous codon usage order (SCUO), and GC/AT content at each codon position. The purpose of this study was to perform a comparative analysis of codon usage bias and codon contexts pattern among the coding sequences (cds) of C. sinensis and B. campestris.
Escherichia coli cells were, as often as possible, utilized as host cells as a part of the investigation of exogenous protein expression. Many eukaryotic genes cannot be efficiently expressed in a prokaryote like E. coli. One of the effective methods for improving the expression level of a eukaryotic gene in a prokaryote is to replace the usage of ‘rare codons’ with synonymous codons showing highest expressivity in prokaryotes. While replacing the rare codons, the stability of genes at genomic or transcriptional level should be taken into consideration. Here, a novel computational method to identify the codons of C. sinensis and B. campestris was introduced exhibiting the highest and lowest expressivity in E. coli k12 strain.
MATERIALS AND METHODS
The complete coding sequences of the thirty genes from C. sinensis and forty seven genes from B. campestris were retrieved from the National Centre of Biotechnology (NCBI) nucleotide database accessible from the website www.ncbi.nlm.nih.gov. Each of those cds were devoid of any unknown base (N), intercalary stop codon and possessed the start and stop codons.
Relative codon usage bias and codon adaptation index were used to study the overall codon usage variation among the genes. RCBS is the overall score of a gene indicating the influence of RCB of each codon in a gene. RCB reflects the level of gene expression. RCBS was calculated as by Roymondal et al. (2009). Gene expressivity was again measured by calculating the codon adaptation index as per Sharp and Li (1986). It essentially measures the distance from a given gene to a reference gene with respect to their amino-acid codon usages. CAI defines translational optimal codons as those that appear frequently in highly expressed genes that is:

Where, L is the length of gene g and wc (l) is the relative adaptiveness of the codon c in the reference genes (not g).
Certain codons will appear multiple times in the gene. Hence we can rewrite the equation to sum up codons rather than length, and use counts rather than frequencies. This makes the dependence on the actual gene more clear. The more usual form is:

The effective number of codons (ENc) is the total number of different codons used in a sequence. The values of ENc for standard genetic code range from 20 (where only one codon is used per amino acid) to 61 (where all possible synonymous codons are used with equal frequency). ENc measures bias toward the use of a smaller subset of codons, away from equal use of synonymous codons. For example, as mentioned above, highly expressed genes tend to use fewer codons due to selection. The underlying idea of ENc is similar to the concept of zygosity from population genetics, which refers to the similarity for a gene from two organisms. ENc value was calculated as per Wright (1990). The measure of codon usage, synonymous codon usage orders (SCUO) of genes was computed as per Wan et al. (2004). GC3s is the frequency of (G+C) and A3s, T3s, G3s, and C3s are the distributions of A, T, G and C bases at the third codon position (Gupta and Ghosh, 2001). A series of scripts (programs) were writen in Perl language and run in Windows for analysis. These programs were used to estimate the above mentioned genetic parameters.
The correlations between all the above mentioned parameters were measured with the gene expressivity to find out the genetic factors playing major role in the genes of C. sinensis and B. campestris. All codon quantifications were performed using the Anaconda software (Moura et al. 2007). The residual values of each codon pair were also quantified from the coding sequences of each plant species by the Anaconda program. The occurrence frequency of each codon for a particular amino acid was also calculated and compared with their expressivity values to identify the codons playing a prominent role in determining the level of gene expression.
RESULTS AND DISCUSSION
The present study was carried out to assess the codon usage pattern and gene expressivity for the genes of C. sinensis and B. campestris. In numerous microscopic organisms, intragenomic diversity in codon usage among genes has been reported. The genes selected for the present study from the two plants with their accession numbers together with the overall AT and GC%, RCBS, CAI, ENc, SCUO, GC1, GC2 and GC3 are given in the supplementary file. It was found that the codons of C. sinensis and B. campestris are rich in A and/or T. Yet, on account of Homo sapiens, it has been shown that the codons ending in G and/or C are dominating in the whole coding region.
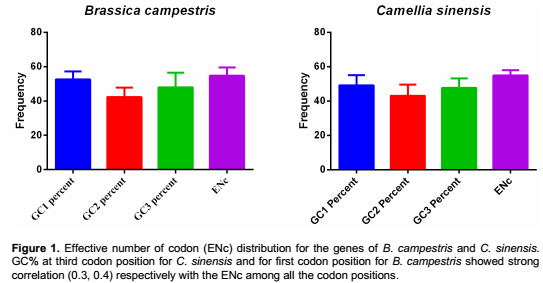
Due to the difference in mutational bias, the GC percentage among different species varies to a great extent, even for the species within the same order. To determine if GC bias among C. sinensis and B. campestris has an association with codon bias, the non-directional codon bias measure effective number of codons (ENc) was resorted to. The effective number of codons used by a gene and GC% at the three different synonymous codon positions (GC1s, GC2s and GC3s) are used to study the codon usage variation among the genes of B. campestris and C. sinensis (Figure 1). To quantify the level of diversity in the synonymous codon usage among all the selected cds within the genome of B. campestris and C. sinensis, the mean distance between the pairs of cds was estimated. The mean distance was found to be 0.07 with a median of 0.06 for C. sinensis and a mean distance of 0.09 with the median of 0.07 for the cds sequence of B. campestris. When focusing on the previously studied genomes (Lafay et al., 2000; Grocock and Sharp, 2002; Wu et al., 2005), the mean values for Bacillus subtilis 168 (0.60), E. coli K12 MG1655 (0.47), Helicobacter pylori 26695 (0.38), and Haemophilus influenzae Rd KW20 (0.37) indicated that the mean values varied widely among species. ENc is a widely accepted measure of codon usage bias that quantifies the degree of deviation from equal use of synonymous codons. It has been suggested that ENc may be dependent on the strength of the codon bias discrepancy (Fuglsang, 2004). The coefficient of determination (denoted as R2) indicates how well the data points fit a straight line or curve. From the analysis, it is apparent that the coefficient of determination is 0.37 and 0.15 for the genes of C. sinensis and B. campestris, respectively (Figure 2). This reveals that 37% of the variation in expressivity for the cds of C. sinensis and 15% for the cds of B. campestris could be explained by the ENc. The remaining percentage of the variation in expressivity could be attributed to unknown factors, that is, genetic variation and/or other external factors.

Synonymous codon usage orders (SCUO) of genes of each species were further analyzed. SCUO is a relatively easier approach as compared to RSCU and is considered as more robust for comparative analysis of codon usage. The SCUO analysis shows that a majority of the genes selected for the present study are associated with high codon usage bias (43% cds in C. sinensis and 68% in B. campestris have SCUO≥0.5). This outcome proposes that these genes are associated with specific functions such as translational processes, ribosomes (mostly ribosomal protein genes), intracellular activities, transport, oxidation-reduction process and others (Supplementary Tables 1 and 2).
The Anaconda software was used to determine the adjusted residual values for association of each codon pair in genome-wide manner for the two plant species. The residual values signify the Chi-square test association between the two codons of each context (Moura et al., 2007). Furthermore, based on the average cluster patterns of adjusted residual values of codon pair frequencies among the C. sinensis and B. campestris, it was found that specific contexts were represented more often than other contexts. The cluster patterns revealed distinctions as well as commonalities of codon context variations between C. sinensis and B. campestris. The codon contexts are localized diagonally from left top to right bottom. Being in the diagonal positions, they represent contexts of the same triplet sequences suggesting that these contexts (homogenous codon contexts) are generally frequent in these plants (Figure 3). The cluster pattern is based on the average matrix of residuals of each codon context among the species of each order. The map constructed for the two plants was, again, compared in one single display to allow detection of overall patterns of codon context. Differential Display Map (DDM) was constructed from the absolute value by subtracting both maps cell-by-cell (Figure 4).


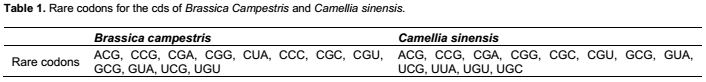
Researchers proposed that codons which are utilized less as often as possible all through the genome are rate limiting factors of exogenous gene expression supported by experimental verification (Garcia et al., 1986; Zhang et al., 2004). In C. sinensis and B. campestris, the ‘rare codon’ was defined by calculating the recurrence of event of all codons (Threshold selected: 10/1000) in coding sequences (Figure 5). In the meantime, our examination demonstrated that many of these rare codon pairs contain termination codons (Table 1). Based on the hypothesis that gene expressivity and codon composition are strongly correlated, the codon adaptation index has been defined to provide an intuitively meaningful measure of the extent of the codon preference in a gene. We have estimated the CAI and RCBS for each cds as a measure of gene expressivity (supplementary material). The CAI with RCBS were compared and it was observed that both showed a similar pattern. In concurrence with different past studies (Ikemura, 1981, 1982; Moriyama and Powell, 1997), it was observed that RCBS decreased with the length of the encoded cds. Since the RCBS value depends on cds length, CAI was used as a central measure for expressivity analysis.

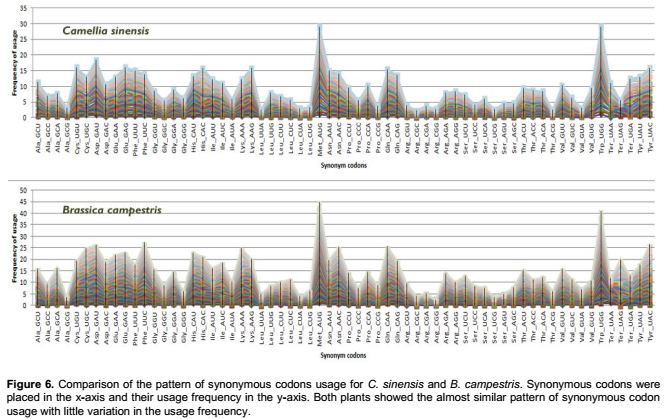
Gene expression studies are essential for predicting the expression potentiality of a particular gene of interest. This will help in the discovery of new coding sequences of genes for most elevated protein expression in a cell so that these man-made proteins can be synthesized and used for therapeutic drives world-wide. Along these lines, it is important to find the codons that dictate the highest and the lowest expressivity of a cds within a particular expression system. The DDM analysis results suggested that both plants showed similar codon context pattern to some extent. For confirmation, the pattern of synonymous codons usage for both plants were compared. In support of our previous study on cereals (Chakraborty and Paul, 2015), both plants selected for the present study also maintained more or less similar pattern of synonymous codon usage (Figure 6). These result indicated that througout the evolution, both plants maintained a precise pattern of codon usage, may be due to the natural selection, mutation or any other external factors. Again, the role of each codon in terms of expressivity within the two plants were analyzed. The occurrence frequency of 59 codons (except stop codons and codons for Met & Trp) were calculated for each cds of C. sinensis and B. campestris and predicted their expression level in E. coli K12 strain. The occurrence frequency for each codon in cds was again allied with their expressivity values. Using the criterion derived from statistical analysis (positive and negative codon bias relating to the gene expression level), the codons showing the highest and lowest expressivity in E. coli k12 we obtained (Table 2). E. coli genome tRNA copy number data sets available in the genomic tRNA database (http://gtrnadb.ucsc.edu/) also support the results of highest and lowest productive codons.

To confirm the results of this analysis, we changed the original cds downloaded from the database to the highest expressive and the lowest expressive cds sequence by replacing the codons with highest and lowest expressive codons, respectively. The expressivity values for all the three sets of a cds sequence (original, highest was lowest cds) was calculated by using codonW. These results revealed that the highest as well as the lowest coding sequences significantly differed in expression level from the original cds downloaded from the NCBI database.
CONCLUSION
A novel method for identification of codons showing the highest and the lowest expressivity was introduced, in view of their recurrence of event. The event recurrence for every codon/cds was again allied with their expressivity values. Using the criterion derived from statistical analysis, the codons showing the highest and the lowest expressivity in E. coli k12 were obtained. The natural codons present in cds were replaced by the predicted codons of this study showing the lowest and the highest expressivity using a Perl program developed by the authors of this study. By comparing the expressivity values of our cds with that of original cds downloaded from NCBI, we have established that our method is a general one, not connected with the adjustments in gene length and overall nucleotide composition, with a little noise in measurements. To design the highest and lowest expressive cds of the genes of C. sinensis and B. campestris in E. coli K12 strain, the restriction sites in the bacterium were not considered.
AVAILABILITY
The coding sequences for both plants are available in the nucleotide database of NCBI. The softwares used, that is, codon W and Anaconda for the present study are freely available, downloaded from (http://codonw.sourceforge.net/) and (http://bioinformatics.ua.pt/software/anaconda/), respectively.
CONFLICTS OF INTERESTS
The authors declare that there is no conflict of interests regarding the publication of this paper.
ACKNOWLEDGEMENTS
The authors are thankful to Assam University, Silchar, Assam, India for providing the necessary facilities in carrying out this research work.
REFERENCES
|
Akashi H (1994). Synonymous codon usage in Drosophila melanogaster: natural selection and translational accuracy. Genetics 136(3):927-935. |
|
|
Akashi H (1997). Codon bias evolution in Drosophila. Population genetics of mutation-selection drift. Gene 205(1-2):269-278. |
|
|
Behura SK, Severson DW (2013). Codon usage bias: causative factors, quantification methods and genome-wide patterns: with emphasis on insect genomes. Biol. Rev. Camb. Philos. Soc. 88(1):49-61. |
|
|
Bennetzen JL, Hall BD (1982). Codon selection in yeast. J. Biol. Chem. 257(6):3026-3031. |
|
|
Chakraborty S, Paul P (2015). Guanine and Cytosine at the Second Codon Position Influence Gene Expression in Cereals. Proc. Natl. Acad. Sci. India B Biol. Sci. 1-11. |
|
|
D'Onofrio G, Ghosh TC, Bernardi G (2002). The base composition of the genes is correlated with the secondary structures of the encoded proteins. Gene 300(1-2):179-187. |
|
|
Fuglsang A (2004). Bioinformatic analysis of the link between gene composition and expressivity in Saccharomyces cerevisiae and Schizosaccharomyces pombe. Antonie Van Leeuwenhoek 86(2):135-147. |
|
|
Garcia GM, Mar PK, Mullin DA, Walker JR, Prather NE (1986). The E. coli dnaY gene encodes an arginine transfer RNA. Cell 45(3):453-459. |
|
|
Goldman B, Bhat S, Shimkets LJ (2007). Genome evolution and the emergence of fruiting body development in Myxococcus xanthus. PLoS One 2(12):e1329. |
|
|
Gouy M, Gautier C (1982). Codon usage in bacteria: correlation with gene expressivity. Nucleic Acids Res. 10(22):7055-7074. |
|
|
Grocock RJ, Sharp PM (2002). Synonymous codon usage in Pseudomonas aeruginosa PA01. Gene 289(1-2):131-139. |
|
|
Gupta SK, Ghosh TC (2001). Gene expressivity is the main factor in dictating the codon usage variation among the genes in Pseudomonas aeruginosa. Gene 273(1):63-70. |
|
|
Hershberg R, Petrov DA (2008). Selection on codon bias. Annu. Rev. Genet. 42:287-299. |
|
|
Hooper SD, Berg OG (2000). Gradients in nucleotide and codon usage along Escherichia coli genes. Nucleic Acids Res. 28(18):3517-3523. |
|
|
Ikemura T (1981). "Correlation between the abundance of Escherichia coli transfer RNAs and the occurrence of the respective codons in its protein genes: a proposal for a synonymous codon choice that is optimal for the E. coli translational system." J. Mol. Biol. 151(3):389-409. |
|
|
Ikemura T (1982). Correlation between the abundance of yeast transfer RNAs and the occurrence of the respective codons in protein genes. Differences in synonymous codon choice patterns of yeast and Escherichia coli with reference to the abundance of isoaccepting transfer RNAs. J. Mol. Biol. 158(4):573-597. |
|
|
Ikemura T (1985). Codon usage and tRNA content in unicellular and multicellular organisms. Mol. Biol. Evol. 2(1):13-34. |
|
|
Kanaya S, Yamada Y, Kinouchi M, Kudo Y, Ikemura T (2001). Codon usage and tRNA genes in eukaryotes: correlation of codon usage diversity with translation efficiency and with CG-dinucleotide usage as assessed by multivariate analysis. J. Mol. Evol. 53(4-5):290-298. |
|
|
Lafay B, Atherton JC, Sharp PM (2000). Absence of translationally selected synonymous codon usage bias in Helicobacter pylori. Microbiology 146(4):851-860. |
|
|
Lawrence JG, Ochman H (1998). Molecular archaeology of the Escherichia coli genome. Proc. Natl. Acad. Sci. USA 95(16):9413-9417. |
|
|
Lee MH, Yang SJ, Kim JW, Lee HS, Kim JW, Park KH (2007). Characterization of a thermostable cyclodextrin glucanotransferase from Pyrococcus furiosus DSM3638. Extremophiles 11(3):537-541. |
|
|
Lobry JR, Gautier C (1994).Hydrophobicity, expressivity and aromaticity are the major trends of amino-acid usage in 999 Escherichia coli chromosome-encoded genes. Nucleic Acids Res. 22(15):3174-3180. |
|
|
Ma J, Campbell A, Karlin S (2002). Correlations between Shine-Dalgarno sequences and gene features such as predicted expression levels and operon structures. J. Bacteriol. 184(20):5733-5745. |
|
|
Moriyama EN, Powell JR (1997). Codon usage bias and tRNA abundance in Drosophila. J. Mol. Evol. 45(5):514-523. |
|
|
Moura G, Pinheiro M, Arrais J, Gomes AC, Carreto L, Freitas A, Oliveira JL, Santos MA (2007). Large scale comparative codon-pair context analysis unveils general rules that fine-tune evolution of mRNA primary structure. PLoS One 2(9):e847. |
|
|
Murray EE, Lotzer J, Eberle M (1989). Codon usage in plant genes. Nucleic Acids Res. 17(2):477-498. |
|
|
Plotkin JB, Kudla G (2011). Synonymous but not the same: the causes and consequences of codon bias. Nat. Rev. Genet. 12(1):32-42. |
|
|
Ram MR, Beena G, Ragunathan P, Malathi R (2007). Analysis of structure, function, and evolutionary origin of the ob gene product-leptin. J. Biomol. Struct. Dyn. 25(2):183-188. |
|
|
Rocha EP (2004). Codon usage bias from tRNA's point of view: redundancy, specialization, and efficient decoding for translation optimization. Genome Res. 14(11):2279-2286. |
|
|
Roymondal U, Das S, Sahoo S (2009). Predicting gene expression level from relative codon usage bias: an application to Escherichia coli genome. DNA Res. 16(1):13-30. |
|
|
Sharp PM, Li WH (1986). An evolutionary perspective on synonymous codon usage in unicellular organisms. J. Mol. Evol. 24(1-2):28-38. |
|
|
Sharp PM, Li WH (1987b). The codon Adaptation Index-a measure of directional synonymous codon usage bias, and its potential applications. Nucleic Acids Res. 15(3):1281-1295. |
|
|
Sharp PM, Li WH (1987a). The rate of synonymous substitution in enterobacterial genes is inversely related to codon usage bias. Mol. Biol. Evol. 4(3):222-230. |
|
|
Sharp PM, Tuohy TM, Mosurski KR (1986). Codon usage in yeast: cluster analysis clearly differentiates highly and lowly expressed genes. Nucleic Acids Res. 14(13):5125-5143. |
|
|
Sueoka N (1999). Two aspects of DNA base composition: G+C content and translation-coupled deviation from intra-strand rule of A = T and G = C. J. Mol. Evol. 49(1):49-62. |
|
|
Sueoka N, Kawanishi Y (2000). DNA G+C content of the third codon position and codon usage biases of human genes. Gene 261(1):53-62. |
|
|
Supek F, Vlahovicek K (2005). Comparison of codon usage measures and their applicability in prediction of microbial gene expressivity. BMC Bioinformatics 6:182. |
|
|
Wan XF, Xu D, Kleinhofs A, Zhou J (2004). Quantitative relationship between synonymous codon usage bias and GC composition across unicellular genomes. BMC Evol. Biol. 4:19. |
|
|
Wright F (1990). The 'effective number of codons' used in a gene. Gene 87(1):23-29. |
|
|
Wu G, Culley DE, Zhang W (2005). Predicted highly expressed genes in the genomes of Streptomyces coelicolor and Streptomyces avermitilis and the implications for their metabolism. Microbiology 151(7):2175-2187. |
|
|
Yu X, Li Z, Xia X, Fang H, Zhou C, Chen H (2007). Expression and purification of ancrod, an anticoagulant drug, in Pichia pastoris. Protein Exp. Purif. 55(2):257-261. |
|
|
Zhang R, Ou HY, Zhang CT (2004). DEG: a database of essential genes. Nucleic Acids Res. 32(Database issue):D271-272. |
|
|
Zheng Y, Zhao WM, Wang H, Zhou YB, Luan Y, Qi M, Cheng YZ, Tang W, Liu J, Yu H, Yu XP (2007). Codon usage bias in Chlamydia trachomatis and the effect of codon modification in the MOMP gene on immune responses to vaccination. Biochem. Cell Biol. 85(2):218-226. |
|
Copyright © 2024 Author(s) retain the copyright of this article.
This article is published under the terms of the Creative Commons Attribution License 4.0


