ABSTRACT
The ever-increasing demand for rice raises the need to increase productivity by using salt tolerant varieties on saline soils. In this study, 12 rice accessions were screened for tolerance to salt at seedling stage using morphological and molecular methods. The study was carried out in a hydroponic system using Hoagland solution. Scoring was done using the modified standard evaluation score (SES) system after 14 days of treatment. Salt tolerance indices were estimated from shoot length, root length and total biomass. For molecular studies, ten Simple Sequence Repeats (SSR) primers linked with salt tolerance Quantitative Trait Loci (QTL) were used. Results showed greater reductions in biomass and shoot growth of susceptible accessions compared to the tolerant ones. The effect of salt stress on root length showed variability among accessions as well as concentrations. UPIA 1, UPIA 2, FARO 52, FARO 61, TOG 5681 and FARO 44 had similar banding patterns with POKALLI (check variety) suggesting that they may contain salt tolerance genes. Of these accessions, only POKALLI and UPIA 2 survived all levels of salt concentration tested and thus got the highest SES score of one. Both accessions also had the highest overall mean salt tolerance indices. In conclusion, based on SES scores, salt tolerance indices and SSR data, POKALLI and UPIA 2 were identified as highly tolerant, FARO61, FARO 52, UPIA 1 and TOG 5980A as tolerant while WITA 12, CG12, TOG1670, TOG 5681 and TOG 5485 were highly susceptible. Such information will be useful in the selection of parents as breeding lines for salt tolerance.
Key words: Rice, seedling stage, hydroponics, salt tolerance index, simple sequence repeats (SSR) primers.
Rice (mainly Oryza sativa L. and Oryza glaberrima Steud.) is one of the most important and universally accepted food crops, providing over 20% of human dietary energy and serving as a staple crop for millions of people globally (Calpe, 2006). Its production is limited by salinity, which has been recognized as the second most widespread soil problem in rice growing countries, after drought (Gregorio et al., 1997). The young seedling and reproductive stages are more vulnerable to salinity stress in contrast to vegetative stage (Singh et al., 2016).
Several agronomic practices like improved field drainage through maintenance of adequate amount of water (2-3 cm height) until early production stage (De Costa et al., 2012), establishment of crop by transplanting (Sirisena et al., 2010) and use of organic fertilizer, are often used to address the issue of salinity. These practices are, however, inefficient, not cost effective, and not affordable for a long-term solution. Hence, the need to explore the tremendous variation in salt tolerance reported to exist within rice species for a long-term solution (Sabouri and Biabani, 2009).
Screening for salt tolerance was previously based on morphological features alone, which are not very reliable since they may be affected by environmental factors. Progress in the breeding for salt tolerance has been made after the discovery of Quantitative Trait Loci (QTL) underlying salinity stress. Islam et al. (2015) used 3 SSR markers (RM3412, RM510 and RM 336) to identify 5 tolerant rice varieties out of the 25. Ali et al. (2014) identified 4 true salt tolerant rice land races out of 33 using both morphological (shoot length, root length and plant biomass) and simple sequence repeats (SSR) markers (RM8046, RM336, RM8094). Searching for DNA markers closely linked to traits related to salt tolerance has become a key objective in most breeding programs and various reports are available (Kanawapee et al., 2012; Dahanayaka et al., 2015; Pires et al., 2015; Krishnamurthy et al., 2016; Sakina et al., 2016; Reddy et al., 2017). However, there is still much to be done considering the increasing number of new rice cultivars and Quantitative Trait Loci yet to be screened (Islam et al., 2015). The present study was undertaken to screen 12 rice varieties for tolerance to salt stress using both morphological and molecular methods.
Twelve (12) varieties of rice (Table 1) obtained from the Africa Rice Centre, Ibadan, Oyo State, Nigeria were screened for tolerance to salinity at the seedling stage. The experiment was carried out in the greenhouse and molecular biology laboratory of the Department of Genetics and Biotechnology, University of Calabar, Calabar, Nigeria.
Morphological studies
The rice seeds were dehusked and surface-sterilized in 70% ethanol for 1 min and in 2.5% commercial bleach solution for 15 min. The seeds were rinsed several times with sterile water and kept in the dark for 48 h for germination. The pre-germinated seeds were transferred to petri dishes containing half-strength liquid Murashige and Skoog (MS) medium (Murashige and Skoog, 1962) and incubated for one week. The 1-week-old seedlings were transferred into falcon tubes containing 50 ml of half- strength modified Hoagland nutrient solution and grown for another one week before salt treatment. The nutrient solution consisted of 5.6 mM NH4NO3, 0.8 mM MgSO4.7H2O, 0.8 mM K2SO4, 0.18 mM FeSO4.7H2O, 0.18 mM Na2EDTA.2H2O, 1.6 mM CaCl2.2H20, 0.8 mM KNO3, 0.023 mM H3BO3, 0.0045 mM MnCl2.4H2O, 0.0003 mM CuSO4.5H2O, 0.0015 mM ZnCl2, 0.0001 mM Na2MoO4.2H2O and 0.4 mM K2HPO4.2H2O. After 1 week of culture, the salt treatment was added as 0, 50, 100 and 150 mM of NaCl to the tubes according to the experimental design. The pH of the solution was maintained between 5.0 and 5.5 throughout the experiment for better nutrient availability (Bhowmik et al., 2009; Ali et al., 2014) and the solutions were replaced every 3 days until data were collected. The experiment was set up as a 12 × 4 factorial, laid out using the completely randomized design (CRD) with 3 replications giving a total of 144 experimental units. Factor 1 was rice accessions with 12 levels while Factor 2 was salt concentration with four levels. Growth conditions in the greenhouse were temperature: 28-30°C, Humidity: 65-70%, Light: Natural light, 12 h light: 12h dark.
Data collection and analysis on morphological parameters
Salt evaluation scores were estimated for each rice accession by scoring the seedlings for visual symptoms of salt injury 14 days after commencement of salt treatment using the modified standard evaluation score system given by Gregorio et al. (1997) (Table 2). The mean performance of each variety across the different salt concentration levels was used. Varieties that survived all the 4 salt concentration levels were rated as highly tolerant and given the lowest score (1) while those that did not survive beyond the first salt level got the highest (7). Data were also collected on shoot length
(cm), root length (cm), and plant biomass (g) for each variety under different salt concentrations and used to estimate salt tolerance indices by dividing the mean value for the three traits under a given salinity level by the mean value for those traits under control (Zeng et al., 2002). Thus:
Salt Tolerance Index (STI) = Mean performance under stress condition/Mean performance under normal condition (1)
Cluster analysis based on salt tolerance indices was used to group the accessions (Islam et al., 2015).
Molecular screening for salinity tolerance
Genomic DNA was extracted from healthy three-week old leaf samples of the 12 rice varieties using the modified Cetyl Trimethyl Ammonium Bromide (CTAB) method of Dellaporta et al. (1983). The extracted DNA was quantified using a nano-spectrophotometer (JenWay, Genova Nano) and diluted to a final concentration of 250 ng/µl. The samples were screened using a total of 10 SSR markers (Table 3) reported by previous workers to be linked with salt tolerance quantitative trait loci (QTL) in other rice cultivars. A 20 μl PCR reaction mixture containing 1 μl of genomic DNA template, 0.1 μl of Taq polymerase, 0.4 μl of 10 mM dNTPs, 0.5 μl of forward primer, 0.5 μl of reverse primer, 2 μl of 10X PCR buffer and 15.5 μl distilled water was prepared. PCR program was maintained as initial denaturation at 95°C for 5 min followed by 35 cycles of: Denaturation for 30 s at 95°C, primer annealing at 53°C for 30 s, primer extension at 72°C for 30 s, and final extension at 72°C for 5 min. 10 µl of amplified PCR products were mixed with 1.5 μl of loading dye, resolved by electrophoresis in 1% agarose gel and stained with ethidium bromide (Islam et al., 2015).
Scoring and analysis of amplified fragments
The well separated amplified DNA fragments were carefully scored on a presence/absence matrix, with 1 representing presence and 0 representing absence. The data were analyzed for polymorphic information content (PIC) and allele frequency using the Microsoft Excel workbook software. In each of the primers tested, rice varieties that had similar banding pattern with Pokkali (standard) was regarded as an indication that such varieties may contain the genes for salt tolerance. Results from both morphological and molecular analyses were taken into consideration in the final classification of tolerant and susceptible accessions.
Effect of different salinity levels on seedling growth
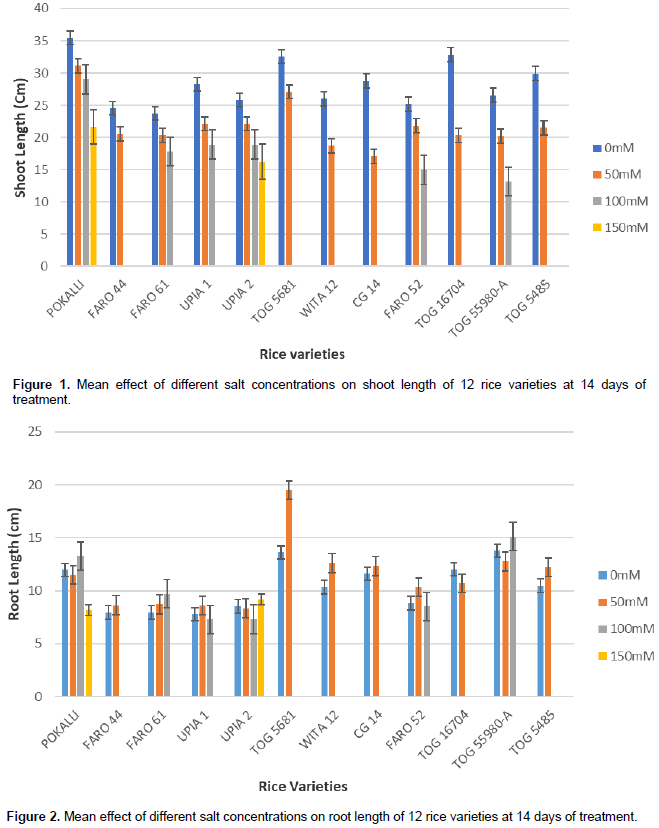
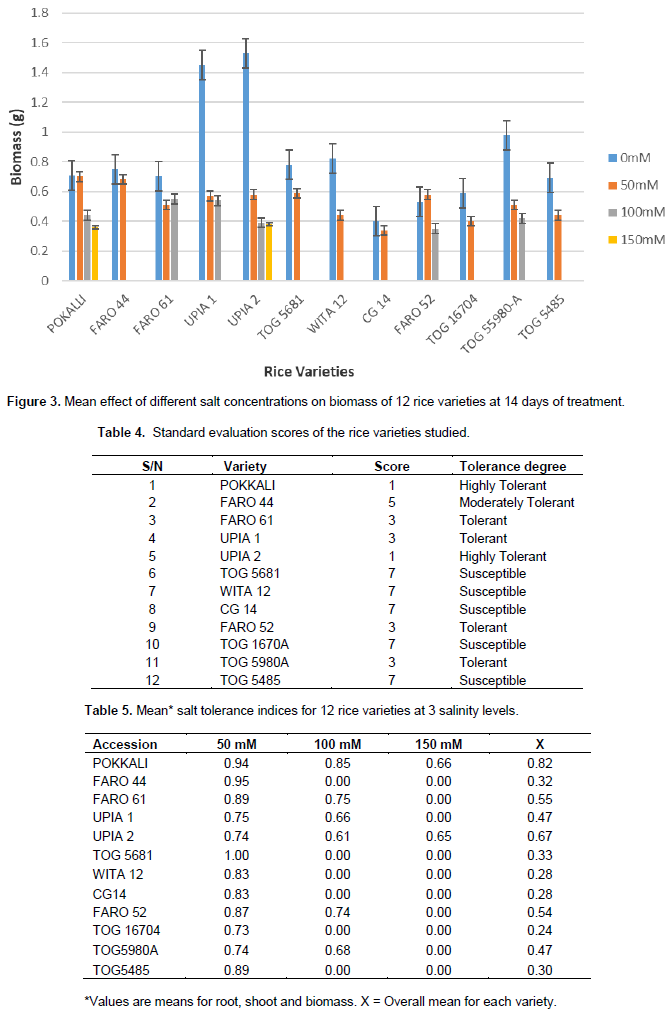
The mean effects of the different salt concentrations on shoot length, root length and biomass for all the twelve rice accessions are as shown in Figures 1 to 3. Generally, shoot length and biomass decreased with increasing salt concentrations in most of the accessions. On the other hand, root length increased with salt concentration in all accessions except for POKALLI, UPIA 1, UPIA 2, FARO 52 TOG 55980-A and TOG 16704 where it showed irregular variations across the salt concentrations. Salt sensitive accessions showed greater reduction in these parameters compared to the tolerant ones (Figures 1 and 3).
Standard evaluation score and salt tolerance indices
Only POKALLI and UPIA 2 survived all levels of salt concentration and thus scored highest with an SES score of 1. This was followed by FARO 61, UPIA 1, FARO 52 and TOG 5980A all of which showed good tolerance but did not survive beyond 100 mM of salt concentration. They earned an SES score of 3. FARO 44 showed moderate tolerance to salt with retarded growth and rolled leaves and thus got a score of 5. TOG 5681, WITA 12, CG 14, TOG 1670A, and TOG 5485 were all observed to be susceptible with most leaves dried up, and thus scored 7 (Table 4).
The mean salt tolerance indices for the twelve (12) rice accessions at the three (3) salinity levels are shown in Table 5. POKALLI and UPIA 2 showed the highest overall mean salt tolerance indices of 0.82 and 0.67, respectively while TOG 16704 showed the least with 0.3.
Cluster analysis
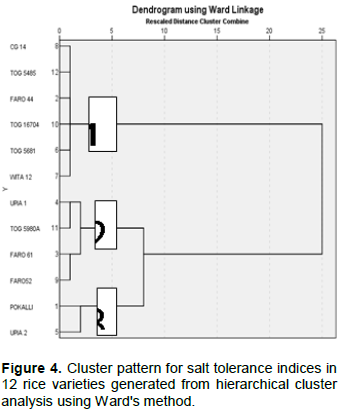
Cluster analysis based on data on salt tolerance indices grouped the rice accessions into 3 clusters (Figure 4). Cluster 1 had the following accessions: CG14, TOG5485, FARO44, TOG16704, TOG5681 and WITA12. Cluster 2 was made up of the following accessions: UPIA1, TOG5980-A, FARO61 and FARO52. Cluster 3 was made up of POKALLI and UPIA2. Members of cluster 1 were highly susceptible to salt conditions; members of cluster 2 were tolerant, while members of cluster 3 were highly tolerant to varying salt conditions.
Molecular studies
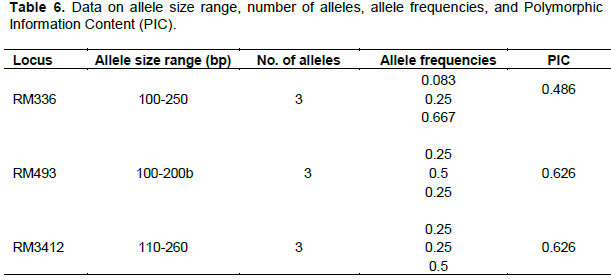
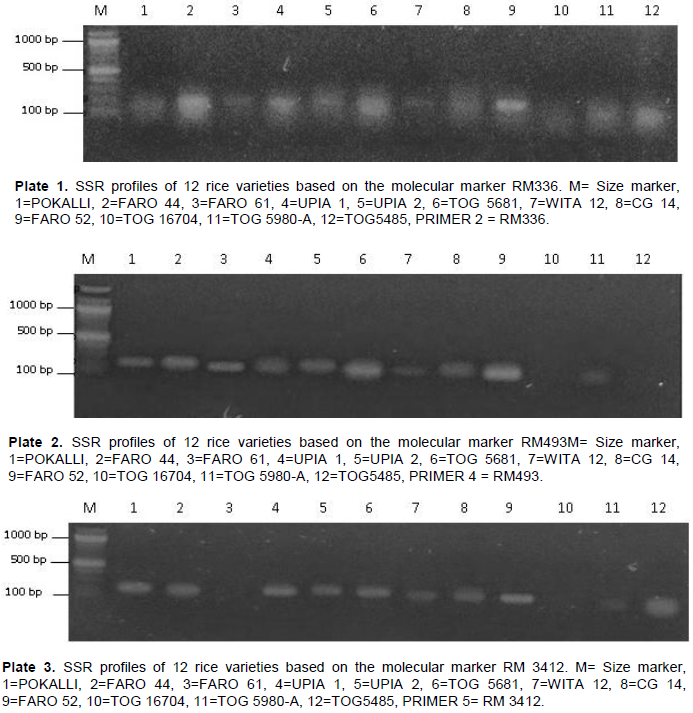
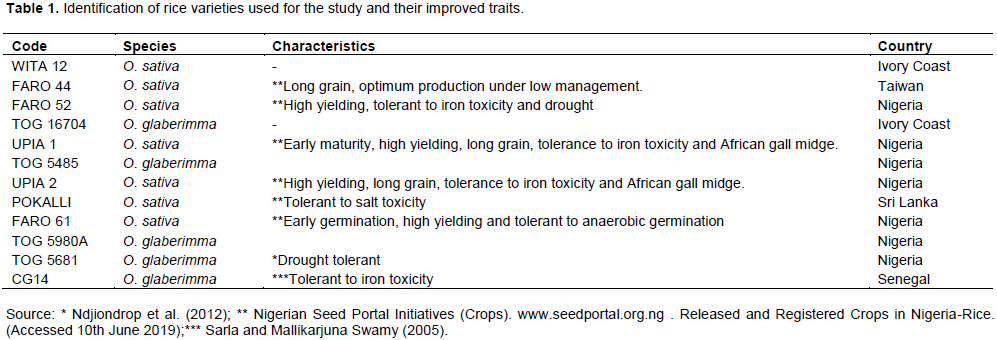
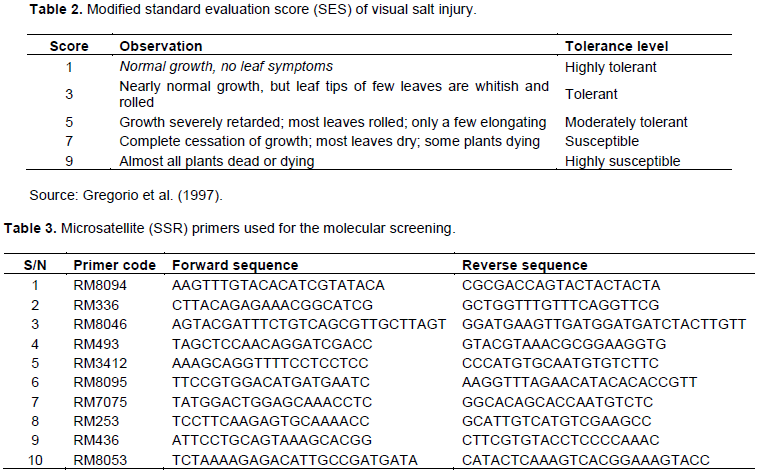
Of the ten (10) SSR markers screened, primers RM336, RM493 and RM3412 which ranged in PIC from 0.486 in primer RM336 to 0.626 in primers RM493 and RM3412 gave the clearest polymorphic band patterns, with amplicon sizes ranging from 80 to 300 bp. For primer RM336, banding patterns similar to POKALLI were observed in UPIA 1, UPIA 2 and FARO 52. Primer RM493 produced similar banding patterns for Pokalli and FARO 44. Similar banding patterns in RM3412 were also observed for POKALLI, FARO 44, FARO 61 and UPIA 2. Amplification profiles as revealed by RM336, RM493, and RM3412 across all 12 accessions used are depicted in Plates 1 to 3. A total of 30 alleles were detected across the three primers used, with 3 alleles per locus, giving 0.333 as the average number of alleles per locus. The allele frequencies produced by different markers per locus ranged from 8.3 to 67% (Table 6).
The capacity to tolerate salinity is a key factor in plant productivity (Momayezi et al., 2009). In the present study, all the rice accessions grew robustly and showed uniform green colour and height in the non-stressed conditions. However, in the presence of salt stress, the accessions showed variation in vigor in terms of morphological traits and growth attributes and their cumulative effect on plant health. Susceptible accessions exhibited varied symptoms of salt injury such as yellowing of leaves, reduction in biomass and shoot growth, and ultimately death of seedlings at vegetative growth stage. Similar results were reported by Mansuri et al. (2012) and Sakina et al. (2016). Generally, salt affects the growth of crop plants by limiting the absorption of water through the root which ultimately affects the metabolic processes of the plant. It has an immediate effect on cell growth and enlargement, and high concentration of salt can be very toxic (Munns and Tester, 2008).
Various plant traits such as shoot and root growth as well as biomass, are reported to be associated with salt tolerance at early growth stage and thus can be used as selection criteria for salt tolerance (Ashraf et al., 1999; Sakina et al., 2016). The present results showed reductions in biomass and shoot growth relative to the controls in all accessions when exposed to salinity stress. It is known that plants, especially those of drought or salt-tolerant species, tend to propagate their roots deeper to absorb more water during osmotic stress (Sakina et al., 2016). This may have been the case in some of the studied accessions. Other root parameters such as root biomass and root surface area could be used along with root length for a better understanding of the effect of salinity on root growth. Indeed, Robin et al., (2016) had reported that reduction in root surface area is a major component of salinity damage in wheat.
Standard evaluation score of visual salt injury is a widely used screening technique for salinity tolerance in rice. In the present study, the rice accessions were classified as highly tolerant (POKALLI and UPIA2), tolerant (FARO61, UPIA1, FARO52 and TOG5980-A), moderately tolerant (FARO44 and TOG5681) and susceptible (TOG16704, CG14, TOG 5485 and WITA12), on the basis of Standard Evaluation score. Analysis based on Salt Tolerance Indices gave similar results except that FARO 44 and TOG 5681 were grouped together with the 4 accessions that were regarded as susceptible, giving only 3 classes (Figure 4). The other 2 groups (Highly Tolerant and Tolerant) retained the same members in both evaluation methods.
The SSR markers used for this study proved to be a viable tool for discriminating between salt tolerant and susceptible varieties. Interestingly, UPIA 2 was consistently associated with POKALLI (tolerant check) in both the morphological and molecular screening techniques, which suggests that UPIA 2 can be considered as a true salt tolerant variety. It also buttresses the findings of the morphological screening in this study which ranked both genotypes as highly tolerant based on the SES scores and salinity indices. In addition, it was observed that 80% of the accessions that had similar banding pattern with POKKALI, namely, UPIA 1, UPIA 2, FARO 52 and FARO 61 showed good degree of tolerance to salt with Standard Evaluation Scores ranging between 1 (Highly tolerant) and 3 (Tolerant), which may indicate some correlation between these methods. Although different screening methods may not always agree completely in cases like these, the differences do not necessarily signify a limitation in screening method but could be due to differences at the molecular level which may not be expressed at the morphological level (Karhu et al., 1996; Roldán-Ruiz et al., 2001) or vice versa. In addition, this variation could be because of variety-environment interaction. Hence, to overcome this problem, the number of molecular markers should be increased reasonably and the morphological traits studied must contain all possible parameters (Ali et al., 2014).
The present study has used Standard Evaluation Score, Salt Tolerance indices and SSR markers to identify UPIA 2 as a true, highly salt tolerant variety. It has also identified UPIA 1, FARO 52, FARO 61 and TOG 5980-A as fairly salt tolerant while TOG 16704, TOG 5485, CG 14 and WITA 12 are highly susceptible. Such information will be useful in the selection of parents as breeding lines for salt tolerance.
The authors are grateful to Bill Gates Foundation for providing an enabling environment in the University of Calabar for the molecular studies and to Africa Rice Center, Ibadan, Oyo State for providing the seeds used for this study.
The authors have not declared any conflict of interests.
REFERENCES
|
Ali N, Yeasmin L, Gantait S, Goswami R, Chakraborty S (2014). Screening of rice landraces for salinity tolerance at seedling stage through morphological and molecular markers. Journal of Physiological and Molecular Biology in Plants 20:411-423.
|
|
|
|
Ashraf MY, Waheed RA, Bhatti AS, Sarwar G, Aslam Z (1999). Salt tolerant potential in different Brassica species, growth studies. In: Halophyte uses different climates. Handy A, Leith H, Todorovic M, Moscheuko, M (II eds). Backhuys Pubs, Leiden, The Netherlands, pp. 119-125.
|
|
|
|
|
Bhowmik SK, Titov S, Islam MM, Siddika A, Sultana S, Haque MDS (2009). Phenotypic and genotypic screening of rice genotypes at seedling stage for salt tolerance. African Journal of Biotechnology 8(23):6490-6494.
|
|
|
|
|
Calpe C (2006). Rice international commodity profile. Food and Agriculture Organization of the United Nations Markets and Trade Division (2006) 23.
|
|
|
|
|
Dahanayaka BA, Gimhani DR, Kottearachchi NS, Samarasighe WLG (2015). Assessment of salinity tolerance and analysis of SSR markers linked with Saltol QTL in Sri Lankan rice (Oryza sativa) genotypes. American Journal of Experimental Agriculture 9(5):1-10.
Crossref
|
|
|
|
|
De Costa WAM, Wijeratne MAD, De Costa DM (2012). Identification of Sri Lanka rice varieties having osmotic and ionic stress tolerance during the first phase of salinity stress. Journal of National Science Foundation of Sri Lanka 40(3):251-280.
Crossref
|
|
|
|
|
Dellaporta SL, Wood J, Hicks JB (1983). A plant DNA mini-preparation: Version II. Plant Molecular Biology Reporter 1:19-21.
Crossref
|
|
|
|
|
Gregorio GB, Senadhira D, Mendoza RD (1997). Screening rice for salinity tolerance. Vol 22. IRRI Discussion Paper Series. International Rice Research Institute.
|
|
|
|
|
Islam MM, Islam SN, Alam MS (2015). Molecular Characterization of Selected Landraces of Rice for Salt Tolerance Using SSR Markers. International Journal of Innovation and Scientific Research 17(1):206-218.
|
|
|
|
|
Kanawapee N, Sanitchon J, Lontom W, Theerakulposut P (2012). Evaluation of salt tolerance at the seedling stage in rice genotypes by growth performance, ion accumulation, proline and chlorophyll content. Plant Soil 358:235-249.
|
|
|
|
|
Karhu A, Hurme P, Karjalainen M, Karvonen P, Kärkkäinen K, Neale D, Savolainen O (1996). Do molecular markers reflect patterns of differentiation in adaptive traits of conifers? Journal of Applied and Theoretical Genetics 93:215-221.
|
|
|
|
|
Krishnamurthy SL, Gautan RK, Sharma PC, Sharma DK (2016). Effect of different salt stress on agro-morphological traits and utilization of salt stress indices for reproductive stage salt tolerance in rice. Field Crops Research 190:26-33.
|
|
|
|
|
Mansuri SM, Jelodar NB, Bagheri N (2012). Evaluation of rice genotypes to salt stress in different growth stages via phenotypic and random amplified polymorphic DNA (RAPD) marker assisted selection. African Journal of Biotechnology 11:9362-9372.
|
|
|
|
|
Momayezi MR, Zaharah AR, Hanafi MM, Mohd-Razi I (2009). Agronomic characteristics and proline accumulation of Iranian rice genotypes at early seedling stage under sodium salt stress. Malaysian Journal of Soil Science 13:59-75.
|
|
|
|
|
Murashige T, Skoog F (1962). A revised medium for rapid growth and Bioassays with tobacco tissue culture. Physiologia plantarum. Wiley Online library.
Crossref
|
|
|
|
|
Munns R, Tester M (2008). Mechanisms of salinity tolerance. Annual Review of Plant Biology 59:651-681.
|
|
|
|
|
Nigerian Seed Portal Initiatives (Crops).
View . Released and Registered Crops in Nigeria-Rice. (Accessed 10th June 2019)
|
|
|
|
|
Pires IS, Negrão S, Oliveria MM, Purugganan MD (2015). Comprehensive phenotypic analysis of rice (Oryza sativa) response to salinity stress. Physiologia Plantarum 155(1):43-54.
Crossref
|
|
|
|
|
Reddy INL, Kim SM, Kim BK, Yoon IS, Kwon TR (2017). Identification of rice accessions associated with K+/Na+ ratio and salt tolerance based on physiological and molecular responses. Rice Science 24(6):360-364.
|
|
|
|
|
Robin AHK, Mathew C, Uddim JM, Bayazid KN (2016). Salinity-induced reduction in root surface area and changes in major root and shoot traits at the phytomer level in wheat. Journal of Experimental Botany 67(12):3719-3729.
|
|
|
|
|
Roldán-Ruiz I, Van Euwijk FA, Gilliland TJ, Dubreuil P, Dillmann C, Lallemand J, De Loose M, Baril CP (2001). A comparative study of molecular and morphological methods of describing relationships between perennial ryegrass (Lolium perenne L.) varieties. Journal of
Crossref
|
|
|
|
|
Applied and Theoretical Genetics 103:1138-1150.
|
|
|
|
|
Sabouri H, Biabani A (2009). Toward the mapping of agronomic characters on rice genetic map: Quantitative trait loci analysis under saline condition. Biotechnology 8(1):144-149.
|
|
|
|
|
Sakina A, Ahmed I, Shahzad A, Iqbal M, Asif M (2016). Genetic variation for salinity tolerance in Pakistani rice (Oryza sativa L.) germplasm. Journal of Agronomy and Crop Science 202:25-36.
Crossref
|
|
|
|
|
Singh D, Singh B, Mishra S, Singh AK, Sharma TR, Singh NK (2016). Allelic diversity for salt stress responsive candidate genes among Indian rice landraces. Indian Journal of Biotechnology 15:25-33.
|
|
|
|
|
Sirisena DN, Rathnayake WMK, Herath HMA (2010). Productivity enhancement of saline paddy fields in Angiththamkulam Yala, Sri Lanka, a case study. Pedologist, pp. 96-100.
|
|
|
|
|
Zeng I, Shannon MC, Grieve CM (2002). Evaluation of salt tolerance in rice genotypes by multiple agronomic parameters. Euphytica 127:235-245.
Crossref
|
|