ABSTRACT
The inter simple sequence repeat (ISSR) marker was used in this study for genetic fingerprinting and identification of released chickpea varieties and for the determination of the genetic relationships among these cultivars. A total of 19 released chickpea varieties were subjected to ISSR analysis with the objective of evaluating the genetic diversity among the cultivars. A total of 20 ISSR primers were initially screened and later based on their reproducibility and polymorphism, four of them were selected for the molecular diversity assay. Amplification of genomic DNA of the 19 varieties using four ISSR primers produced 38 scorable fragments. On average, 9.5 polymorphic bands per primer were observed in ISSR analysis. The total number of bands amplified by 3’ anchored primers varied from 7 to 12. The primers based on poly (GGAGA) and (AG)YT repeat motifs produced highest number of fragments (10 and 12, respectively), whereas, primers GACA and (GA)T, produced minimum number of fragments (7 and 9, respectively). Overall, 81.58% of the loci were polymorphic and 96.17 and 3.83% of variation were partitioned into within and among population, respectively. The least genetic similarity was recorded between the varieties, Shasho and Minjar (0.41), and highest genetic similarity (0.97) between the varieties, Worku and Kutaye. The UPGMA dendrogram clustered all genotypes into four different clusters and three varieties such as Shasho, Chefe and DZ-10-11 observed to be an out lie. The results indicate the presence of genetic diversity within released cultivars of chickpea in Ethiopia.
Key words: Cluster analysis, gene diversity, molecular marker, polymerase chain reaction, inter simple sequence repeat (ISSR), Ethiopia.
Chickpea is an important self-pollinating legume crop, grown mainly in West Asia, North Africa and the Indian subcontinent, where it is a basic component of the human diet (FAO, 2013; Talebi et al., 2008. The crop most probably has originated from the area of vpresent-day southeastern Turkey and the adjoining areas of Syria. India and Ethiopia have been proposed as secondary centers of diversity of cultivated chickpea (Cicer arietinum) (Gautam et al., 2016). The assessment of the extent of genetic variability within the cultivated chickpea is fundamental for chickpea breeding and conservation of genetic resources, and is particularly useful as a general guide in the choice of parents for breeding hybrids. The criteria for estimation of the genetic diversity can be estimated using morphological traits (Pakseresht et al., 2013) or molecular markers (Choudhary et al., 2013).
Plant genetic resources (PGR) and the genetic diversity present in them provide an assurance for future genetic progress and an insurance against unforeseen threats to agricultural production (Pakseresht et al., 2013). Crop improvement depends on the availability of genes for better agronomic traits, such as disease resistance, earliness and high yield. For these, characterization of genetic variability of a population is required since genetic variation within and among populations and between species determines the rate of response and adaptive evolution of crop species (Sefera et al., 2011). The aims of chickpea breeding is to develop high yielding cultivars that combine long lasting resistance against diseases with tolerance to abiotic stresses such as drought, cold and salt (ICRISAT, 2013). Modern plant breeding and agricultural systems have narrowed the genetic base of cultivated chickpea. This has promoted the search for new sources of variation that might be used in plant breeding programs (Varshney et al., 2013).
Molecular analyses are independent of environmental conditions, medium contents and developmental stage of the studied organism; and have proved to be valuable tools in the characterization and evaluation of genetic diversity within and between species and populations. A number of DNA based markers are now available for the effective quantification of genetic variation in plant species (Talebi et al., 2008). Among these, inter simple sequence repeat (ISSR) markers have been proposed as a new source of genetic markers that are inherited in Mendelian fashion and are scored as dominant markers (Nybom et al., 2014). The ISSR technique uses single primers for amplifying regions between the two microsatellites, yields highly reproducible results and reveals abundant polymorphism with good separation of the amplification products (Yadav et al., 2015). ISSR analysis offers breeders and geneticists with competent means to link phenotypic and genotypic variations and is rapidly being used by the research community in various fields of crop improvement. ISSR is technically simple and requires no sequence information to design polymerase chain reaction primers but performed using single primers based on a simple tandem repeats. ISSR analyses involve the polymerase chain reaction (PCR) and amplification of the flanking region between microsatellites. ISSR fingerprinting has been successfully applied to determine genetic diversity and relationships in a number of crop species (Bhagyawant and Srivastava, 2008; Gezahegn, 2007).
Moreover, ISSR markers have also been extensively used to study the genetic relationships among Cicer species (Singh et al., 2014), construct genetic maps (Flandez-Galvez et al., 2003), and map genes of agronomic importance (Rajesh et al., 2004; Udupa and Baum, 2003). The variability of microsatellites is exploited by a PCR-based technique that uses microsatellite-flanking sequences as primers to amplify the microsatellites in between. The resulting locus-specific amplification products often exhibit considerable length differences due to variations in the number of tandem repeats within the microsatellite (Singh et al., 2014). The use of ISSR for genetic diversity analysis of individuals of Ethiopia elite chickpea varieties has not been demonstrated. The present study was designed to determine the genetic variability among elite chickpea varieties using ISSR markers and to provide a better understanding of the genetic diversity of the released chickpea cultivars (Gautam et al., 2016), thereby, to specify the application further in the breeding program.
Sources of plant materials and DNA extraction
A total of 19 varieties of chickpea were taken from the Debre Zeit and Sirinka Agricultural Research Centers of Ethiopia. Details of chickpea (C. arietinum L.) varieties used for diversity analysis are given in Table 1. For DNA extraction, 20 seeds of each variety were sowed on each plot independently at Debre Zeit Agricultural Research Center (DZARC). Watering was done once a day and, after three weeks, healthy and young leaves were randomly collected and used for DNA extraction and further analysis.

DNA extraction
After 21 days, leaves of six plants per genotypes were selected randomly and used for DNA extraction. 100 mg of fresh leaves were frozen in liquid nitrogen and grounded using mortar and pestle. Total genomic DNA was extracted using 2% cetyl trimethyl ammonium bromide (CTAB), 1% polyvinyl pyrolidone, 100 mM Tris: pH=8, 20 mM EDTA, 1.4 M NaCl and 0.2% beta-Mercapto-ethanol following the method described by Piccolo et al. (2012) with minor modifications.
For ISSR-PCR analysis, three extractions for each sample was run on agarose gel of 1% concentration to check the presence and quality of genomic DNA and then to select between extractions on the basis of band intensity and less smear. From stock solution, 5 µl of genomic DNA and 2 µl of 6x loading dye was used and applied by adding 5 µl ethidium bromide on the gel in 1xTE solution running buffer and then electrophoresed at 100 V constant for 30 min. The gel picture was taken with Bio Rad 200 and further examined and used to make selection of the best DNA extract. Genomic DNA from the second extractions was found to be promising and was selected for ISSR-PCR analysis. The concentration of DNA also was determined by nano-drop spectrophotometer 8000. The DNA concentration ranges from 109.5 to 8432.3 ng/µl which was later diluted and optimized to constant concentration of 20 ng/µl.
Primer selection and optimization
The ISSR marker assay was conducted at Plant Genetics Research Laboratory of the Microbial, Cellular and Molecular Biology Department, Addis Ababa University. Twenty ISSR primers were screened on a total of ten varieties by random selection, and four primers that produced clear, reproducible and polymorphic band pattern were selected for in-depth study using nineteen varieties. Table 2 shows the list of primers used with their annealing temperature, respective sequences and other properties.
ISSR-PCR amplifications
PCR amplifications were carried out using a Biometra 2000 T3 Thermo-cycler. PCR amplification was carried out in a 25 μl reaction mixture containing 1.2 μl template DNA, 13.2 μl ddH20, 5.6 μl dNTPs (1.25 mM), 2.6 μl Taq buffer (10x Thermopol reaction buffer), 2.0 μl MgCl2 (2 mM), 0.4 μl primer (20 pmol/μl) and 0.2 μl Taq Polymerase (5 µ/μl). The PCR products were stored at 4°C until loading on gel for electrophoresis. Amplifications were performed for 40 cycles with denaturation at 94°C for 1 min, annealing at 45°C based on primers used and extension at 72°C for 1.30 min. Initial denaturation was done at 94°C for 4 min and a final extension step of 7 min at 72°C was also included. The PCR products were separated on agarose gel (1.67% agarose in 100 ml 1xTBE) prepared and 8 μl amplification product of each sample with 2 μl loading dye (6X) was loaded on gel. DNA marker of 100 bp was used to estimate the molecular weight and size of the DNA fragments. Electrophoreses were done for 2 h at constant voltage of 100 V. Gel picture was taken under UV trans-illuminator by Bio Rad 200 after staining with ethidium bromide for 30 min and destained for 30 min in distilled water.
Data scoring and statistical analysis of diversity
The ISSR markers were scored for presence (1), absence (0) and (?) missing or ambiguous observation and each band was regarded as locus. POPGENE version1.32 software (Yeh et al., 1999) was used to calculate genetic diversity for each genotype as number of polymorphic loci and percent of polymorphism. Analysis of molecular variance (AMOVA) (Excoffier et al., 2006) was used to calculate variation among and within different (Desi and Kabuli) genotype using Areliquin version 3.01 (Excoffier et al., 2006). Shannon-Weaver diversity index (H) was calculated as H= -Σpilog2pi, where, pi is the frequency of a given band for each genotype (Lewontin, 1972). Based on Jaccard similarity matrix, the un-weighted pair group method with arithmetic average (UPGMA) (Sneath and Sokal, 1973) was used to analyze and compare the individual genotypes and generate phenogram using NTSYS- pc version 2.02 (Rohlf, 2000). The neighbor joining (NJ) method (Saitou and Nei, 1987; Studier and Keppler, 1988) was also used to compare individual genotypes and evaluate patterns of genotype clustering using Free Tree 0.9.1.50 software (Pavlicek et al., 1999).
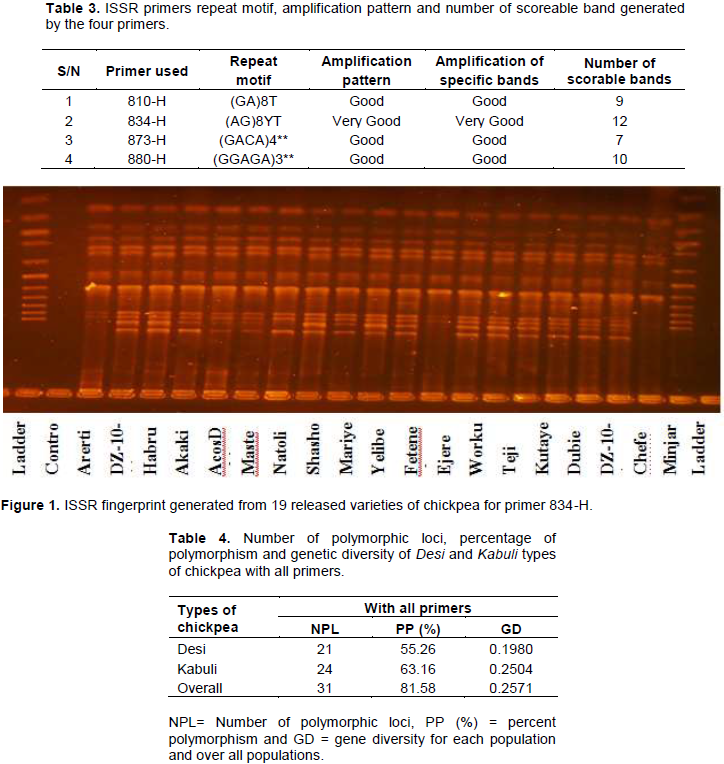
The assessment of genetic diversity is important not only for crop improvement but also for sustainable management, conservation and use of genetic resources. Molecular markers are efficient in determining variation at population and individual level since it is free of environmental influence. The genetic fingerprinting of elite chickpea (C. arietinum L.) varieties was performed using ISSR primers. Based on their reproducibility and polymorphism of the ISSR primers, four ISSR primers were used out of 20 to evaluate nineteen chickpea cultivars. The primers tested were two di-nucleotides (AG)8YT and (GA)8T, one tetra-nucleotide (GACA)4 and one penta-nucleotide (GGAGA)3 3’ anchored repeat primers.
Among the di-nucleotide repeats motif, (AG) 8YT and penta-nucleotide repeat motif (GGAGA) 3 produced better amplification patterns with more ISSR fragments. A total of 38 bands were amplified across 19 released varieties with 4 primers, revealing an average of 9.5 bands per primer. The total number of bands amplified by 3’ anchored primers varied from 7 to 12, with
molecular weight between 100 and1100 bp. The tetra-nucleotide (GACA)4 primers sequences amplified the least number of bands (7) and the di-nucleotide primer (GA)8T amplified (9) bands. Whereas, primers (AG)8YT and (GGAGA)3, amplified maximum number of bands 10 and 12, respectively (Table 3). Four ISSR primers were screened against nineteen chickpea DNA samples to identify potential primers producing more number of polymorphic and repeatable fragments. Figure 1 is the representative of the polymorphism observed among the chickpea genotypes as revealed by UBC-834.
The number of polymorphic loci ranges from 4 for UBC-834 to 7 for UBC-810 and both primers are with di-nucleotide repeat motif. For tetra-nucleotide repeat motif primer (UBC-873), the polymorphic loci was 5, while the only penta-nucleotide repeat motif primer (UBC-880) revealed from 6 to 8 number of polymorphic loci for Desi and Kabuli types, respectively. Ghaffari et al. (2014) revealed similar number of alleles ranging from 3 to 6 using SSR markers of Iranian chickpea landraces. Overall, 81.58% of the total loci scored were observed to be polymorphic (Table 4). Di-nucleotide repeat motif primer, namely UBC-810 showed 55.56%, tetra-nucleotide repeat motif primer UBC-873 was 71.43% and penta-nucleotide repeat motif primer UBC-880, showed 60% polymorphism for the Desi types, and 77.78, 71.43 and 80% for Kabuli types, respectively. In contrast, UBC-834 showed the least polymorphism, which was 41.67 and 33.33% for the Desi and Kabuli types, respectively (Table 5). Among all the populations studied, Kabuli types were found to have higher number of polymorphic loci (24) with higher percentage (63.16%) polymorphism than Desi types which have 21 polymorphic loci and 55.26% polymorphism (Table 4).

Gadakh et al. (2013) reported that accessions from the East Africa Region are highly polymorphic and genetically diverse with beneficial traits. Jannatabadi et al. (2014) also asserted Ethiopia as the secondary center of diversity for chickpea and an existence of diverse germplasm for biotic and abiotic stress. This implies that accessions from Ethiopia and the neighboring East Africa region might be important source materials for use in chickpea genomics and breeding in the future (Gautam et al., 2016).
The overall analysis with all di-, tetra- and penta-nucleotide repeat motive primers indicated that the Kabuli types of chickpea were found to be more diverse (0.2504) as compared to the Desi types (0.1980). Similarly, Kabuli types show higher Shannon diversity than Desi. Higher genetic diversity was observed within chickpea types (64.78%) as compared to among, which are scored (35.22%). This result confirms that ISSR marker is efficient in detecting polymorphism within and among populations and/or species of chickpea. This study suggested that the existence of higher diversity within and among the elite Desi and Kabuli types of chickpea varieties will provide a useful tool in the future design of collection strategies for conservation of chickpea varieties (Gautam et al., 2016). Moreover, this marker was observed to be very useful in detecting genetic diversity and population structure of other crops like Coffee (Tesfaye, 2006) and Anchote (Bekele et al., 2016) collected from all over Ethiopia.
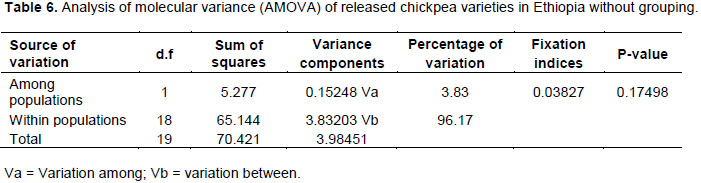
Analysis of molecular variance revealed that higher percentage of variation is attributed to variation within populations within groups (96.17%) and lesser percentage of variation among the populations (3.83%) (Table 6). This result is higher than the analysis of molecular variance revealed by Shiferaw and Kasshun (2017) using seed storage makers of Ethiopian Emmer Wheat land races.
The coefficient of similarity was used to calculate the genetic similarity of the released varieties. The Jaccard’s coefficient similarity among the 19 chickpea varieties varied from 0.41 to 0.97 with lower and upper values of the range indicating the minimum similarity and the maximum convergence index of 41 and 97%, respectively. The highest genetic similarity (97%) occurred between varieties Kutaye and Worku followed by Teji and Akaki, Teji and Fetenech and Teji and Akaki (0.94). The lowest similarity (0.41) was between the varieties, Shasho and Minjar and Shasho and Fetenech and these results have been also substantiated by a dendrogram (Figure 2). The existence of considerable variability among the released varieties offers an ample opportunity for the chickpea breeders to use specific genetic variability among the cultivars with the desired traits in the breeding program and identify divergent parents to include in chickpea crossing block.

Therefore, genetic similarity among nineteen released/ elite chickpea varieties observed in this study was relatively higher than those reported in other previous studies. Iruela et al. (2002) and Rao et al. (2007) using both RAPD and ISSR markers reported genetic similarity values of 0.19 to 0.97 and 0.80 to 0.94, respectively. Sant et al. (1999) also reported genetic distance values of 0.09 to 0.27 based on RAPD analysis and 0.42 to 0.61 with the use of oligo-nucleotide probes.
UPGMA analysis was used to construct dendrogram for nineteen individuals based on Jaccard’s coefficients similarity and quantify genetic distance based on 38 bands obtained with 2 di, 1 tetra and 1 penta-nucleotide repeat motive primers. The dendrogram generated by the cluster analysis using the (UPGMA) and considering the total differences with respect to all the polymorphic ISSR loci resolved the nineteen chickpea varieties into different clusters. The varieties (Natoli, Habru and Dubie), form cluster-1, while (Mariye, Arerti and Yelibe) appeared as cluster-2. In addition, cultivars Ejere, Fetenech, Teji and Akaki form separate group-3, while a cluster together and Minjar, Worku, Kutaye, Mastewal, ACOSDubie and DZ-10-4 form the last cluster 4. However, three varieties, Shasho, Chefe and DZ-10-11 were observed to be an outlier. Generally, no clear grouping of Desi types and Kabuli types of chickpea varieties was observed in UPGMA (Figure 2). Both trees recovered almost the same tree topology with similar groupings, although few individuals appeared to escape from groups in the case of neighbor-joining analysis (Figure 3). Desi and Kabuli varieties were not grouped together because they did not share common alleles from multiple cross breeding (Tadesse, 2009) and due to the discriminator power of the ISSR markers used in this study (Keneni et al., 2011).

Similarly, the results of Iruela et al. (2002) also showed a dendrogram differentiating between Desi and Kabuli types, but not showing clear relationships between these two groups and origin of the accession using RAPD and ISSR markers. However, Yan et al. (2008) carried out analysis on 24 chickpea cultivars released in Australia using microsatellite-anchored fragment length polymorphism markers and failed to find differentiation between the two major chickpea types. Moreover, since most of the cultivars used in this study originated from ICRISAT’s breeding program which were developed from multiple-crosses involving more than two parents of Desi and Kabuli type crosses, inheritance of common alleles from their parental progenitors would not be unexpected (Degefa et al., 2014) .
Therefore, the applications of ISSR technique in gene tagging and marker assisted selections are becoming more popular (Bhagyawati and Srivastava, 2008). The advantage of using ISSR markers lies in their linkage to SSR loci and likely mark gene rich regions (Kojima et al., 1998). ISSR markers are also used for the practical study of hybrid seed genotyping and varietal identification Bekele et al. (2016). The results obtained in the present investigation show that the ISSR primers showed the existence of considerable genetic variability among the released cultivars offers an ample opportunity for the chickpea breeders to use specific genetic variability among the cultivars with the desired traits in the breeding program (Aggarwal et al., 2013). Among all four ISSR markers, some polymorphic ISSR loci were scored high percent of polymorphism which enabled identification of the nineteen released chickpea varieties. These loci can be used to generate genetic profile (fingerprints) for each cultivar which could be of help in variety protection, breeding and genetic purity analysis. The unique band such as that produced by the (GA)8T primer in the Mariye genotype may serve as unique identifier for any of the phenotype characteristics. However, this needs to be further investigated using more number of primers as well as other co-dominant markers.
The authors have not declared any conflict of interests.
REFERENCES
|
Aggarwal H, Singh J, Khaket TP, Chhokar V (2013). Genetic diversity in chickpea using various molecular markers: first step towards molecular breeding. International Journal of Advanced Research 1:393–398.
|
|
|
|
Bekele A, Feyissa T, Tesfaye K (2016). Genetic diversity of anchote (Coccinia abyssinica (Lam.) Cogn.) from Ethiopia as revealed by ISSR markers. Genetic Resources Crop Evolution 61:707-719
Crossref
|
|
|
|
|
Bhagyawant SS, Srivastava N (2008). Genetic fingerprinting of chickpea (Cicer arietinum L.) germplasm using ISSR markers and their relationships. African Journal of Biotechnology 7(24):4428-4431.
|
|
|
|
|
Choudhary P, Khanna SM, Jain PK, Bharadwaj C, Kumar J, Lakhera PC, Srinivasan R (2013). Molecular Characterization of Primary Gene Pool of Chickpea Based on ISSR Markers. Biochemical Genetics 51:306-322.
Crossref
|
|
|
|
|
Degefa I, Petros Y, Andargie M (2014). Genetic variability, heritability and genetic advance in Mung bean (Vigna radiata L. Wilczek) accessions. Plant Science Today 1(2):94-98.
Crossref
|
|
|
|
|
Excoffier L, Laval G, Schneider S (2006). Arlequin Version.3.01: An integrated software package for population genetics data analysis. Evolution Bioinformatics online 1:47-50.
|
|
|
|
|
FAO (2013). FAOSTAT. Food and Agriculture Organization of the United Nations. Website
View
|
|
|
|
|
Flandez-Galvez H, Ford R, Pang ECK, Taylor PWJ (2003). An intra-specific linkage map of the chickpea (Cicer arietinum L.) genome based on sequence tagged based microsatellite site and resistance gene along markers. Theoretical Applied Genetics 106:1447-1453.
Crossref
|
|
|
|
|
Gadakh SS, Dethe AM, Kathale MN (2013). Genetic variability, correlations and path analysis studies on yield and its components in mungbean (Vigna radiata (L.) Wilczek). Bioinfolet 10(2a):441-447.
|
|
|
|
|
Gautam AK, Gupta N, Bhadkariya R, Srivastava N, Bhagyawant SS (2016). Genetic Diversity Analysis in Chickpea Employing ISSR Markers. Agrotechnology 5:152.
|
|
|
|
|
Gezahegn G (2007). Relationship between wild Rice species of Ethiopia with cultivated Rice based on ISSR marker; Addis Ababa University, Ethiopia. (M.Sc Thesis).
|
|
|
|
|
International Crops Research Institute for the Semi-Arid Tropics (ICRISAT) (2013). Chickpea (Cicer arietinum L.). Website
View
|
|
|
|
|
Iruela M, Rubio J, Cubero JI, Gil J, Milan T (2002). Phylogenetic analysis in the genus Cicerand cultivated chickpea using RAPD and ISSR markers. Theoretical Applied Genetics 04:643-651.
Crossref
|
|
|
|
|
Jaccard P (1908). Novellus recherché Sur la distribution florale. Bulletin of the Vaudois Society of Natural Sciences 44:223-270.
|
|
|
|
|
Jannatabadi AA, Talebi R, Armin M, Jamalabadi J, Baghebani N (2013). Genetic diversity of Iranian landrace chickpea (Cicer arietinum L.) Accessions from different geographical origins as revealed by morphological and sequence tagged microsatellite markers. Journal of Plant Biochemical and Biotechnology 23(2):225-229.
Crossref
|
|
|
|
|
Keneni G, Bekele E, Imtiaz M, Dagne K, Getu E, Assefa F (2011). Genetic diversity and population structure of Ethiopian chickpea (Cicer arietinum L.) germplasm accessions from different geographical origins as revealed by microsatellite markers. Plant Molecular Biology Reporter 30:654-665
Crossref
|
|
|
|
|
Kojima T, Nagaoka T, Noda K, Ogihara (1998). Genetic linkage map of ISSR and RAPD markers in Einkorn wheat in relation to that of RFLP markers. Theoretical and Applied Genetics 96:37-45.
Crossref
|
|
|
|
|
Lewontin RC (1972). The apportionment of human diversity. Evolutionary Biology 6:381-398.
Crossref
|
|
|
|
|
Nybom H, Weising K, Rotter B (2014). DNA fingerprinting in botany: past, present, future. Investigative Genetics 5:1.
Crossref
|
|
|
|
|
Pakseresht F, Talebi R, Karami E (2013). Comparative Assessment of ISSR, DAMD and SCoT Markers for Evaluation of Genetic Diversity and Conservation of Landrace Chickpea (Cicer arietinum L.) Genotypes Collected from NorthWest of Iran. Physiology and Molecular Biology of Plants 19:563-574.
Crossref
|
|
|
|
|
Pavlicek A, Hrda S, Flegr J (1999). Free tree software program for construction of Phylogenetic trees on the basis of distance data and bootstrap/Jack Knife analysis of the tree robustness. Application in the RAPD analysis of the genus Frenkelia. Folia Biological 45:97-99.
|
|
|
|
|
Piccolo SL, Alfonzo A, Conigliaro G, Moschetti G, Burruano S, Barone A (2012). A simple and rapid DNA extraction method from leaves of grapevine suitable for polymerase chain reaction analysis. African Journal of Biotechnology 11:10305-10309
|
|
|
|
|
Rajesh PN, Coyne C, Meksem K, Sharma KD, Gupta V, Muehlbauer FJ (2004). Construction of a HindIII Bacterial Artificial Chromosome library and its use in identification of clones associated with disease resistance in chickpea. Theoretical Applied Genetics 108:663-669.
Crossref
|
|
|
|
|
Rao LS, Usha-Rani P, Deshmukh PS, Kumar PA, Panguluri SK (2007). RAPD and ISSR fingerprinting in cultivated chickpea (Cicer arietinum L.) and its wild progenitor. Genetics Resources Crop Evolution 54:1235-1244.
Crossref
|
|
|
|
|
Rohlf FJ (2000). Numerical taxonomy and multivariate analysis system, version 2.02. Exeter software. New York.
|
|
|
|
|
Saitou N, Nei M (1987). The neighbor joining method: a new method for reconstructing phylogenetic trees. Molecular biology and evolution 4:406-425.
|
|
|
|
|
Sant VJ, Patankar AG, Sarode ND, Mhase LB, Sainani MN, Deshmukh RB, Ranjekar PK, Gupta US (1999). Potential DNA markers in detecting divergence and in analyzing heterosis in Indian elite chickpea cultivars. Theoretical and Applied Genetics 98:1217-1225.
Crossref
|
|
|
|
|
Sefera T, Abebie B, Gaur PM, Assefa K, Varshney RK (2011). Characterization and genetic diversity analysis of selected chickpea cultivars of nine countries using simple sequence repeat (SSR) markers. Crop Pasture Science 62:177-187
Crossref
|
|
|
|
|
Shiferaw AA, Kassahun TG (2017). Genetic diversity of Ethiopian emmer wheat (Triticum dicoccum Schrank) landraces using seed storage proteins markers. African Journal of Biotechnology 16(16):889-894.
Crossref
|
|
|
|
|
Singh PK, Sharma H, Srivastava N, Bhagyawant SS (2014). Analysis of Genetic Diversity among Wild and Cultivated Chickpea Genotypes Employing ISSR and RAPD Markers. American Journal of Plant Sciences 5:676-682.
Crossref
|
|
|
|
|
Sneath PHA, Sokal RR (1973). Numerical Taxonomy. Freeman. San Francisco. P 573.
|
|
|
|
|
Studier JA, Keppler KJ (1988). A note on the neighbor joining algorithm of Saitou and Nei. Molecular Biology and Evolution 5:729-731.
|
|
|
|
|
Tadesse S (2009).Genetic Diversity Analysis and DNA Fingerprinting of chickpea cultivars (Cicer arietinum L.) Using Simple Sequence Repeat (SSR) Markers. Thesis submitted to Haramaya University.
|
|
|
|
|
Talebi R, Fayaz F, Mardi M, Pirseyedi SM, Naji AM (2008). Genetic relationships among chickpea (Cicer arietinum L.) elite lines based on RAPD and agronomic markers. International Journal of Agriculture and Biology 10:301–305.
|
|
|
|
|
Tesfaye K (2006). Genetic diversity of wild Coffea arabica populations in Ethiopia as a contribution to conservation and use planning. Ecology and Development series. Doctoral Thesis. University of Bonn, Germany. No. 44.
|
|
|
|
|
Udupa SM, Baum M (2003). Genetic dissection of pathotype-specific resistance to Ascochyta blight resistance in chickpea (Cicer arietinum L.) using microsatellite markers. Theoretical and Applied Genetics 106:1196-1202.
Crossref
|
|
|
|
|
Varshney RK, Song C, Saxena RK, Azam S, Yu S, Sharpe AG, Cannon S, Baek J, Rosen BD, Tar'an B, Millan T (2013). Draft genome sequence of chickpea (Cicer arietinum) provides a resource for trait improvement. Nature Biotechnology 31:240-246.
Crossref
|
|
|
|
|
Yadav P, Koul KK, Shrivastava N, Mendaki MJ, Bhagyawant SS (2015). DNA polymorphisms in chickpea accessions as revealed by PCR-based markers. Cellular and Molecular Biology 61:84-90
|
|
|
|
|
Yan G, Lin R, Yang H, Khan TN, Siddique KHM (2008). Characterization of genetic diversity and DNA fingerprinting of Australian chickpea (Cicer arietinum L.) cultivars using MFLP markers. Australian Journal of Agricultural Research 59:707-713.
Crossref
|
|
|
|
|
Yeh FC, Yang RC, Boyle T (1999). Population genetic analysis of co-dominant markers and qualitative traits. Belgian Journal of Botany 129:157.
|
|


