ABSTRACT
The study examines the efficiency of the investment of corporate income retention. If retained earnings are invested in positive net present value projects, they should enhance the shareholder value in the long run. It is believed that the stock market adds premium to a firm’s earnings when the firm signals more retention of earnings. However, the stock market is seen to reverse the discipline when such retained earnings are not put to effective use. This study uses a sample of 27 high-growth, profitable Indian firms and tracks their retained earnings for a period of 15 years from 2002 to 2016. The results indicate that the retained earnings were put to an ineffective use by these firms, and the financial performance metrics that form the basis for shareholders’ investment choices are misleading as the association of corporate profitability to shareholder enrichment is distorted. While firms gain profit, their shareholders sustain losses as their future cash flows from the investment of retained earnings are heavily discounted by the stock market. Earnings measure the wealth of the firms but not the health of the shareholders.
Key words: Retained earnings, shareholder enrichment, financial performance metrics, assets growth, pecking order theory.
Although there are many available financing sources, firms can conveniently access the three broadly-available sources, namely earnings retained, new equity, and debt, when they find positive NPV projects. The viable options here are obvious: either new equity or retention of earnings would be preferred for firms with significantly high-growth potential (Hovakimian et al., 2001). It is evident that firms with growth potential would tend to maintain a high retained earnings ratio to net income, as retained earnings are the cheapest source of funding advocated by pecking order theory (Myers and Majluf, 1984). According to Park and Pincus (2001), internal savings are the best source for financing the fixed assets-requirements of firms. Corporate savings are the most appropriate source of financing due to various considerations; for instance, firms are discouraged to go for new equity for the reason that new equity may cause the share price to fall. Equity financing in turn diminishes the pro rata share of cash flows available for dividends and reinvestment (Walter, 1963). The cost of raising funds externally is significant, and market conditions may sometimes pose hardships for firms, causing them to go the capital markets to raise funds. Therefore, firms prefer to continuously retain their profits to the maximum extent possible in order to maintain a steady dividend payout. This is believed to be a kind of financially cautious behavior of corporate finance managers, but it may ruin shareholder enrichment in the long run.
While corporate income retention policy has been proven as secondary in corporate finance research areas, this study places it in higher priority over dividend policy. The reason for this is that when the earnings retained are not put into effective use, the stockholders sacrifice their return on investment. One instance of this is when firms do not invest in positive net present value projects. Shareholders expect to receive a better return when they allow the firm to retain the earnings. Here, a “better return” implies the rate of return would be greater than that of dividend incomes.
Since the management is separated from the ownership in corporate undertakings, the corporate managers are entrusted with an obligation to ensure the shareholders’ wealth maximization. Shareholders expect their agents (the managers) to select projects that would enhance their investment value in the long run. However, the reality often seen is that managers tend to work in their own favor when it comes to taking up risk in investment options. They may take up the projects in a combination that would minimize their investment risk where they can reap their required return to safeguard their positions, which may not be the shareholders’ expected rate of return. A number of studies have proven that the firms’ profitability is not proportionally associated to the shareholders’ wealth maximization. Earnings per share (EPS) has been proven to be one of the most influential variables in indicating the financial performance of a firm, but its relative impact on share price is not significantly felt (Fatima and Islam, 2014). Thus, EPS is not a variable that can measure the shareholder wealth. According to Botha et al. (1987), shareholder wealth is the product of number of shares outstanding and the market price per share as well as dividends collected during the current year.
According to Baumol et al. (1970), the return on retained earnings used for financing assets is lower than the external equity employed. This indicates that the retained earnings are not efficiently invested when compared to the investment of external equity. There is always a market discipline that is working favorably to the externally raised funds, and as a result, corporate managers are forced to employ the funds effectively. Managers may be led to believe that this driving force is missing with internally generated funds. Thus, earnings are retained whenever possible even if there is no corresponding investment opportunity for such funds; when the opportunity arises, the funds are employed. The time lag might have an impact on the return on retained earnings. The same point has been established in financial literature. For instance, the volume of earnings retained in a business firm is the deciding factor for selecting the investment choices (Himmelberg and Petersen, 1994; Schiantarelli, 1996; Audretsch and Elston, 2002; Carpenter and Petersen, 2002). Thus, firms decide the amount of earnings to be retained and then look for competent investment options. If this is the case, it should be understood that the corporate reinvestment is not to maximize the shareholders’ return but rather to prove that managers are efficient in handling their investments. In this way, they can be regarded as efficient fund managers, but there is an opportunity cost to their decisions that should not be forgotten.
The literature review reveals mixed results in this area. Some of the studies argued that the market price of shares is largely influenced by the current earnings, irrespective of the decision to distribute or retain earnings. Sound financial performance of firms has a direct positive impact on the shareholder enrichment regardless of the mode of earnings distribution. Friend and Puckett (1964) declared that the market price of shares is equated to the present value of expected future earnings, and these returns may take the form of dividends and capital gains. Raj (1976) supported the point that the share prices are considerably governed by the current earnings of companies.
However, there are studies that demonstrated how the current market price is significantly influenced by the portion of earnings distributed rather than by the earnings retained (Hackbarth and Johnson, 2015, Kanwal, 2012; Wright 2014; Chughtai et al., 2014). The impact of dividend distribution on market value of shares is much more pronounced in the short run. According to Javed and Shah (2015), retained earnings do not significantly contribute to positive changes in the market value of firms. Khan (2009) observed that the impact of earnings distributed is much more significant than that of earnings retained. According to Power and MacDonald (1995), both dividends and retained earnings significantly influence the changes in share prices.
In addition, the amount of retained earnings also plays a crucial role in evaluating the shareholders’ enrichment in the long run. Through retained earnings, shareholders gauge the managers’ ability of utilizing the amount of retained earnings effectively to improve the market value of the firm. There is evidence that the retained earnings significantly influence the market price of shares in the long run (Harkavy, 1953; Desai, 1965; Bhole, 1980). Chawla and Srinivasan (1987) proved that both the dividends and retained earnings explain significant variations in share prices, given that the market assigns more weight for retained earnings in the long run.
Beisland (2014) also supported this point by stating that retained earnings significantly influence the market price of shares. Tirmizi and Ahmed (2013) found that firms can enhance the shareholders’ value by efficiently utilizing the investment options of retained earnings. When firms do not have potential investment opportunities, they should not retain the profits. Studies have shown that shareholder enrichment is not ensured by a higher volume of retained earnings but by the effective investment of such earnings retained (Lincoln, 2014; Khan and Zulfiqar, 2012). According to
Royer (2017), firms with high marginal tax rates mostly benefit from equity capitalization where retained earnings constitute a greater part of the profits. Hardiningsih and Oktaviani (2012) stated that high-growth companies would increase the use of internal funds for financing the growth. Moreover, Jensen and Meckling (1976) pointed out that firms with great growth potential would reduce the dependence on debt, as creditors would normally demand a higher return on their investments when firms intend to invest in risky projects. In their work, Brigham and Houston (2004) found that the firms with attractive investment opportunities would avoid the issue of shares.
These mixed results put the researchers in a dilemma where the choice between dividend payments and income retention in terms of providing return to shareholders looks ambiguous. Shareholders generally believe in the financial performance of the firms when they decide to select the stock to invest. According to Gordon (1959), investors buy the income per share when they acquire a share of stock regardless of whether the earnings would be distributed, since future cash flows of the shareholders’ investment is decided by the total earnings, not by the way it reaches the shareholders. However, the investors should be aware of the fact that the retained earnings would lead to deferred revenue which should be greater than the current dividend income; otherwise, the firm would likely decide to distribute the current earnings to shareholders. If firms do not foresee any productive investment opportunities for providing a better future return to shareholders than the current dividends, the firm should follow a 100% dividend payout policy. In other words, the shareholders will take care of their investment growth. The return in the form of capital gain in the long run, which is equal to the earnings that would have otherwise been distributed during the period of retention or less than that, will lead to capital erosion. This point brings out questions such as, why are retained earnings not influential in producing positive changes in share prices? Is it due to the way retained earnings are employed? Moreover, are corporate managers the custodians responsible for maximizing shareholders wealth who decides whether the profits are continuously retained, who look for the right opportunities to invest and are to be held responsible for not enriching their shareholders? Furthermore, does it matter when there is a time lag between earnings retained and the investment of such earnings? These questions constitute the base for the study.
Corporations generate internal funds to finance its physical assets growth. According to Williamson (1964), retention policy of firms is influenced by the discretionary behavior of the board of directors. This prompts the question of whether the decision to retain earnings is a choice that the investors have. Friend and Puckett (1964) found that investors prefer dividends in non-growth industries, while in growth industries they prefer to support retained earnings. However, the study by Ball (1987) on the listed US firms proved that there is no relationship between the companies’ financial performance and shareholder enrichment. According to Ball, firms that do not enrich their shareholders either in the form of current dividend or in the form of market price appreciation can remain surprisingly profitable, as various financial metrics of these firms appeared to be extremely encouraging for investment. These firms were believed by the shareholders to be highly profitable based on conventional financial performance metrics; nevertheless, their shareholders sustained loss in the long run. The study by Ball did not take into consideration the stock dividend as the benefit to shareholders, and this is considered a rare event in most of the firms in Indian corporate sector.
The official directory of the Bombay Stock Exchange in Mumbai classifies the Indian industries into 23 major industries. From this, six major industries are taken up for the purpose of the study. Their growth potential is the selection criterion for the sample of 28 high-growth Indian firms that were chosen from the industries of cement, chemicals and pharmaceuticals, cotton textile, electronics, engineering, and paper. These firms were examined for a period of 15 years from 2001 to 2015, and five-year rolling average figures are estimated for further analysis. The five-year period is chosen on the basis that the impact of earnings retained could well be reflected in the long run on the market price of the shares for around five years. The common metrics indicating the financial performance of the companies are used as independent variables.
The shareholder enrichment has been used as the dependent variable. The study uses three variants of shareholder enrichment that measure the long-run benefit received by the shareholders in response to the financial performance of the companies during the 15-year period. These are presented in detail as below.
Shareholder enrichment to earnings ratio (SE/E)
This ratio measures how well the shareholders are benefitted in relation to the earnings of the company. The earnings of the company belong to the shareholders, irrespective of whether the earnings are declared as dividends or retained in the business. When the earnings are paid as dividends, this ratio is expected to be equal to 100%. When the earnings are retained by the companies, this ratio is expected to be more than 100% in the long run as the stock market would add a premium on the earnings retained when the reinvested earnings are effectively utilized. However, when this ratio falls short of 100%, it is understood that the retained earnings are not used properly by the firms. In addition, the stock market has depreciated the retained earnings, and those earnings retained do not yield any returns to the shareholders. Subsequently, the earnings become lost in the process when they are retained in the business and not put into effective utilization. For this reason, the shareholders suffer from their investment in shares. Shareholders of those companies where this ratio is less than 100% would have been better benefitted if the entire earnings have been paid off as dividends. The numerator of this ratio is the current year dividend plus capital gain, and the denominator is the profit after tax and preferential dividends during the same period. Capital gain is the increase in the market value of the shares in the current year over the previous year.
Change in market value of shares to retained earnings ratio (CMV/RE)
This ratio measures the change in the market value of shares during a period of time in response to the amount of retained earnings in the same period. This ratio calculates the increase in market price per share in relation to the average retained earnings in that five-year period. If retained earnings increase by one rupee, the market price per share is expected to increase by more than a rupee within the five-year period. If not, the shareholders do not get any return from their retained earnings. This ratio precisely measures the enrichment of the shareholders out of their reinvested earnings with the company, and the ratio is calculated by dividing the change in market value of the shares by retained earnings. The capital gain is divided by retained earnings for a five-year period of time.
Return on shareholder investment (ROSI)
This ratio measures the shareholder enrichment by considering the opportunity cost of the alternative investment opportunities of the shareholders. The shareholder enrichment, as calculated by this ratio, is compared to the inflation rate and the Indian government’s 10-year bond rate; both are used as proxies for the opportunity cost of alternative investment opportunities of the shareholders.
These dependent variables are framed from the shareholders’ point of view, not from the companies’ point of view.
Various cumulative average financial metrics studied as explanatory variables are (a) price to earnings ratio (P/E ratio), (b) payout ratio, (c) return on equity (ROE) ratio, (d) capital expenditures to revenue ratio, (e) ratio of debt to market value, (f) percentage of capital by internal funds, (g) earnings growth ratio, and (h) beta. They are derived as follows.
a. P/E ratio:
This ratio measures how much the investors are willing to pay for the EPS of the company. This ratio is computed by dividing the market price per share by EPS. The shareholders’ expectation about the future earnings of the company is reflected by this ratio. Thus, a higher price earnings ratio conveys to the shareholders that the future earnings of the company are promising.
b. Payout ratio:
This ratio indicates the relationship between the dividend paid to equity shareholders and the earnings after tax and preference dividends. The shareholders will know how much of the earnings are distributed to them as dividends. Thus, dividend payout ratio is a good indicator of profitability of the firm.
c. ROE ratio
Profitability of a company has been measured differently in different contexts. Penrose (1959) is of the opinion that the shareholders (the owners) are directly interested in the relationship between profits (after fixed interest payments) and the nominal capital issued, while managers relate profits (before interest payments) to the total capital employed, given that managers are likely to aim for the effective utilization of capital. Since the study focuses on the profitability of equity shareholders, this ratio is calculated by dividing profit after tax and preferential dividend by net worth.
d. Capital expenditures to revenue ratio (capital to revenue ratio):
This ratio explains the association between the revenue earned and the capital expenditures incurred by a company. For every rupee of earnings, the amount of capital that has been spent is identified with the help of this ratio. Thus, the ratio is intended to represent the capital intensity of the companies under study.
e. Debt to market value of shares ratio (ratio of debt to market value):
The debt to market value of shares ratio explains how the long-term debt is related to market value of securities. Before prospective investors take up a decision to invest in shares for a long period of time, they would normally like to weigh out the risk and rewards associated with the investment. Thus, the profitability of the companies is to be estimated in the view of financial risks. In other words, this ratio associates the financial risk with the return on investment.
f. Internally available funds to capital expenditures ratio (percentage of capital by internal funds):
Cash flow, which is the sum of profit after tax and depreciation, is equated to internally available funds. If expressed as a ratio to capital expenditure, this would measure how much capital expenditure can be financed through internally available funds without resorting to external capital, either in the form of new borrowings or in the form of a new equity issue. The maximum use of internal funds, seen as the cheapest source of funds, would reduce the weighted average cost of capital, thus leading to the maximization of shareholder wealth.
g. Earnings growth rate (earnings growth):
This is the annual growth rate of earnings calculated during the 15-year period. This rate measures how a company grows profitably over the period.
h. Stock beta (beta):
Stock beta indicates the volatility of share prices in the market. Beta has been calculated by regressing the market return with the individual stock return. From the shareholders point of view, beta indicates the risk associated with their investment in shares.
Scheme of analysis
Both simple and multiple regression analyses were executed at three stages. This was done to test the association between the conventional ratios that are used to describe the financial performance of the companies and the three ratios calculated to find shareholder enrichment. This would identify the effectiveness of using retained earnings in terms of enriching the shareholders in the long run.
In the first stage, the study tests the association between the shareholder enrichment, as represented by the three calculated measures (the shareholder enrichment to earnings ratio, change in market value to retained earnings ratio, and return on shareholder investment ratio) and the metrics of company financial performance. Of all the financial indicators used as the independent variables in the first stage of regression analysis, ROE and earnings growth are the most widely used financial criteria by investors and financial analysts in determining the performance of the companies. Therefore, at the second level, ROE and the earnings growth are regressed on the shareholder enrichment, as represented by the same three measures. ROE is the only variable found to be significant throughout the study, as it has an impact on shareholder enrichment. To test its impact as a sole independent variable upon shareholder enrichment, the study performed a simple regression analysis by regressing ROE only on the three measures to represent shareholder enrichment at the third stage. To test the association between shareholder enrichment and the widely used financial metrics, multiple regression models are framed with three variants of metrics for measuring shareholder enrichment.
Sensitivity of shareholder enrichment to retained earnings for high-growth companies
This section analyzes the association between shareholder enrichment and the retained earnings for high-growth companies that are listed in the sample. The study employed popular financial metrics which are used for assessing the financial performance of the companies; these are tested in terms of their ability to indicate the enrichment of the shareholders over a period of time. The analysis also checks the usefulness of ROE to the shareholders for their decision in selecting a company for investment, especially in shares. Sensitivity of market price of shares to retained earnings is also a part of the analysis in this section. The results of the analysis are discussed below.
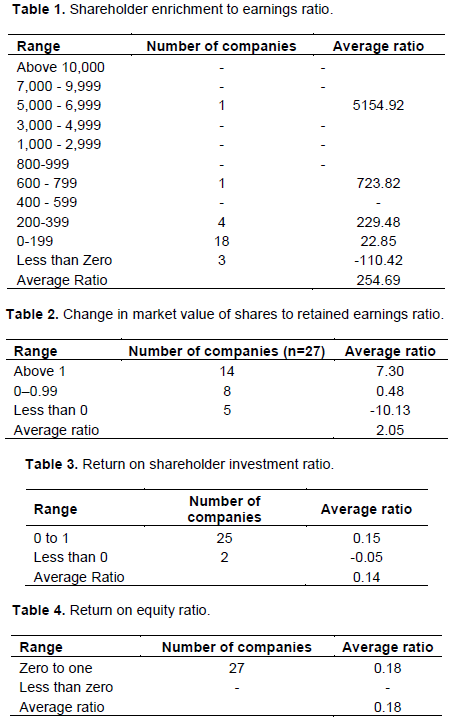
Shareholder enrichment to earnings ratio
Table 1 deals with the distribution of the shareholder enrichment to earnings ratio as calculated for the high-growth companies listed in the sample.
The company ranked at the top of the table has an average ratio of 5,154.92; this means that for one rupee of earnings retained, the shareholders are enriched by around Rs. 5,155 rupees over the 15-year period. The company following in second ranking enriches its shareholders by about Rs. 724 rupees for every rupee of retained earnings. Four companies further listed in the table benefit their shareholders in the long run by about Rs. 230 on average for every rupee of net earnings retained.
However, the companies at the bottom of the table show surprising results. Twenty-one companies ranked at the bottom of the table have either a low or negative ratio, meaning that shareholders received either few or no benefits. Eighteen companies have yielded relatively low returns to their shareholders; the shareholders of these companies only benefitted by about Rs. 23 for every rupee of earnings retained over the 15-year period. The result is even worse with the remaining three companies where the shareholders have sustained a loss by Rs. 110 for every rupee of earnings retained over the 15-year period. It can be said that these shareholders might have made the wrong decision in reinvesting their earnings in these companies. In these 21 companies, the stock market has either attached a less premium to the amount of earnings retained or discounted the amount of retained earnings, thereby causing a loss on the investment in shares.
Change in market value of shares to retained earnings ratio
Table 2 shows the range of change in market value to retained earnings ratio. Fourteen of the companies have produced an average ratio of 7.30, which is higher than 100%. However, 13 of the remaining companies are found with the average ratio of change in the market value to retained earnings either as a ratio less than 100% or a negative ratio. Eight companies are with the average ratio of 48% where the shareholders have incurred a minimum loss of 52% on their investment by way of earnings retained. The negative ratio calculated for the remaining five companies indicate that the shareholders have sustained loss by Rs. 10 for every rupee of retained earnings. In these 13 companies, which form 48% of the sample, the shareholders would have been better benefitted if the entire net earnings had been distributed as dividends.
Return on shareholder investment ratio
Table 3 analyzes the range of return on shareholder investment ratio, which is the third variant that measures shareholder enrichment when comparing it to the opportunity cost of their alternative investment and the average inflation rate during the 1996 to 2010 period.
The average ratio indicates that the shareholders are on average enriched by 14% on their net earnings that are reinvested into the business. Twenty-five companies ranked at the top of the table have the average ratio of 15%. The return on these companies compare favorably with the average 10-year India Government bond yield of 7.91% and the average rate of inflation as measured by Consumer Price Index of 6.77% during the 1996-2010 period. The return on shareholder investment is negative for the remaining two companies.
Return on equity as a measure of shareholder enrichment
Table 4 lists the range of ROE ratio, which is the conventional measure normally used to test the financial performance of the companies. The average ratio for all the selected companies is 18 %. When the return as per return on shareholder investment ratio and ROE ratio are compared, ROE exaggerates the real return to shareholders.
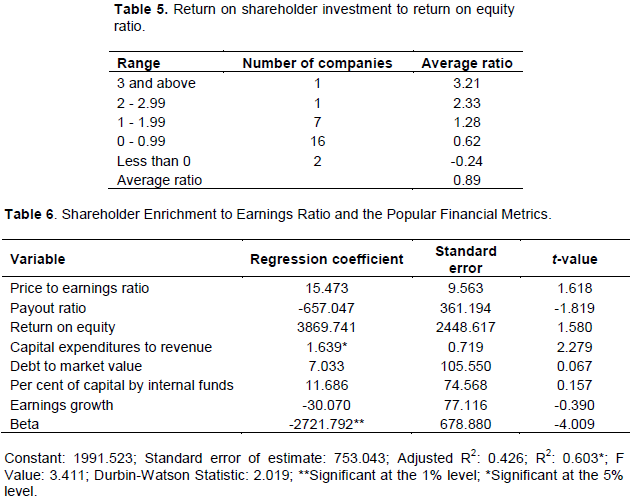
Return on shareholder investment to return on equity ratio
The study tested the effectiveness of ROE when putting it against the return on shareholder investment in explaining shareholder enrichment; Table 5 shows the return on shareholder investment to ROE ratio This ratio is expected to be 100%. Nine companies are found with an average ratio higher than 100%, but 18 companies have an average ratio that is less than 100%. The average shareholder enrichment is 11% less than that explained by the ROE ratio. Thus, the return on shareholder investment sounds better when put against ROE in terms of representing the shareholder enrichment.
Shareholder enrichment and the popular financial metrics
This section deals with the results of a multiple regression analysis that was performed to determine the sensitivity of shareholder enrichment to the popular financial metrics.
Shareholder enrichment to earnings ratio and the popular financial metrics
The results of the multiple regression analysis are shown in Table 6. The multiple regression analysis was executed to determine the association between shareholder enrichment, as represented by the ratio of shareholder enrichment to earnings and the traditional financial metrics, which indicate the financial performance of the companies for high-growth companies.
Beta and capital expenditures to revenue are the two variables found to be significantly associated with the shareholder enrichment to earnings ratio at the 1 and 5% levels respectively. However, the impact of the two variables is low. The R2 explains 60% of the variation in shareholder enrichment, and the Durbin-Watson statistic indicates there is no autocorrelation among the variables.
Change in market value of shares to retained earnings ratio and the popular financial metrics
Table 7 illustrates the multiple regression results, which are used to determine the association between the changes in market value to the retained earnings ratio. This was done to represent the shareholder enrichment in terms of the increase in market value of stocks due to retention of profits in the long run and the commonly employed financial metrics to judge the financial performance of the companies.
The results show that none of the financial indicators explain any significant amount of variation in shareholder enrichment. The model explains only 37% of variation in change in market value to retained earnings. The Durbin-Watson statistic indicates that there is no autocorrelation among the variables.
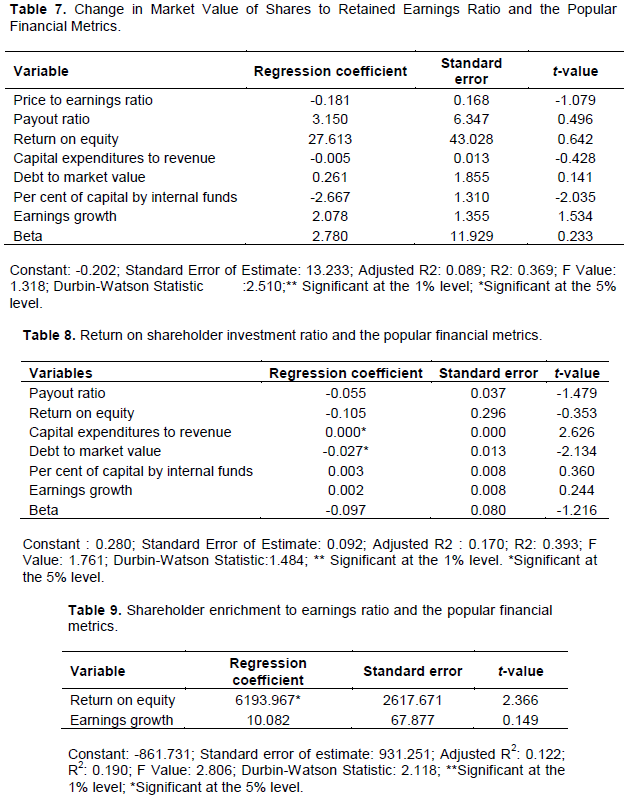
Return on shareholder investment ratio and popular financial metrics
Table 8 shows the results of the regression analysis that was conducted to explain the association between the return on shareholder investment, which was used as the representative of shareholder enrichment, and the same financial metrics.
The capital expenditure to revenue ratio and the debt to market value that are significant at the 5% level do cause a very low level of impact on the return on shareholder enrichment. R2 explains only 39% of the variation in return on shareholder investment.
Sensitivity of popular financial metrics to retained earnings
ROE and earnings growth are the two most widely employed financial metrics for determining the financial performance of companies. In the study, these are regressed with the three measures to indicate the shareholder enrichment; the results are reported in this section.
Shareholder enrichment to earnings ratio and the popular financial metrics
Table 9 shows the results of the regression analysis; these results explain the association between the shareholder enrichment to earnings ratio and the most prominent financial metrics, namely ROE and earnings growth. The return on shareholder enrichment is found to be statistically significant at 5% level. However, R2 explains only 19% of the variation in the shareholder enrichment to earnings ratio.
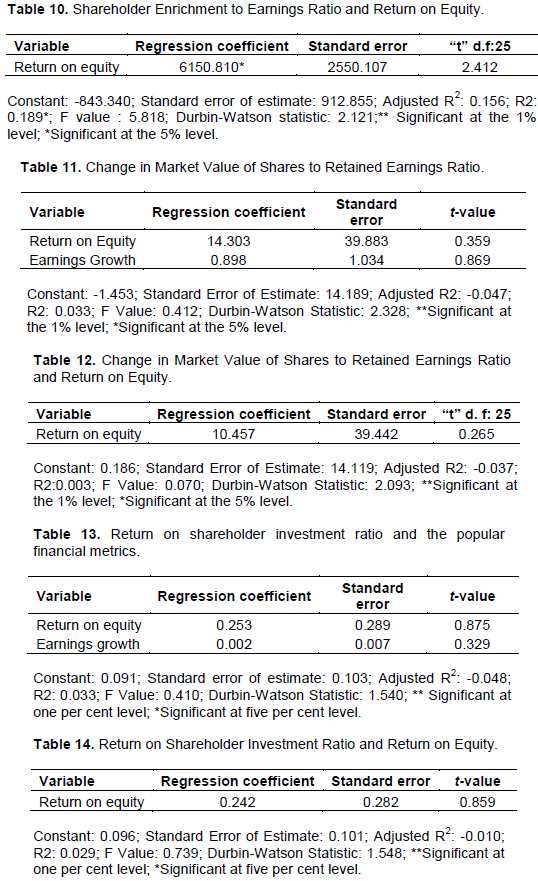
Shareholder enrichment to earnings ratio and return on equity
The study performed a regression analysis between ROE, the only variable often found significant in the regression analysis, and the shareholder enrichment to earnings ratio. Results are recorded in Table 10. Return on equity has been found to be significant, but it has a negligible impact on the shareholder enrichment to earnings ratio, as suggested by the R2 value of 19%.
Change in market value of shares to retained earnings ratio and the popular financial metrics
Table 11 lists the regression results, which determine the association between the change in market value to retained earnings and the two financial metrics of ROE and earnings growth. None of the financial measures explain any amount of variation in change in market value to retained earnings ratio.
Change in market value of shares to retained earnings ratio and return on equity
Table 12 shows the regression results that determine the association between the change in market value to retained earnings ratio and return on equity ratio. Return on equity does not show any impact on shareholder enrichment in the form of increase in market value of shares.
Return on shareholder investment ratio and the popular financial metrics
The results of the regression analysis between return on shareholder investment and the two financial ratios are presented in Table 13. It can be seen that ROE and earnings growth do not significantly contribute to the variation in return on shareholder investment ratio.
Return on shareholder investment ratio and return on equity
Table 14 illustrates the results of the regression equations performed between the return on shareholder
investment ratio and ROE. None of the financial metrics significantly explain the variation in return on shareholder investment. The empirical analysis provides the basis to believe that the traditional financial metrics, including the most widely used ratio of ROE in determining the financial performance of the companies, are not the appropriate indicators for explaining the shareholder enrichment in high-growth companies.
The traditional financial metrics that are used by the investors and financial analysts to gauge the performance of the companies do not seem to convey an accurate picture of investment return. This contradicts the profound statement that sound financial performance of firms has a direct positive impact on the shareholder enrichment irrespective of the mode of earnings distribution (Friend and Puckett, 1964; Raj, 1976).
While earnings can measure the health of a company, their shareholders may not be able to reap benefits in response to these earnings. ROE has been widely used by investors and financial analysts as a measure of selecting shares for investment. However, the results show that these popular metrics do not have any considerable influence on the three metrics of shareholder enrichment. This leads to the conclusion that the ROE does not precisely measure what the shareholders would benefit from their investment in shares. This is also supported by de Wet and du Toit (2007). According to them, ROE is a commonly employed metric, but it is a flawed measure of corporate financial performance. It is evident that earnings reported do not guarantee the proportional return to the shareholders. The results correspond to the findings of Ball (1987).
The results also reveal that the market price of shares does not fully reflect the opportunity cost of the amount of earnings retained over the period of five years. Earnings should not be retained unless firms have potential investment opportunities that would yield a rate of return better than the rate of return, otherwise called the opportunity cost of earnings retained. Shareholders are not ensured a better rate of return than their expected future rate of return by the volume of earnings retained. Firms under study do not care for the selection of investments for retained earnings as these finds are the cheapest source of funds.
Dr. Ravi Thirumalaisamy sincerely acknowledges the encouragement and help received from the management of Modern College of Business and Science, Al-Khuwair, Sultanate of Oman.
The authors have not declared any conflict of interests.
REFERENCES
|
Audretsch DB, Elston JA (2002). Does firm size matter? Evidence on the impact of liquidity constraints on firm investment behavior in Germany. International Journal of Industrial Organization 20(1):1-17.
Crossref
|
|
|
|
Ball BC (1987). The mysterious disappearance of retained earnings. Harvard Business Review 65(4):56-63.
|
|
|
|
|
Baumol WJ, Heim P, Malkiel BG, Quandt RE (1970). Earnings retention, new capital and the growth of the firm. The Review of Economics and Statistics 52(4):345-355.
Crossref
|
|
|
|
|
Beisland LA (2014). The effects of earnings variables on stock returns among public companies in Norway: A multiple regression analysis. International Journal of Management 28(3):773.
|
|
|
|
|
Bhole LM (1980). Retained Earnings, Dividends and Share Prices of Indian Joint-Stock Companies. Economic and political weekly, M93-M100. Available at:
View
|
|
|
|
|
Botha D, Bosch JK, Van Zyl GJ (1987). The Effect of Dividend Policy on Changes in Shareholders Wealth" South African Journal of Economics 55(2):66-74.
Crossref
|
|
|
|
|
Brigham EF, Houston JF (2004). Fundamentals of Financial Management. 4th edition. Thomas South Western Publisher.
|
|
|
|
|
Carpenter RE, Petersen BC (2002). Capital market imperfections, highâ€tech investment, and new equity financing. The Economic Journal 112(477):F54-F72.
Crossref
|
|
|
|
|
Chawla D, Srinivasan G (1987). Impact of Dividend and Retention on Share Price-An Econometric Study. Decision 14(3):137.
|
|
|
|
|
Chughtai AR, Azeem A, Ali S (2014). Determining the Impact of Dividends, Earnings, Invested Capital and Retained Earnings on Stock Prices in Pakistan: An Empirical Study. International Journal of Financial Management 2014(4):1
|
|
|
|
|
De Wet JHVH, Du Toit E (2007). Return on equity: A popular, but flawed measure of corporate financial performance. South African Journal of Business Management 38(1):59-69.
Crossref
|
|
|
|
|
Desai M (1965). Stock Prices, Earnings and Dividends in India-A Quantitative Analysis. Indian Economic Journal 12(4):432.
|
|
|
|
|
Fatima R, Islam A (2014). Relative Importance of Dividend, Retained Earnings and Earnings Per Share as The Determinants of Stock Price. Available at:
View
|
|
|
|
|
Friend I, Puckett M (1964). Dividends and Stock Prices. The American Economic Review 54(5):99-105
|
|
|
|
|
Gordon MJ (1959). Dividends, earnings, and stock prices. The Review of Economics and Statistics 41(2):99-105.
Crossref
|
|
|
|
|
Hackbarth D, Johnson T (2015). Real options and risk dynamics. The Review of Economic Studies 82(4):1449-1482.
Crossref
|
|
|
|
|
Hardiningsih P, Oktaviani RM (2012). Determinan kebijakan hutang (dalam agency theory dan pecking order theory). Dinamika Akuntansi, Keuangan dan Perbankan 1(1):11-24.
|
|
|
|
|
Harkavy O (1953). The Relation between retained earnings and common stock prices for large, listed corporations. The Journal of Finance 8(3):283-297.
Crossref
|
|
|
|
|
Himmelberg CP, Petersen BC (1994). R&D and internal finance: A panel study of small firms in high-tech industries. The Review of Economics and Statistics 76(1):38-51.
Crossref
|
|
|
|
|
Hovakimian A, Opler T, Titman S (2001). The debt-equity choice. Journal of Financial and Quantitative Analysis 36(1):1-24.
Crossref
|
|
|
|
|
Javed F, Shah FM (2015). Impact of Retained Earnings on stock returns of food and personal care good industry listed In Karachi Stock Exchange. International Journal of Scientific and Research Publications 5(11):397-407.
|
|
|
|
|
Jensen MC, Meckling WH (1976). Theory of the firm: Managerial behavior, agency costs and ownership structure. Journal of Financial Economics 3(4):305-360.
Crossref
|
|
|
|
|
Kanwal IK (2012). Effect of Dividends on Stock Prices- A Case of Chemical and Pharmaceutical Industry of Pakistan. Management 2(5):141-148.
Crossref
|
|
|
|
|
Khan AB, Zulfiqar AS (2012). The impact of retained and distributed earnings on future profitability and stock returns in Pakistan. International Research Journal of Finance and Economics 84:141-148.
|
|
|
|
|
Khan HS (2009). Determinants of Share Price Movements in Bangladesh. Unpublished Master Thesis, Blekinge Institute of Technology, Sweden.
|
|
|
|
|
Lincoln K (2014). Relevance and Irrelevance Theories of Dividend. Retrieved from Make Mone Note.
|
|
|
|
|
Myers SC, Majluf NS (1984). Corporate financing and investment decisions when firms have information that investors do not have. Journal of Financial Economics 13(2):187-221.
Crossref
|
|
|
|
|
Park CW, Pincus M (2001). Internal versus external equity funding sources and earnings response coefficients. Review of Quantitative Finance and Accounting 16(1):33-52.
|
|
|
|
|
Power D, Mac Donald R (1995). Stock prices, dividends and retention: Long-run relationships and short-run dynamics. Journal of Empirical Finance 2(2):135-151.
Crossref
|
|
|
|
|
Raj OP (1976). Impact of Earnings, Retained Earnings and Dividends on Share Prices. Indian Management 10:34-39.
|
|
|
|
|
Royer J (2017). Financing agricultural cooperatives with retained earnings. Agricultural Finance Review 77(3):393-411.
Crossref
|
|
|
|
|
Schiantarelli F (1996). Financial constraints and investment: methodological issues and international evidence. Oxford Review of Economic Policy 12(2)70-89.
Crossref
|
|
|
|
|
Tirmizi MA, Ahmad M (2013). Impact of retained earnings on the maximization of firm value and shareholders wealth. African Journal of Business Management 7(18):1833-1844.
|
|
|
|
|
Walter JE (1963). Dividend policy: its influence on the value of the enterprise. The Journal of Finance 18(2):280-291.
Crossref
|
|
|
|
|
Williamson OE (1964). The economics of discretionary behavior: Managerial objectives in a theory of the firm. Prentice-Hall.
|
|
|
|
|
Wright TC (2014). Difference of Profit and Retained Profit.
View
|
|