Full Length Research Paper

ABSTRACT
The growing interest in social networks, in health services, follows international pressure by improving quality and reducing costs in this sector. Identifying the most important actors in a social network is one of the applications of graph theory in social network analysis (SNA). Socialization among health professionals (actors) and their structural positions, in social networks, are important factors to be considered in developing strategies, which include information dissemination and influence. This research applied SNA to identify the actors with the greatest influence during handoff in a hospital. Data were collected in the second half of 2012, in the city of São Paulo. Semi-structured interviews have been conducted with actors in six handoffs. A seventh handoff has been created, as ideal hypothetical model, to compare the distinguishing features among the handoffs. The nurse in the unit of origin emerges as the actor with greater popularity (degree, eigenvector), greater influence or control (betweenness) and better access to information on the handoff (closeness, actor information centrality). A nurse is, possibly, an important categorical role to facilitate actions of integration during a handoff.
Key words: Handoffs, information dissemination, social networking analysis, healthcare.
INTRODUCTION
The growing interest for social networks in health services arises from international pressures to quality improvement and costs reduction in this sector. The identification of strategies, through the analysis of social networks, to disseminate information, as well as to understand the process of influence among health professionals (actors), can contribute to improvements in health sector (West et al., 1999).
Identifying the most important actors within a social network is one of the applications of graph theory in social network analysis. Several measures of centrality and visibility have been created to identify the most important and more prominent actors within a social network. These measures are based on the connections between the actors. However, since the description of the centrality measures by Freeman (1979), few studies have been conducted to evaluate the quality of such measures (Zemiljic and Hlebec, 2005).
West et al. (1999) suggest that socialization among health sector professionals and the structural position of these actors are important factors of social networking and should be considered when developing strategies that include information and influence of actors in the health sector. The structural dimension provides information on the social network patterns of links between individuals. For example, the number of connections among actors in the network (degree) and the control over the information flow in the network (betweenness).
The diversity of measures to assess the centrality in social networks reflects the different approaches to understand how an actor behaves. Stephenson and Zelen (1989) argue that there is no reason to believe that the communication between two actors occurs only through shorter connections between them. An actor can travel a greater distance to access other actors, if there is an impediment to access a closer actor faster. The actor information centrality is a measure of symmetric social network, i.e., the exchange of information is two-fold (A exchanges information with B; B exchanges information with A). This measure indicates how is the flow of information between different access routes, weighted by the strength of ties and by the distance between the actors. The availability of the actor information centrality of an actor tells the degree of this actor´s control over the flow of information within the social network. Thus, the greater the degree of actor information centrality of an actor, the higher the position of this actor as information gatekeeper (Veltri, 2013).
The transfer of patients among sectors of a hospital can be interpreted as an act organized by a team of professionals in the health sector, which are connected to each other, to promote a flow of information about patients. The analysis of social networks can verify the implications of the restrictions of actors involved in the information flow during this process. There is international pressure for the development of policies for patients´ transfers, due to the growing recognition of the damage associated to the transfer of medical or surgical care among the various sectors of a hospital (Wachter, 2012)
Is there a predominant categorical role among health professionals, establishing an optimal number of connections needed or feasible, to ensure secure flow of information about patients, among sectors of a hospital?
This research analyzes five measures of centrality and visibility of the actors involved in seven handoffs. The main goal is to identify the categorical role with better structural positioning for the development of strategies that include reliable information on handoffs. The intermediate goal of the research is to compare the similarities, differences or relationships among centrality measures used to describe the handoffs.
The research is structured in a literature review of the concept, types, applications and limitations of centrality measures. Then, the applied methodology is described; description and discussion of the results, and the final remarks conclude the presentation.
Centrality measures in social networking analysis
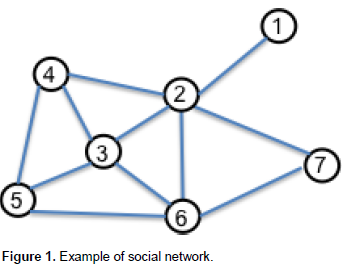
The SNA is based on graph theory, a branch of mathe-matics that studies the relationships between the objects of a given set. Consider Figure 1, for example, where we have a G (V, E) graph, where V are the vertices (actors) and E are the edges (relationships between the actors). Actor 2 has the highest measure of degree, five connections (actors: 1, 3, 4, 6, 7), while actor 1 has the lowest degree as: one connection (only relates to the actor 2). The measures of degree are, respectively, for these actors, 5 and 1. Therefore, actor 2 has greater power to influence this network than actor 1. Note that the information can spread rapidly through the network through actors 2, 3 or 6 (closeness). The other actors are, at best, two steps of each of these actors to receive information. However, the greatest measure of between-ness is from actor number 2, which functions as real gate-keeper. This actor, for political reasons, for example, can hinder or facilitate the transmission of information through the social network. Actors 3 and 6 both have 4 direct connections, so that the exclusion of any of the two does not drastically affect the flow of information in the network. On the other hand, the network presents some degree of dependence on actor number 2. Its exclusion would affect the flow of information in the network, leaving isolated actor 1, and the information could go long way to reach actor 7.
Frank (2002) discusses the centrality of an actor as a latent property, which allows him to create a private social network structure. The centrality measures are conceived as descriptive statistics of actors or social networks specific structural properties. From this perspective, a response pattern of an individual, such as the information exchange with other persons associated with him, may establish a functional relationship with his power degree (latent property) in the context he is inserted.
The centrality measure of intermediation (betweenness) determines the proportion of indirect contacts among others actors through a central actor. Such measure, for example, expresses an exploratory variable on the central actor attributions that give him influence or control over the social network. The degree determines the number of direct contacts of an actor with other actors of the network. This centrality measure has been explored in studies on the popularity and activity of the actors in the social network. The centrality measures of proximity (closeness) and information (actor information centrality) analyze the distances and routes between the actors. Thus, these properties provide evidence of the structural properties of the network related to the availability, security and guarantees in the vicinity of the actors. The central conception of the centrality measures proposes to capture structural properties to explain other attributes of the actors or performance properties of the social network (Borgatti and Everett, 2006; Freeman, 1979; Wasserman and Faust, 1994)
Borgatti (2005) points out evidences that a conceptual comparison is possible between centrality measures considering the characteristics of flows through the social network. The group power proposed by Ramon et al. (2012) does not show to be comparable to the measures of closeness or betweenness, but becomes more consistent with the measurements of eingenvector, while the measures of centrality, such as the degree and closeness are defined by number of ties between actors.
Bonacich (2007) argues that the eingenvector centrality measure can be seen as a weighted sum of both direct and indirect connections, which considers the whole pattern of the network. The β centrality measure (derived from eingenvector measure) allows the assessment of negotiation power in social networks even with negative connections - type of network in which the power of an actor is reduced by the connection with other actors with many alternative trade patterns. It also allows assessing social networking with both positive and negative ties, so that a hostile network connection with another network of higher status can reduce its status and vice versa.
The route by which a flow (e.g., information flow, resource flow) is processed is crucial to the operation of most social networks. Many centrality measures quantify the importance of sharing these routes within the social network. The measure of betweenness orders the actors in terms of their individual importance in the social network, but does not make clear in advance, how they exert their influence on the social network. Studies on how this influence occurs are important to understand how actors form social groups or coalitions. Works on interactions in the social network structure, on the information flow and on the selection and training types of influence subsets of actors have sparked recent interest in social network researchers (Kolaczyk and Barthélemy, 2009).
The centrality measures assume the previous pre-supposition that the relationships directions between a pair of actors are always symmetrical. However, there are real situations of asymmetry between relationships. In this way, it becomes important to define the centrality measures (or improve existing measures) to situations of asymmetry between relationships. The introduction of an asymmetric element in relationships implies different possibilities of power negotiations for both actors (Pozo et al., 2011).
Kim et al. (2012) presented a new concept of state power for consideration, based on social network analysis: the index of structural power of the social network (structural network power index-SNPI), defined as the power of a state to emerge from its location within the social network of international relations in which it is embedded. A state acquires power as a result of its interactions with other states within the system and its structural position in the social network. A well-positioned state occupying central positions in the social network acquires more power. Many social network analysts believe that there is a positive relationship between the centrality of an actor and his power in the social network. The central actors acquire more power due to the increased accessibility and greater control of social network resources.
Understanding the social structure of a project development can contribute to direct the goals to ensure best performance in the execution. The success of the project development requires a high degree of connectivity to its reference network to be side by side with opportunities that permeate its structure. For example, in the context of movie´s industry, better access to information from the social network may allow producers to find promising ideas that ensure copyright before their competitors take ownership of opportunities or may recognize values ??in projects whose potential has not yet been exploited (Ferriani et al., 2009).
Connectivity joins several agents for a common action. Marcus and Henderson (2006) consider the connectivity, for example, as a juxtaposed network of people, organizations, information and resources that can capture, contain and recover from a terrorist incident or other disasters. This concept is useful to describe the integration and coordination of activities in public health, among other areas. Even if a system has adequate resources in terms of technology, training and funding, such components do not ensure alone a properly functioning system, without certain threshold of connectivity (Kerby et al., 2005).
Research on organizational connectivity and readiness in public health suggest that organizational connectivity perception may be a good indicator of organizational readiness (Dorn et al., 2007). In fact, in an emergency, it is important for an organization to know in a timely manner the availability of the necessary resources to the action. Actions to improve formal links between actors may allow greater collaboration, open communication, teamwork, and enhance the ability of the system global response to emergencies with flexibility and resilience (Hall et al., 2010)
The formation of a team for a project is a choice among a set of possibilities, so that administrators should reduce the risks for an improper configuration of a team. In the composition of a team, the project leader should take into consideration the potential of each member to bring innovative contributions. A balanced configuration among new actors and senior ones seems to be most appropriate to ensure a better setting and better team performance. The centrality of the network surrounding the development of a project has a positive impact on its performance (Ferriani et al., 2009).
Ferriani et al. (2009) found evidence that the project leaders with greater centrality in the social network are more likely to succeed in their business ventures. This suggests that the connections are an expression of how social capital provides access to opportunities for projects. However, the author´s research suggests that there is a potential disadvantage in the excessive exposure within the network. New research on social networks has demonstrated negative implications of excessive centralization, both at the individual and at the organizational level. As you increase the connectivity of an actor in the network the benefits of high degrees of centrality decreases (Sampson, 2005; Owner-Smith and Powell, 2003; McFadyen and Canella, 2004).
Researchers have questioned the responsibility of an actor who is deeply embedded in social relationships as this gives him many possibilities for restriction of choices (Uzzy, 1997). Researches on the risks of hyper-connectivity are also emerging. Is there an optimal number of connections needed or feasible to maintain the sustainability of performance within the network? The hyperconnectivity refers to the restrictions an individual or company may face in the quantity of relationships (and by implication the amount of information) that they can sustain. Another phenomenon, known as over embeddedness results in increased resistance of the actor to accept communication with unknown actors (whose tendency for cooperation becomes uncertain) (Uzzi and Spiro, 2005).
The disparity in the actors´ centrality also helps to increase the inefficiency of information flow in closed systems. Instead, in open systems, the flow of information within its borders becomes important. The disparity between the centralities of the actors in a system increases the inefficiency of internal communication, but reduces inefficiency in communication between the system and the environment. To the extent that a system becomes more open, the disparity of the actors´ centralities makes the information flow more efficient across their borders (Yamaguchi, 1994)
Hossain and Wu (2009) investigated the differences in coordination activities between actors with different degrees of centrality in social networks. Research shows statistical evidence that the betweenness measure seems like the best predictor of the coordination ability in indirect graphs, whereas the out-centrality measures are more robust to predict this ability in direct graphs.
In specific social networks, social capital reflects a unique set of resources available for embedded people. It emerges from the relationships between people and it is not an inherent property of an individual. In terms of tangibility, it exists in social relationships between people and figure as the value of the relationship or communication links. The existence of social relationships is not a single component of social capital. The macrostructure of a social network is made ??up of unbalanced relationships, i.e., the strong and weak ties between actors. In general, the greater the relationships network in which a person is embedded, the greater its social capital (Coleman, 1988).
Bodin and Crona (2008) explored aspects of social capital in a rural fishing community to explain why collective action towards sustainability management were not put into practice , despite the incontrovertible evidence of the decline of the fish markets, the coastal degradation and the increasing awareness of these problems by the local community . Social capital contributes with beneficial effects on people's ability to organize effectively, and in conjunction with leadership, to leverage changes in the social group (Coleman, 1990). From the perspective of social network analysis (Borgatti et al., 1988), Bodin and Crona (2008) used structural measures of social network to identify influential actors in the community. The analysis of the structural characteristics of the rural community social network has identified an actor with high centrality, who represented the only link between the heads of the community. The rural community became vulnerable by relying on a single actor for formal connections with governmental organs and, sometimes, personal interests of the most central actor surpass the collective interests.
Coleman (1990) identified four common elements in a collective action: group of people doing the same actions simultaneously; dynamic system whose equilibrium can be achieved eventually, synchronization actions, and some degree of unpredictability, with possible explosive results. When meeting with these assumptions, Ramón et al. (2012) created a group power indicator with the same concept: the power to initiate an action. The power to initiate an action quantifies the group ability for a society to adopt its behavior and how quickly people learn this new behavior. From this information, an administrator, for example, can allocate the people most able to help prevent or encourage an action in a given context. The group power has a broader scope than the group centrality measure, and is not limited to graph theory.
Competence for actor collaboration, within a weighted network, must be related to the amount of employees (degree), with the collaboration frequency and with the importance of employees (strength of the actors in the neighborhood). Conventional measures of centrality (degree, betweenness, closeness, eingenvector) are not able to accurately describe the power of collaboration between nodes in a social network (Yan et al., 2013).
Yamaguchi (1994) found that social networking systems with two or more subgroups connected by bridges become less inefficient because the actors that act as bridges become more central in their own subgroups. This may explain why open systems tend to be more organized so that the communication to the center of the system is easier than with its peripheries.
The structural characteristics of social networks can explain the variation in the degree of inefficiency of the information flow within social networks. Both segmen-tation (number of bridges) and location in social networks increase the inefficiency of information flow in social networks. An increase in network density only contributes for the efficiency of information flow within subgroups, but increases the inefficiency of the information flow between the subgroups (Yamaguchi, 1994).
Relations between centrality and power can be more contextual than it has been believed. Even in social networks with multiple possibilities of interactions, when social influence is contrasted against a decision making, for example, high centrality degrees does not guarantee success for an actor. A semiperipheral actor that monopolizes communication flows with peripheral actors, and is skilled at surrounding central actors may emerge with more power than the actor with the highest centrality degree. The centrality measures are important to understand the power of an actor, but have different degrees of importance. The way the centrality of an actor affects his power is deeply related to the social network structure in which he is embedded. A third significant aspect of the structure of the social network , involves the number of existing subgroups, as well as how a central actor is able to perform to resolve deadlocks between competing groups (Mizruchi and Potts , 1998).
There are qualitative differences between theoretical and real models of social networks. Amaral et al. (2000) identified at least three structurally different classes of social networks. These can be differentiated by the degrees’ distribution of the actors (vertex degrees). Such structures form social networks of single scale, without scale or with broad scale. Social networks occur in various fields, such as genetic or metabolic regulatory networks, food chain, epidemics, transport, economic interactions and internet. The degree is a typical measure used to analyze social networks. This measure is intrinsic to characterize the site of a graph so a meaningful interpretation becomes possible only with graphs that form a statistical set known (Wuchty and Stadler, 2003).
Stable social networks are defined as those in which no one of both actors get gains with the development of a bond between each other or when just one actor fails to win by providing services to other actors who are connected (Jackson and Wolinsky, 1996). Nevertheless, the concepts of stable social networks are not adjustable for online communication networks. Farrell and Fudge (2013) found evidence that an actor benefits from the social capital and choose communication ties to maintain or improve its social capital. Despite the continuous flow of communication links in these social networks, the social network structure remains relatively constant over the months, making these structures almost stable.
The centrality and prominence measures present variations of reliability. The simplest centrality measures (degree, betweenness, closeness) showed to be more stable to variations while the measure of flow betweenness showed to be less stable compared to the others. In general, global indexes are less stable in comparison to the local index. The convergence measures (in-degree, in-closeness) showed to be more stable than measures of divergence (out-degree, out-closeness) (ZEMILJIC; HLEBEC, 2005). Unlike measures of flow-betweenness, variations of betweenness measures do not alter the basic model (Brandes, 2008).
Reliability is one of the criteria used to verify the quality of a measurement. For reliability matters the extent to which a measure is repeated or how the random error is distributed in the measurement process. That is, the reliability assessment aims stability and internal aware-ness (equivalence) of the measures. In social networks analysis, for example, some research on the reliability have been made on the entire network measurements, on the actors’ choices and on the popularity of an actor (Wasserman and Faust, 1994; Ferligoj and Hlebec, 1999).
This literature review points to a nonconformity of researchers with the classic measures of centrality to describe the latent properties of social network actors: how reliable these measures are to describe the popularity (degree, eigenvector), the influence or the control (betweenness) and the access to information on a social network (closeness, actor information centrality), as for example, a handoff? Another current challenge is the ability of an actor, who holds high degrees of centrality, in mobilizing collective action in the network. In the next section, follows the description of the methodology applied.
DATA COLLECTION AND PREPARATION
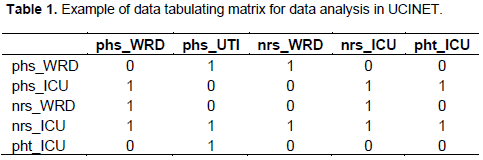
This research was exploratory in nature, whose main purpose was to clarify concepts and ideas on the SNA applied to the handoffs in a Private Network of Hospitals of the City of São Paulo, with the intention to formulate more specific issues for further study. This way, it aimed to provide a general view, something approximate, about handoffs, whose literature is scarce under SNA perspective. The objective of the questionnaire in an SNA is to gather information about the relationships of each person who is part of a social network (Parker et al., 2001). Specifically, in this research, the aim of the questionnaire was to identify the actors who shared information about the patient during the handoff, whose standard question for each actor was "who have you exchanged information with about the patient during the handoff?" From the responses of the actors, it was assembled a matrix of square order, whose marginal rows and columns contain the actors of the handoff. The elements a(ij) of the matrix represent the values ??1 or 0, whether the actors have exchanged information or not, respectively, among themselves during the handoff (Table 1). The data in this format were analyzed using UCINET 6 software for Windows (Borgatti and Foster, 2003).
In general, sampling procedures and quantitative data collection techniques are not common in exploratory research. The authors applied the method of snowball sampling, used, in general, when you do not have the list of members of a population of interest.
The snowball sampling assumes that there is a link between the members of a population given the object of interest (Faugier and Sargeant, 1977). For example, people who were involved in the transfer of a patient from the ICU to the ward, in the same hospital, probably exchanged information with each other, to some degree at some point.
In snowball sampling, the initial respondents have been chosen for convenience. Those respondents have been used to identify other respondents who participated in the transfer of patients among hospitals sectors. The process continued until reaching the saturation point. The snowball sample was introduced by Goodman (1961) and is a technique that successively amplifies the social network vertices, as it connects adjacent actors. Respondents reveal other respondents who they have had contact. Indicated respondents have the social and demographic characteristics of the people who indicated them. This increases the chance to quickly locate the desired actors in the social network, with relatively low cost. If the identity of all involved persons is observed, then the social network is completed around the social phenomenon under study (Frank and Snijders, 1994; Frank, 2002).
Epidemiologists and public health practitioners use snowball and contact tracing techniques to control epidemics, to recruit people for programs to promote health and for vaccine tests (Valente, 2010).
Data were collected in the second half of 2012, in a hospital in the city of São Paulo. Semi-structured interviews were conducted with actors involved in six Handoffs, among hospitals´ sectors. A seventh handoff was created as a hypothetical model based on the identification of the categorical roles involved in the six handoffs studied.
In the hypothetical model, handoff 7, it has been inserted a categorical role called clinical integration agent (cia_U). In a systematic review of the literature, Rennke et al. (2013) found evidence that an intervention of integration organized by a professional, fully dedicated to exchange information interfaces, in care transitions, has reduced visits to emergency departments and in readmission rates. The clinical integration agent would be part of an integration strategy aimed at the prevention of adverse clinical outcomes, the involvement of patients and their families, the use of a professional with a focus on exchanging patient information and facilitating communication with other actors.
The implementation of the strategy to use a person as intermediary in the transition of patient care has been described in 30 studies (of which 21 were randomized and controlled trials). The involvement of the patient has been among the interventions applied by the intermediary in 20 of these works (Rennke et al., 2013).
Based on this strategy, we have inserted the hypothetical model, plus two other categorical roles: the patient (ptn_U) and the patient's family member (pmf_U). The assumption has been adopted that all connections between two actors were symmetrical. The hypothetical model assumes the premise of a maximum degree of satisfaction among all actors involved in the handoff, so that the flow of information meets all stakeholders.
The interviewees have been asked to what extent, within an ordinal scale from 1 to 5 (1 = I do not exchange information... 5 = I exchange information very often), they exchanged information with the other actors involved in the handoff and what were they degree of satisfaction or dissatisfaction with the handoff, in an ordinal scale from 1 to 5 (1 = very dissatisfied, 5 = very satisfied). The data have been processed using algorithm by the software UCINET for Windows (Borgatti et al, 2002) and have not been dichotomized (ordinal scale transformed on a binary scale).
The dimensions of social support and measurement scales combinations represent the most important predictor variables to explain the variability of reliability in global indexes. The type of question, in turn, is the most important predictor variable to explain changes in the extent of the reliability of the in-degree (number of information received). The network density affects the reliability of the measurements of the out-degree (number of information sent). The reliability of centrality and prominence measures becomes greater when ordinal scales are used. The greatest consistencies in predictors of reliability on measures of centrality and prominence are in the domain of social support, in the combination of measures scales and in the range in which the measurements are made ??(Zemiljic and Hlebec, 2005).
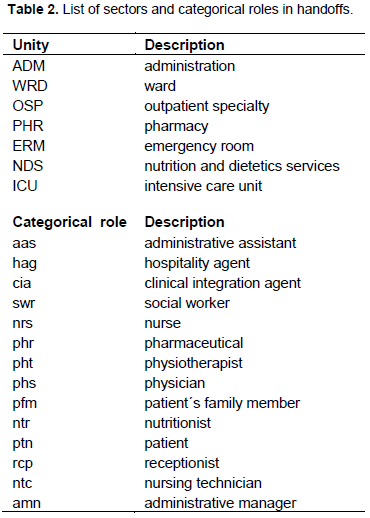
The interviewees have been classified into categorical roles by operating units. Table 2 presents a description of the units and categorical roles applied in this research. For example, phs_ICU means physician from the intensive care unit; nrs_wrd means the ward nurse and so have been appointed the other categorical roles. In handoff 07, the origin unit has been called A, while the destination unit has been called B. The sectors of support services have generically been called ADM in Handoffs 1- 6 and U in handoff 7. The patient and family member have been located in ADM (handoffs 1- 6) and in C in handoff 7. The designations were arbitrary.
The centrality measures have been correlated with the average level of satisfaction with the handoff and verified to what extent the centrality measures correlate with each other. Valente et al. (2008) found an average correlation of 0.54 (0.14) between centrality measures (degree, betweenness, closeness and eingenvector).
The participation of respondents has been voluntary and free of coercion, force or requirements. The right to privacy has been assured by anonymity and confidentiality by restricting access to the identification of the respondent to the researchers. There has been no conflict of interest in this research. The results of these interviews are described in the next section.
Results
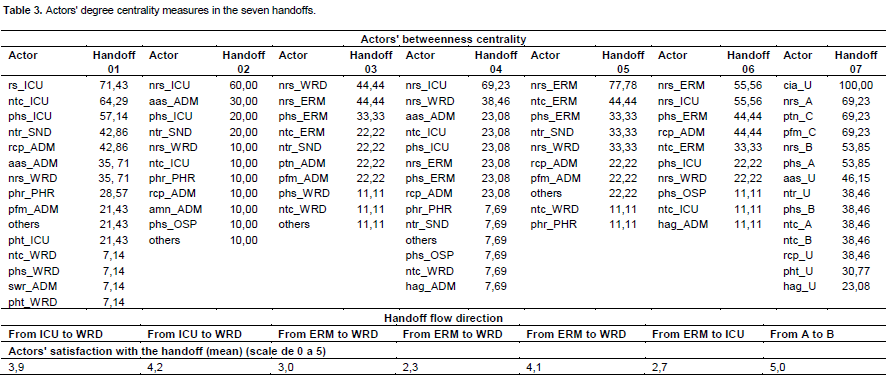
The nurse of handoffs of the origin unit has the most direct contact with the other actors, which gives her/him the greatest popularity and prestige in the network (Table 3). There are wide asymmetries in the degree of connections among nurses of the origin units and destination units of the patient in handoffs 01, 02, 04, 05. There is a correlation of 0.7 (however, p = 0.09) between the degree of these actors and the average level of satisfaction with the handoff.
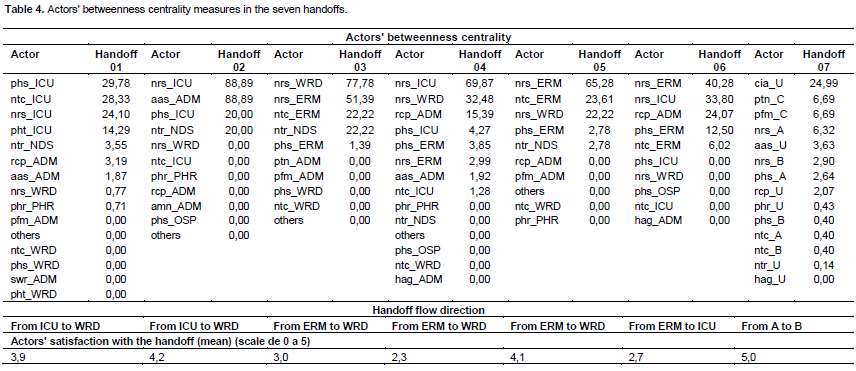
The nurse of the origin unit, except in handoff 01, has the highest proportion of indirect contacts between other actors (Table 4). Such measure, for example, expresses an exploratory variable on the nurse assignments, which gives him/her influence or control over the social network. The route by which the flow of information is processed is crucial to the operation of most social networks. There has been no correlations between betweenness measures and the average level of satisfaction with the handoffs (p = 0.505).
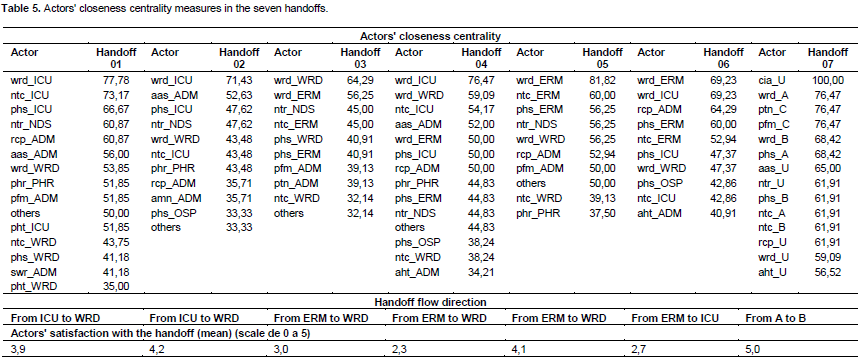
The nurse of the origin unit has the highest centrality of proximity between the actors, except in handoff 02 where he/she ranks second (Table 5). The closeness highlights the structural properties of the network related to information and resources access in the vicinity of the actors. There has been a correlation of 0.7 (however, p = 0.07) among nurses of greater closeness measures and the average level of satisfaction with the handoff.
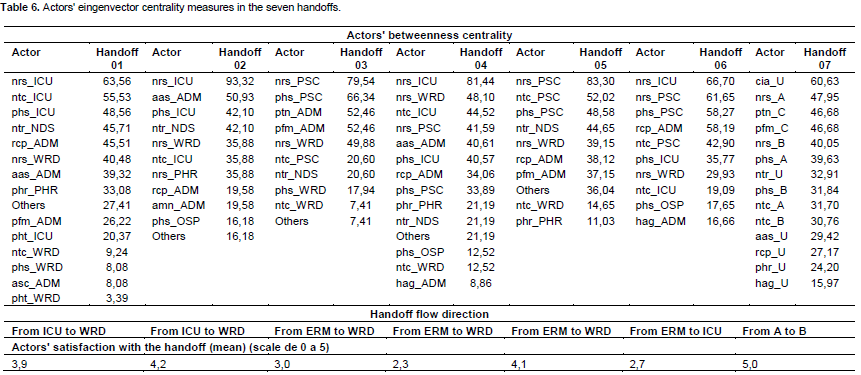
The nurse of origin unit, except in handoff 06, has the highest centrality eingenvector measures, as it examines both direct and indirect connections, which considers the whole pattern of the network (Table 6). The correlation between the eingenvector measures of the main actors and the level of satisfaction with the handoff has not been significant in this sample (p = 0.71).
The nurse of origin unit, except in handoff 02, has the highest actor information centrality measures whose meaning resembles the closeness measure (Table 7). The correlation between actor information centrality measures of the main actors and the level of satisfaction with the handoff has not been significant in this sample (p = .97).
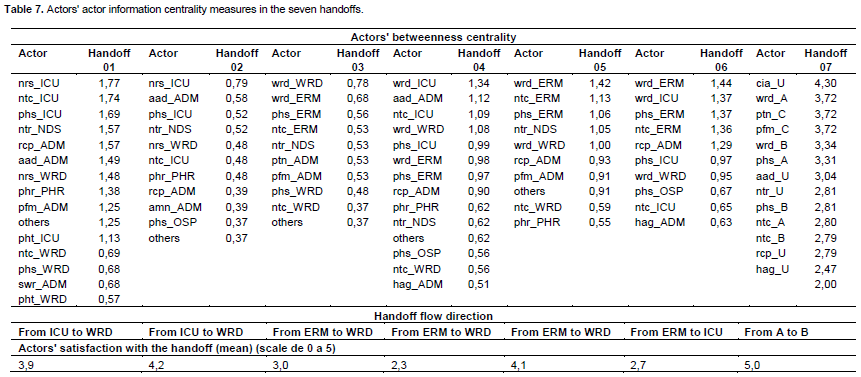
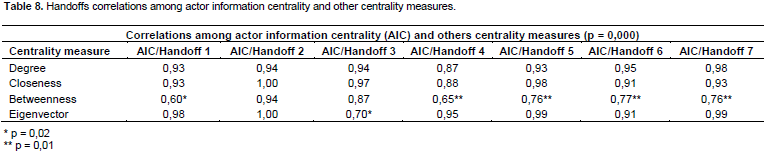
The actor information centrality measure shows very strong correlations with degree, closeness and eigenvector (p = 0.00) and strong correlation with betweenness measure (Table 8). The average correlation between these measures was 0.89 (0.10). The degree measure showed the lowest coefficient of variation between the handoff (3.5%), while betweeness measure showed the highest coefficient of variation (15.24%).
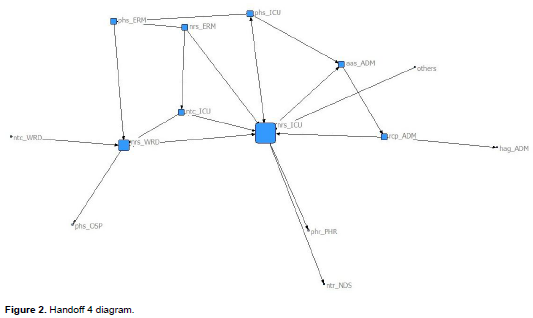
Inspecting the sociogram in Figure 2, it shows the structural position of actors involved in handoff 4. The nrs_ICU stands on structural position, followed by nrs_WRD. Asymmetric relationships predominate between the actors. There has been no information exchange with the patient or the patient's family member.
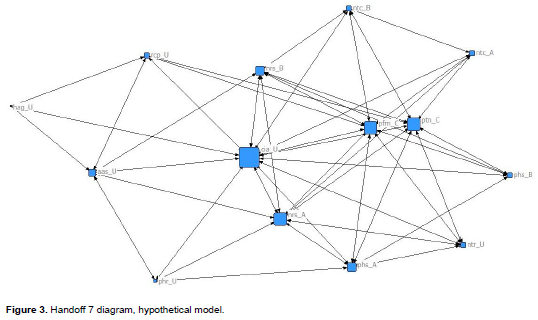
Inspecting the sociogram in Figure 3, it shows the structural position of actors involved in handoff 7. The cia_U stands on structural position, followed by nrs_WRD, ptn_U and pmf_U. Symmetry relations predominates between the actors. The cia_U exchanges information with all network actors.
An interpretation of these results for practical applications in transitions of care follows in the next session.
DISCUSSION
Works on the care transition of inpatient in hospitals to outpatient clinics indicate benefits for patients with actors in the intermediation role of this transition. There has been a statistically significant reduction in the rate of hospital readmission in four studies whose intermediation role in care transitions of inpatient to outpatient care has been performed by a single categorical role exclusively. In the systematic literature review there has not been found data on the costs of the intervention, contextual factors and a long-term plan for the deployment of an intermediation agent (Rennke et al., 2013).
The nurse stood out as the main categorical role involved in processes of information exchange intermediation in the handoffs, in five of the centrality measures applied in this survey. This observation is consistent to the systematic literature review as in Rennke et al. (2013). Other categorical role has also been identified in literature as integration agent, such as the pharmaceutist.
Connectivity unites several agents into a common action (Marcus and Henderson, 2006). Connectivity, for example, as a network of juxtaposed people, can facilitate a more secure handoff. Inspection of Figure 2 reveals the fragility of the connections between the actors and contrasts with the high levels of connectivity among the actors in the model of Figure 3. The handoff 4 has had the lowest mean score of satisfaction. It meets the assumption of Kerby et al. (2005): a system with adequate resources does not ensure, by itself, a properly functioning system, without certain threshold of connectivity. Note that, in Figure 2, most of the relationships among the actors are asymmetric; the actors are positioned more on the periphery of the network and express low connectivity. Structural analysis of handoff 4 identifies the nrs_ICU as an influential actor. The dependence of this only actor may have jeopardize the social capital in the handoff so that there has not had an effective organization to generate a safer handoff, whose satisfaction level, in this instance, has been the lowest among the six handoffs .
The betweenness measure ordains the actors in terms of their individual importance in handoffs, but it does not make clear beforehand how it exerts its influence on the handoff. The lack of correlation between this measure and the average level of satisfaction in the handoffs meets the interest of researchers on how this influence occurs. Understanding the social structure of handoffs may contribute to drive objectives that ensure better performance in the care transition.
The analysis of structural features in handoffs has identified a categorical role, the nurse's origin unit, with high centrality and represented the only link among the others actors. The handoffs become vulnerable by relying on a single actor to the formal connections between subgroups of actors and, sometimes, personal interests of the most central actor can surpass the interests of the subgroups. In Figure 3, despite the cia_U has had the highest centrality of network, alternative routes by which the information flow processes can be observed. In particular, routes that involve the patient, or their relatives, are favorable to the observations that the involvement of these actors is important for reducing errors during transitions of care (Rennke et al., 2013).
The existence of gaps in care transitions can contribute to the success or failure in the transition strategy. Among the failures, for example, improper selection of information (not relevant), heterogeneity in categorical roles and type of patient involved (Rennke et al., 2013). In six handoffs analyzed, the improper selection of information emerged as the main failure, followed by the absence of electronic system to disseminate information.
The formation of a team to implement a handoff should reduce the risk for an improper care transition of a patient. A balanced configuration between the actors of the subgroups may be more appropriate to ensure a better setting and better team performance. Connections are an expression of how social capital provides access to information (Ferriani et al., 2009). These characteristics seem more likely to occur in a network configuration model handoff 7 than in the configuration of handoff 4.
The leadership of handoff by the actor with the highest centrality may be more likely to succeed in the transition of care. However, there may be a potential disadvantage in exposure excess within the network. As you increase the connectivity of an actor in the network, the benefits of higher degrees of centrality decreases (Sampson, 2005; Owner-Smith and Powell, 2003; McFadyen and Canella, 2004).
The disparity in the actors´ centrality also helps to increase the inefficiency of information flow in closed systems (Yamaguchi, 1994). In Table 3, for example, the gap can be seen among the similar categorical roles in the units (nrs_ICU, nrs_WRD, nrs_ERM; phs_ICU, phs_ERM, phs_OSP; ntc_ICU, ntc_WRD). The same phenomenon occurs when analyzing the data in tables 2, 3, 4 and 5.
Table 6 illustrates that the actor information centrality measure can discriminate numerically the various actors. This measure, whose interpretation resembles the concept of closeness, showed strong correlations with degree, closeness and eigenvector measures. These three measures, however, showed less ability to discriminate actors among themselves (Tables 2, 4 and 5). Regarding the betweenness measure, the correlation with the actor information centrality measure is strong and shows less efficient to discriminate actors among themselves. However, the betweenness has provided the largest discrepancies among the intermediation potentiality of the actors, so it makes the actors with greater intermediation power visible. The eingenvector measure has had the highest correlation of measures with the actor information centrality measure. Both measures are different perspectives of simpler measures (degree and closeness, respectively). The strong correlation among these five measures of centrality suggests redundancy, and also agrees with literature (Valente, 2008).
Recent research seeking new centrality measures to better characterize the actors of the social networks, given the limitation of classical centrality measures (degree, betweenness and closeness) to identify the actors capable of initiating collective action on the social network in which they are inserted (Kim et al., 2012; Ramon et al., 2012; Yan et al., 2013 ). The hypothetical model suggests mediation by an integration agent to establish an optimal number of connections needed or feasible, to ensure secure flow of information about patients, among sectors of a hospital environment.
The initial assumption of the model that all relationships are symmetric contrasts the relationships between patterns of handoffs 4 and 7 (Figures 2 and 3). Assuming the model of handoff 7 is correct, i.e., in accordance with the laws of nature and not of arbitration, nor without insufficient assumptions; also assuming it's the most complete model compared to other existing models, its utility will not depend on the model itself, but especially of those who use it and for what purpose. Therefore, any model, regardless of being an innovation, will not ensure effectiveness (Merton, 2013). Applying this assumption to handoffs brings speculation about what variables affect on the handoff effectiveness.
CONCLUSION
In the context of this research, it could be considered that, among health professionals, the nurse provides the largest number of connections necessary or feasible, to facilitate a safe information flow about patients, among sectors of a hospital environment.
The nurse of the origin unit of handoff emerges as the categorical role with the greatest popularity (degree, eingenvector), greatest influence or control (betweenness) and the best access to information on the handoff (closeness, actor information centrality). A categorical role, important for an integration action in care transitions, shows up. The patient or his family even appears as central actor in the handoff, which contradicts the concept of patient-centered medicine.
The correlations among the five-centrality measures have been very strong, but the actor information centrality measure has been more effective to differentiate the level of centrality among actors. There has not been significant correlation (with p = 0.05) among these measures and the average level of satisfaction with the handoff.
In literature, there is a lack of studies to assess the level of evidence of the strategies effectiveness for the prevention of adverse events, in the information exchange of patients, through a clinical integration agent. Therefore, it is adequate the development of research to obtain information on contextual factors, on the implementation and costs of strategies interventions related to care transitions, such as the insertion of the clinical integration agent.
Specific interventions on the quality of information exchange in the handoffs, such as patient monitoring, recommendations, patient and family education, medical reconciliation and follow-up have not been studied. This represents a limitation of this study, despite having been asked to the respondents their level of satisfaction with the handoff. Another limitation lies with the fact that the sample does not have significant power to detect important differences among the analyzed handoffs and the hypothetical model.
CONFLICT OF INTERESTS
The authors have not declared any conflict of interests.
REFERENCES
|
Amaral L, Scala A, Barthélémy M, Stanley HE (2000). Classes of small world networks. Proc. Natl. Acad. Sci. 97(21):11149 -111152. http://www.pnas.org/content/97/21/11149.long |
|
|
|
|
|
Bodin O, Crona BI (2008). Management of natural resources at the community level: Exploring the role of social capital and leadership in a rural fishing community. World Dev. 36(12):2763-2779 |
|
|
|
|
|
Bonacich P (2007). Some unique properties of eigenvector centrality. Soc. Networks 29:555-564. |
|
|
|
|
|
Borgatti SP, Jones C, Everett M (1998). Network measures of social capital. Connections 21(2):27-36. |
|
|
|
|
|
Borgatti SP (2005). Centrality and network flow. Soc. Networks 27:55-71. |
|
|
|
|
|
Borgatti SP, Everett MG (2006). A graph-theoretic perspective on centrality.Social Networks 28:466-484. |
|
|
|
|
|
Borgatti SP, Everett MG, Freeman LC (2002). UCINET Version 6.415. Harvard, MA: Analytic Technologies. |
|
|
|
|
|
Borgatti, SP, Foster PC (2003). The network paradigm in organizational research. A review and typology. J. Manage. 29(6):991-1013. |
|
|
|
|
|
Brandes U (2008). On variants of shortest-path betweenness centrality and their generic computation. Social Networks 30:36-145. |
|
|
|
|
|
Coleman JS (1988). Social capital in the creation of human capital. Am. J. Sociol. 94:95-120. |
|
|
|
|
|
Coleman JS (1990). Foundations of social theory. Cambridge, MA: Harvard University Press. |
|
|
|
|
|
Dorn BC et al (2007). Development of a survey instrument to measure connectivity to evaluate national public health preparedness and response performance. Public Health Rep. 122:329-338 |
|
|
|
|
|
Faugier J, Sargeant M (1977). Sampling hard to reach populations. J. Adv. Nurs. 26:790-797. |
|
|
|
|
|
Farrell LC, Fudge J (2013). An exploration of a quasi-stable online network: A longitudinal perspective. Comput. Hum. Behav. 29:681-686. |
|
|
|
|
|
Ferligoj A, Hlebec V (1999). Evaluation of social network measurement instruments. Soc. Networks 21: 111-130. |
|
|
|
|
|
Ferriani S, Cattani G, Badden-Fuller C (2009). The relational antecedents of project-entrepreneurship: network centrality, team composition and project performance. Res. Policy 38:1545-1558 |
|
|
|
|
|
Frank O, Snijders T (1994). Estimating the size of hidden populations using snowball sampling. J. Official Stat. 10(1): 53-67. |
|
|
|
|
|
Frank O (2002). Using centrality modeling in network surveys. Soc. Networks 24:385-394. |
|
|
|
|
|
Freeman LC (1979). Centrality in social networks: cnceptual clarification. Soc. Networks 1:215-239. |
|
|
|
|
|
Goodman LA (1961). Snowball sampling. Ann. Math. Stat. 32:148–170. |
|
|
|
|
|
Hall J, Moore S, Shiell A (2010). Assessing the congruence between perceived connectivity and network centrality measures specific to pandemic influenza preparedness in Alberta. BMC Public Health 10:124-132. |
|
|
|
|
|
Hossain L, Wu A (2009). Communications network centrality correlates to organizational coordination. Int. J. Project Manage. 27:795-811 |
|
|
|
|
|
Jackson MO, Wolinsky A (1996). A strategic model of social and economic networks. J. Econ. Theory 71:44-74. |
|
|
|
|
|
Kerby DS et al (2005). Are public health workers aware of what they don't know? Biosecur Bioterror 3(1):31-38. |
|
|
|
|
|
Kim HM, Lee D, Feiock RC (2012). Network power and militarized conflicts. Armed Forces Soc. 38(2):291-317. |
|
|
|
|
|
Kolaczyk ED, Barthélemy DBC (2009). Group betweenness and co-betweenness: Inter-related notions of coalition Centrality. Soc. Networks 31:90-203. |
|
|
|
|
|
Marcus LJ, Dorn BC, Henderson JM (2006). Meta-leadership and national emergency preparedness: A model to build government connectivity. Biosecur Bioterror 4(2):128-134. |
|
|
|
|
|
McFadyen MA, Cannella Jr AA (2004). Social capital and knowledge creation: diminishing returns of the number and strength of exchange relationships. Acad. Manage. J. 47(5):735–746. |
|
|
|
|
|
Merton RC (2013). Innovation Risk: How to Make Smarter Decisions. Harvard Bus. Rev. p.10 |
|
|
|
|
|
Mizruchi MS, Potts BB (1998). Centrality and power revisited: actor success in group decision making. Soc. Networks 20:353-387 |
|
|
|
|
|
Owen-Smith J, Powell W (2003). The expanding role of university patenting in the life sciences: assessing the importance of experience and connectivity. Res. Policy 32(9):1695–1711. |
|
|
|
|
|
Parker A, Cross R, Walsh D (2001). Improving collaboration with social network analysis – leveraging knowledge in the informal organization. Knowl. Manage. Rev. 4(2):24-28. |
|
|
|
|
|
Pozo M et al (2011). Centrality in directed social networks. A game theoretic approach. Soc. Networks 33:191-200 |
|
|
|
|
|
Ramon et al (2012). Networks and collective actions. Soc. Networks 34:570-584. |
|
|
|
|
|
Rennke S et al (2013). Hospital-initiated transitional care interventions as patient safety strategy: a systematic review. Ann. Internal Med. 158:433-440. |
|
|
|
|
|
Sampson RC (2005). Experience effects and collaborative returns in R&D alliances. Strat. Manage. J. 26(11):1009-1031 |
|
|
|
|
|
Stephenson K, Zelen M (1989). Rethinking centrality: Methods and examples. Soc. Networks 11:1-37. |
|
|
|
|
|
Uzzi B, Spiro J (2005). Collaboration and creativity: the small world problem. Am. J. Sociol. 111:447–504. |
|
|
|
|
|
Valente TW (2010). Social Networks and Health: Models, Methods and Applications. New York: Oxford University Press. |
|
|
|
|
|
Valente et al (2008). How correlated are network centrality measures? Connect (Tor) 28(1):16-26. |
|
|
|
|
|
Veltri GA (2013). Information flows and centrality among elite european newspapers. Eur. J. Commun. 27(4):354-375 |
|
|
|
|
|
Wachter RM (2012). Understanding Patient Safety. San Francisco: McGraw Hill Lange. |
|
|
|
|
|
Wasserman S, Faust K (1994). Social network analysis. Cambridge: Cambridge University Press. |
|
|
|
|
|
West et al (1999). Hierarchies and cliques in the social networks of healthcare professionals: implications for the design of dissemination strategies. Social Science & Medicine 48: 633-646 |
|
|
|
|
|
Wuchty S, Stadler PF (2003), Centers of complex networks. J. Theoret. Biol. 223:45-53. |
|
|
|
|
|
Yan X, Zhai L, Fan W. C-index (2013). A weighted network node centrality measure for collaboration competence. J. Informetrics 7:223-239. |
|
|
|
|
|
Yamaguchi, K (1994). The flow of information through social networks: diagonal-free measures of inefficiency and the structural determinants of inefficiency. Soc. Networks 16:57-86. |
|
|
|
|
|
Zemiljic B, Hlebec V (2005). Reliability of measures of centrality and prominence. Soc. Networks 27:73-88. |
|
Copyright © 2024 Author(s) retain the copyright of this article.
This article is published under the terms of the Creative Commons Attribution License 4.0


