ABSTRACT
This paper follows an empirical approach to test the relationship between degree of intangible assets and profitability. It is important for shareholders to understand which critical factors influence firms’ financial performance. All the data are based on 17 listed telecommunication firms’ financial statements in China from 2014 to 2016. This study gives empirical evidence that intangible assets’ ratios have positive and significant effect on firms’ financial performance, measured by Return on Assets (ROA). As a result, the central tendency of samples’ intangible assets ratios would be a reference intangible assets ratio range for other telecommunication firms. The limitation in measuring intangible assets is the difference between intangible assets reported in financial statements and measured by the market value minus its book value. Although in this study, the intangible assets follow current Chinese accounting standards rules, the difference does not influence the result.
Key words: Intangible assets, financial performance, intangible assets ratio, return on assets (ROA).
According to the definition of asset, assets are future economic benefits controlled by the entity as a result of past transactions or other past events. The intangible asset can also bring benefits to entity. In the Chinese accounting standards, intangible assets include patents, copyright, franchise and land-use right. They are the companies’ competitive advantage and hard to imitate. Andonova and Ruiz-Pava (2016) stated that the mechanisms to establish sustainable competitive advantage based on intangible assets might be absent in emerging countries. Therefore, the relationship between intangible assets and the companies’ performance should have positive correlation, if there is a mature market structure in China. Marrocu et al. (2012) stated that in the most advanced developed industrial economies, there is a strong relationship between economic performance and intangible assets. Although in the 2016 Doing Business ranking taken by the World Bank, China ranks 5th out of 188 in enforcing contract (World Bank, 2016), can China be confirmed as advanced industrial economy?
In the advanced industrial economy, patents, copyright, franchise and land-use right are protected by property right. Companies owned their intangible assets and can make use of them as competitive advantages and get more revenue from them. However, in the developing industrial economies, Hoskisson et al. (2000) claimed that good relations with local government and relationship-based management are real competitive advantages for companies in those countries. There is an assumption that if in China, intangible assets owned by companies can promote companies performance better than tangible assets, the market structure is competitive and mature. To measure the degree of intangible assets in a company, intangible assets ratio was used in this study (intangible assets divided by total assets). To measure the company’s performance, the financial indicator return on asset (ROA) was selected, because ROA shows how profitable, a company’s assets are in generating revenue.
The total asset turnover is used to evaluate both the business performance and financial position (Zager et al., 2008). Furthermore, return on assets (ROA) and net profit margin are always considered together, because the net profit margin has a direct impact on return on asset (Gibson, 2013). If intangible asset ratios of sample firms in China are in the reasonable range and shows a strong positive correlation with ROA, it indicates intangible asset can promote company’s performance and can make more income than tangible assets. On the other hand, if intangible assets ratios of sample firms in China are highly correlated with ROA and the correlation is positive, it shows that the central tendency of these intangible assets ratios are a good ratio range and can be a reference ratio range for others in the same firms. Firms can balance their intangible and tangible assets by the reference intangible asset ratio range in order to get an optimal assets structure.
Intangible assets
Under IFRF (International Financial Reporting Foundation, 2004) of IAS 38 (International Accounting Standard), intangible asset is an identifiable non-monetary asset without physical substance. Hence, intangible assets are future economic benefits controlled by the entity as a result of past transactions or other past events, but just do not have a physical form. According to the International Accounting Standard (IAS) 38, intangible assets include patented technology, computer software, licensing, franchise agreements and trademarks, etc. However, according to People's Republic of China Generally Accepted Accounting Principles (PRC GAAP), trademarks can be recognized only if the trademarks are purchased from external. However, land use rights are realized as intangible asset in China. But the different recognition would not influence the research in this study. Firstly, most scope of intangible assets is similar between PRC GAAP and IAS. Secondly, land use rights just account for a small proportion in listed telecommunication companies in China. Intangible assets reflect core competitive competence of firms. Tsai et al. (2012) stated that intangible assets represent the future profitability and growth opportunities that promote increasing firm value.
Intangible assets and company’s performance
Riahi-Belkaoui (2003) stated that intellectual capital of sampled multinational companies in USA is positively associated with their financial performance. Megna and Klock (1993) found that the intangible assets can contribute to the value of Tobin’s Q. Lantz and Sahut (2005) stated that there is a positive correlation between R&D expenditures and firm’s market value. Erawati and Sudana (2005) revealed that intangible assets would affect the firm’s financial performance which is reflected in firm’s return and income. Appelbaum et al. (2017) stated that intangible assets affect agility and business performance as well. Kothari et al. (2002) found that when R&D expense increases, the firms’ future earning will increase as well.
Hypothesis
H1: Intangible assets presented in the financial report grow faster than tangible assets in listed telecommunication companies in China. In advanced industrial countries, intangible assets play a key role in creating companies’ competitive advantages (Hoskisson et al., 2000). If firms in China invest more resources on intangible assets than tangible assets in their business strategies, it reveals China is becoming an advanced industrial economy and has competitive market structures. H2: Intangible assets ratio affects financial performance. There is an assumption that in China, the listed telecommunication companies with higher degree of intangibility (the degree is in a reasonable range) would get more profitability. If there is a positive correlation between the degree of intangibility with ROA, based on the data of samples, the central tendency of these intangible asset ratios could be the reference ratio range for other telecommunication companies in China, in order to balance intangible and tangible assets.
Data and measures
This essay uses public financial data from listed telecommunication firms’ annual financial report in China from 2014 to 2016. All the data comes from Sina Finance (1996-2017). The type of industry selected is telecommunication, because intangible assets in these firms are more obvious than other industries in common sense. In order to avoid the influence of firms’ scale, the total assets of sample firms are between ï¿¥3 billion and ï¿¥7 billion. According to China Securities Regulatory Commission (CSRC) industry classification, there are 40 firms which belong to telecommunication industry. Only 26 telecommunication firms have total assets between ï¿¥3 billion and ï¿¥7 billion. Based on simple random sampling, the size of sample in this essay is 17 listed telecommunication firms. All the data of intangible assets, total assets and ROA are from their annual public financial reports from 2014 to 2016. Therefore, there are 51 samples in this essay.
Variables
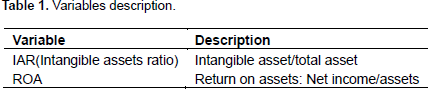
Profitability is measured by the ROA. One reason is that ROA is an indicator often used in accounting to evaluate the performance of companies. Other reason is that ROA can indicate how many dollars of earnings they derive from each dollar of asset they control. If high degree of intangibility are associated with high ROA, it shows intangible assets in these companies can earn more profit than tangible assets. The degree of intangibility is measured by dividing intangible assets by total asset. It can be referred to as intangible assets ratio (Table 1).
Hypothesis 1 tests
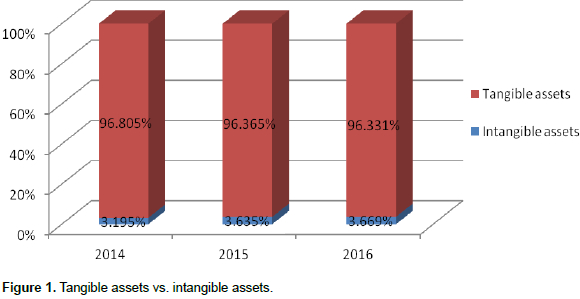
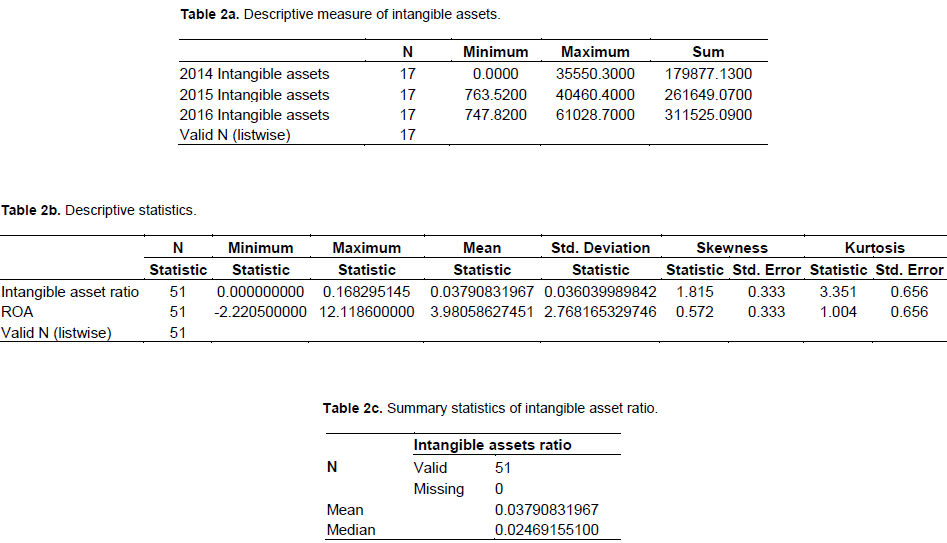
According to the data of finacial report of sample firms (Figure 1), the percentage of intangible assets increased from 3.195 to 3.669%, in the period of 2014 to 2016. It indicates that listed telecommunication companies invest more percentage of intangible assets and decrease the propotion of tangible assets in recent years, in order to create competitiveness and get more profit in the future. Hence, hypotheis H1 is confirmed (Table 2a). Table 2b illustrates the main descriptive statistics measures. The mean of intangible assets ratios is 0.0379. The standard deviation of intangible asset ratio is 0.036. Because the skewness of intangible asset ratio is >0, the mass of the distribution is concentrated on the left of the figure. Therefore, the median of intangible asset ratio is better than mean for measure of central tendency (Table 2c). The median of intangible asset ratio is 2.469% which stands for the central tendency of all samples’ intangible asset ratio, in the period from 2014 to 2016.

Hypothesis 2 tests
Results of regression analysis for H2
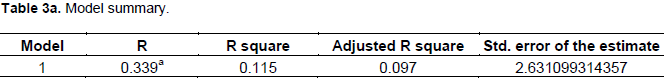
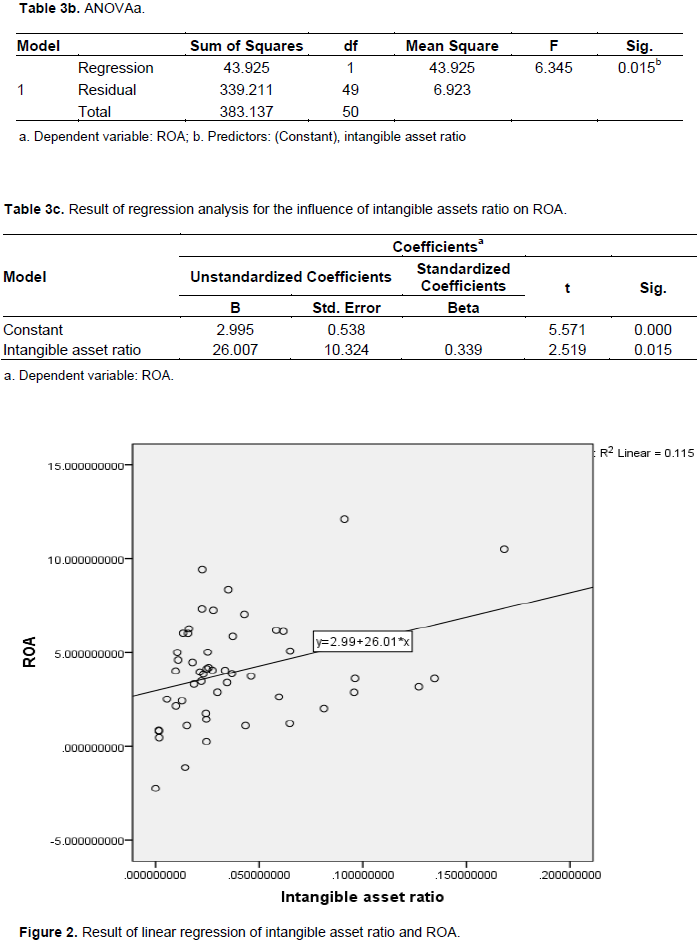
Table 3a shows that Intangible assets ratio and ROA have a correlation coefficient of 0.339 and determination coefficient r2=0.115, meaning that the given independent variable (intangible assets ratio) and dependent variable (ROA) together have 37% of common elements. Although, it is a low strength connection, there is just oneindependent variable. Hence,the correlation is still reasonable and meaningful (Table 3b and c). The influence of intangible assets ratio on ROA is indicated by the path coefficients 0.339 which means intangible assets ratios have positive effect on ROA. The obtained significance value 0.015< P value (0.05) means the positive effects are statistically significant. These indicate intangible assets ratios have positive and significant influence on ROA. These mean that the higher the intangible assets ratio, the more profitable a company’s assets are in generating revenue. This confirmed the hypothesis H2 that intangible assets ratio has a significant effect on ROA (Figure 2). Regression equation derived from the results of analysis:
ROA=2.995+26.007IAR
Although intangible asset ratio and ROA have a low correlation coefficient of 0.339 and determination coefficient r2 = 0.115, there is just one independent variable (intangible asset ratio) in this study. Hence, there is still a statistically significant positive correlation between intangible assets ratio and ROA (P<0.05). It means that in the scope of intangible assets ratio, from 0 to 16.83%, the higher intangible assets ratio, the higher the ability of total assets to generate revenue. But the positive correlation between intangible assets ratio and ROA is obtained, only because the range of all samples’ intangible assets ratio is reasonable. Consequently, using the central tendency of all samples’ intangible assets ratio as a reference ratio for other telecommunication firms in China is logical and meaningful. The distribution of intangible assets ratios are positive skew, as extreme values have a more effect on the mean than on the median, as shown in Figure 3.
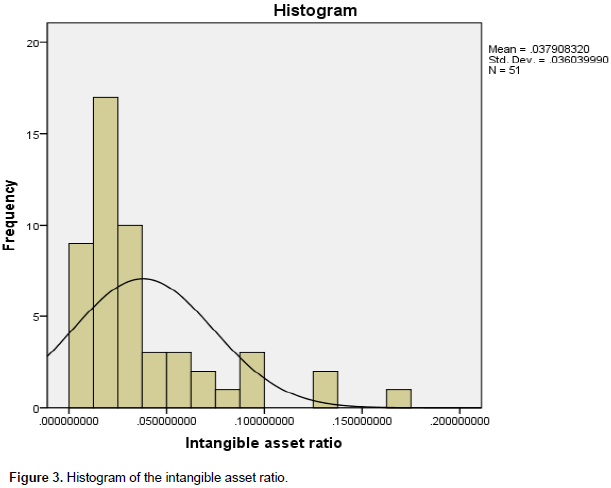
Both median and mean are the measure of central tendency. Therefore, the range from the median to mean of intangible asset ratio could be used as the range of reference ratio for other telecommunication companies. Therefore, in China, the scope from 2.469 to 3.791% is a reasonable intangible assets ratio range for telecommunication firms recently. There are two reasons why the range of intangible asset ratio is very low. One reason is that according to Chinese accounting standards, some types of intangible assets are not presented in any financial reports, such as reputation, employment contracts, distribution and trademarks which are generated internally. Another reason is that the data of intangible assets used in this study is reported in the balance sheet of the listed companies and is not determined by comparing the market value with its book value (Kok, 2007).
This paper examines the influence of intangible assets on firms’ financial performance. The result of the regression model demonstrates that intangible assets ratio has positive and significant effect on ROA for listed telecommunication companies in China. The higher investment in intangible assets, the higher the ability of total assets to gain revenue. This result supports previous research that intangible assets have positive and significant effect on firms’ performance. It also confirms that the market structure of China is competitive and mature. However, the previous studies are mainly focused on companies in Europe and North America. At last, the range of central tendency of intangible assets ratios is used as reference ratio range for other listed telecommunication companies in China.
The author declares that there is no conflict of interests.
REFERENCES
|
Appelbaum SH, Calla R, Desautels D, Hasan L (2017). The challenges of organizational agility (part 1). Ind. Commer. Train. 49:6-14.
Crossref
|
|
|
|
Andonova V, Ruiz-Pava G (2016). The role of industry factors and intangible assets in company performance in Colombia. J. Bus. Res. 69:4377-4384.
Crossref
|
|
|
|
|
Erawati NMA, Sudana IP (2005). Intangible Assets, Company Values, and Financial Performance.
|
|
|
|
|
Gibson CH (2013). Financial Statement Analysis – 13th edition, South-Western, Cengage Learning.
|
|
|
|
|
Hoskisson RE, Eden L, Lau CM, Wright M (2000). Strategy in emerging economies. Acad. Manage. J. 43(3):249-267.
Crossref
|
|
|
|
|
IFRF – International Financial Reporting Foundation (2004). International Accounting Standard N.º 38 – Intangible Assets. Accessed June, 2017,
View
|
|
|
|
|
Kok A (2007). Intellectual capital management as part of knowledge management initiatives at institutions of higher learning. Electronic J. Know. Manage. 5(2):181-192.
|
|
|
|
|
Kothari SP, Laguerre TE, Leone AJ (2002). Capitalization versus Expensing: Evidence on the Uncertainty of Future Earnings from Capital Expenditure versus R&D Outlays. Rev. Account. Stud. 7:355-382
Crossref
|
|
|
|
|
Lantz JS, Sahut JM (2005). R & D Investment and the Financial Performance of Technological Firms. Int. J Bus. 10(3): 251-270.
|
|
|
|
|
Marrocu E, Paci R, Pontis M (2012). Intangible capital and firms' productivity. Ind. Corp. Change 21:377-402.
Crossref2
|
|
|
|
|
Megna P, Klock M (1993). The Impact of Intangible Capital on Tobin's q in the Semiconductor Industry. The American Economic Review. Papers and Proceedings of the Hundred and Fifth Annual Meeting of the American Economic Association (May). Am. Econ. Assoc. 83(2):265-269.
|
|
|
|
|
Riahi-Belkaoui A (2003). Intellectual capital and firm performance of US multinational firms: A study of the resource-based and stakeholder views. J. Intellect. Cap. 4(2):215-226.
Crossref
|
|
|
|
|
Sina Finance (1996-2017). Sina Stock Market Center. Accessed June, 2017,
View
|
|
|
|
|
The World Bank (2016). "Economy Rankings." Doing Business. Accessed June, 2017, http://www.doingbusiness.org/rankings
Crossref
|
|
|
|
|
Tsai CF, Lu YH, Yen DC (2012). Determinants of intangible assets value: The data mining approach. Els. Sci. Publishers B. V., pp.67-77.
Crossref
|
|
|
|
|
Zager K, Mamic SI, Sever S, Zager L (2008). Analiza financijskih izvjestaja, Masmedia, Zagreb.
|
|