This article aimed at analyzing the relationship between foreign direct investments from China and the international trade of African countries. International trade was found to be affected by the degree of openness of the economy, the level of exports and the level of imports. The findings were brought out by using a Vector Error Correction Model in a cylindrical panel of 52 African countries on a period going from 2000 to 2015. The three main findings were: There was a two-way relationship between foreign direct investment and international trade; foreign direct investment had a strong positive influence on international trade; trade exerted a weak and negative influence on foreign direct investment. Thanks to this study, it was indicated to recommend that alternation be sought by African heads of states through transparent elections to guarantee political stability necessary to attract foreign direct investment.
In 1955 at the Bandung conference in Indonesia, the first diplomatic contact between China and Africa was made. Relations have since become tighter and China has become the largest trading partner for Africa. At this time, Outward Foreign Direct Investment (OFDI) of China was supported by central governments (UNCTAD, 2007). China has continued since this period to support African countries. Chinese investment in Africa has increased dramatically in the last 15 years (MOFCOM, 2017). This increase of investment in Africa is part of a growing social, economic and political cooperation between China and Africa; indeed, the relationship is embodied in the Forum on China-Africa Cooperation (FOCAC). Since the year 2003, cooperation between China and Africa has been growing considerably. China’s total OFDI to Africa stood at $4,875.41 million in 2015 (MOFCOM, UNCTAD and Author’s imputation data, 2017). In 2008, the Statistical Bulletin of China’s OFDI showed that China invested in 45 of 54 African countries during the period 2003 to 2008. Africa came third behind Latin America, accounting for 6.9 per cent of China’s total OFDI. In 2012, the Chinese department of trade published an agreement in which China was, under the direct investment, investing in different ways in Africa, allowing the African continent to take off in the fight against poverty and in the improvement of its economic growth; all benefits that aligned with the Millennium Development Goal set by the international community.
Chinese direct investment is well oriented in various sectors such as the extractive industries, trade, construction of road infrastructure and railway. A large share of FDI inflows to Africa goes to the primary and tertiary sector. In 2013 the share of world OFDI had overcharged three times more from 2.8% in 2008 to 3.2%. Africa had 2.7% (UNCTAD, 2014) of world OFDI and 23% of FDI coming from China ministry of commerce, which made china not only a donor, but also a backer, investor and contractor. In 2017, global foreign investment inflows increased by 38%in 2015 to $1,762 billion, up from $1,277 billion in 2014. The past decade witnessed a dramatic increase in FDI flows to developing countries except the year 2015. FDI flows to developing economies decreased to 9.5 percent in 2015 dipping to $765 billion; however, there is a high probability of growth over the next 10 years. This is welcome news, especially for some developing countries that do not have access to international capital markets. The African continent has received inflows of foreign investment for $ 54,079 million in 2015. The rapid growth of Chinese OFDI is likely to continue, particularly in services and in infrastructure industries. Relationships between FDI and trade are studied by several researchers. Some of them have found that there is a substitution effect between FDI and trade.
Others have concluded on complementarity between the two variables. Positive relationship between these variables has emerged in the literature in the recent years. Also we note that negative relationship has stand out. Certain authors have found that there is short run causality between FDI and trade and others have found a long run relationship between these variables. In addition to financial support through its FDI in Africa, China has kept tight commercial relations with the African market. The share of African market considered as sizeable, although not representing a high level on the international market. The place of Africa in the global economy accurately reflects its economic weaknesses. The share of Africa in world trade and foreign investment has never exceeded 4% between 1990 and 2016. The increase in the volume of trade is accompanied by rapid inflow of FDI in Africa. It is interesting to note that the main investors are also the major trading partners of Africa. The relationship between China and Africa has intensified since the beginning of the year 2001, with expansion of bilateral trade. We noted an increase of 16.5 percent in the Chinese exports in Africa from 2013-2015 and a decrease of 25.5 percent of African export to china from 2011 to 2015.

China-Africa bilateral trade
Currently, as international situation undergoes profound and intricate changes, newly emerging and developing economies have become the major force pushing forward the world’s economic development. China has become Africa’s largest trade partner, and Africa is now China’s major import source, second largest overseas construction projects contract market and fourth largest investment destination. China-Africa bilateral trade has been steadily increasing for the past 15 year, punctuated by a slight slump and quick recovery from the 2009 financial crisis (Chinese worked in Africa, China Africa Research Initiative 2017; http://www.sais-cari.org/). In 2016, the largest exporter to China from Africa was South Africa, followed by Angola and Sudan. South Africa is the largest buyer of Chines goods, followed by Nigeria and Egypt. Trade volume between China and African countries surged 16.8% year on year in the first quarter of 2017 to $38.8 billion (Said by the commerce ministry, Mofcom, May 11 2017; http://english.gov.cn/). This was the first quarterly rebound in bilateral trade between China and Africa since 2015, with Chinese imports from Africa up 46% to $18.4 billion (Press Conference by Sun Jiwen, spokesperson for the Ministry of Commerce, 2017). Chinese exports to Africa declined 1% year on year to $20.5 billion in the first three months of 2017, compared with an 18 percent drop in the same period in 2016. In the first quarterly 2017, Chinese enterprises made more than $750 million of non-financial DFI to African countries, up 64% year on year. Bilateral trade between China and Africa stood at $149.1 billion in 2016. Total China-Africa trade volume, China's export volume to Africa and China's import volume from Africa all reached new highs.
FDI and trade nexus
With specific regards to the recent rise of multinational enterprises from emerging economies, it is believed that their investments are ‘triggered by trade-related variables, which facilitate and necessitate OFDI (Banga, 2008). In China, Cheung and Qian (2008) add that the complementarity between FDI and exports has increased after the launch of the ‘Going Out’ strategy and that it is stronger for investments directed towards developing countries. Therefore, looking at the impact of trade on FDI, it is possible to assume that more exports on the one hand may require an improvement in trade supporting services and, on the other hand, providing knowledge on external markets may also reduce transaction costs of the investments and encouraging FDI. Imports, providing an indication of the importance of the products (mostly natural resources) transferred and may spur firms to internalize these strategic flows by means of OFDI.
This article investigates whether Chinese OFDI and international trade of Africa have causal relationship. This research is quantitative based and data is quantified by using Vector Error Correction Model (VECM). A model is designed to access the variables like trade, exports, imports, institution, gross domestic product, human capital and labor force. Secondary data is used for this research with the econometric methodology of cross country studies such as Wang and Qiang (2016), Gul and Naseem (2015) and Iqbal et al. (2015) to bring out the causal relationship among variables.
Data and variables
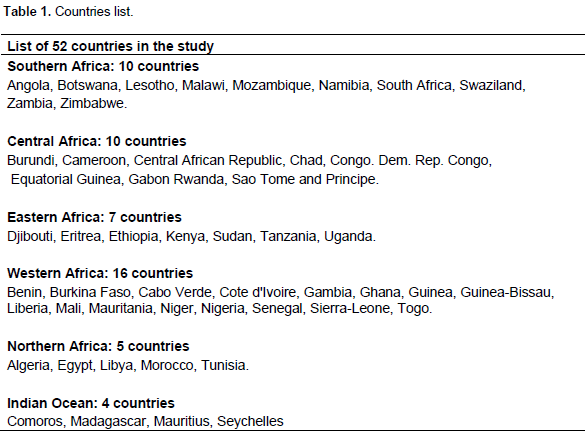
We have time series data of 16 years ranging from 2000 to 2015 taken from secondary source. All the data were collected from the database of United Nations (UN), World Bank, international monetary fund (IMF), Comtrade and MOFCOM 2016 and 2017. The 52 samples (Table 1) used in this study consist of African countries across six different regions that have consistent and available data of the period of investigation.

Dependent variable
Trade (sum of export and import), export and import are the dependent variable.
Independent Variable
Independent variables for this research study are outwards Chinese foreign direct investment (OCFDIA), institution (INST-P.S), institution (INST-C.C), gross domestic product (GDP), human capital (H), labor force (L), SouAfr, CenAfr, NorAfr, WestAfr, Indianocean and EastAfr written on right side of equation.
Theoretical framework
This theoretical framework shows the relationship between dependent variables (TRADE: EXP+IMP/GDP, EXP, IMP) and independent variables (L, H, INST-P.S, INST-C.C, OCFDI, SOUAFR, NORAFR, CENAFR, WESTAFR, INDOCEAN and GDP).
Trade (export-import)
Trade relates to the openness of the economy to the rest of world. Nonetheless, due to time shortage, series data for the measure of openness, the sum of import and export as a ratio of GDP is used as proxy trade. This is justified by arguing that the more a country is open to globalization, the more attractive it is to FDI. A priori, it’s expected that trade will be positively related to FDI.
Gross domestic product (GDP)
GDP is actually the measure of overall economy’s expenditures and output. GDP in real terms is a national income contributing towards economic growth by viewing the number of domestic products produces from domestic resources.
Institution (INST)
The institution variable is the political stability and absence of violence and control of corruption index from the World Institute Governance Indicators. It measures the extents which agents have confidence and abide by the rules of society, and in particular the quality of contract enforcement, property right, the police, and the courts, as well as the likelihood of crime and violence. The index runs from -2.5 to 2.5, with higher numbers signifying better institutions. This index broadly reflects the preceding theoretical arguments on the role of institutions in attracting Chinese OFDI which also regulate trade policy.
Labor force (L)
Labor force is the supply of labor services for the production of goods during a stipulated time period. It includes both employed and unemployed labor. When all labor force is fully employed the output ratio increase with appropriate allocation of resources. Labor force is the sum of two components, that is, population growth rate and employment opportunities.
Human capital (H)
Human capital is used as a proxy of level of education among different countries. Countries that have more educated people attract more FDI, and have more knowledge on doing business.
Outward Chinese foreign direct investment to Africa (OCFDI)
Foreign capital is the amount of Chinese OFDI to Africa. It represents market shares by foreign investors. Foreign investors buy local assets and domestic residents also. Foreign capital shows the balance of payment recording positive balance on capital account. Present study is intended to investigate the OCFDIA contribution on trade boosting from 2000 to onward.
Hypotheses development
H1: An increase of Chinese OFDI leads to an increase of the degree of economy’s openness.
H2: An increase of Chinese OFDI leads to an increase of exports.
H3: An increase of Chinese OFDI leads to an increase of imports.
Data analysis (econometrics techniques)
The hypotheses are sought out after many review of literature that are related to the topic, the model is specified and data is fitted into software known as Eview 9.0 for identifying whether OCFDI and Trade (Exports and Imports) are correlated positively. The model used is Vector Error Correction Model (VECM). The details of the model are outlined below:
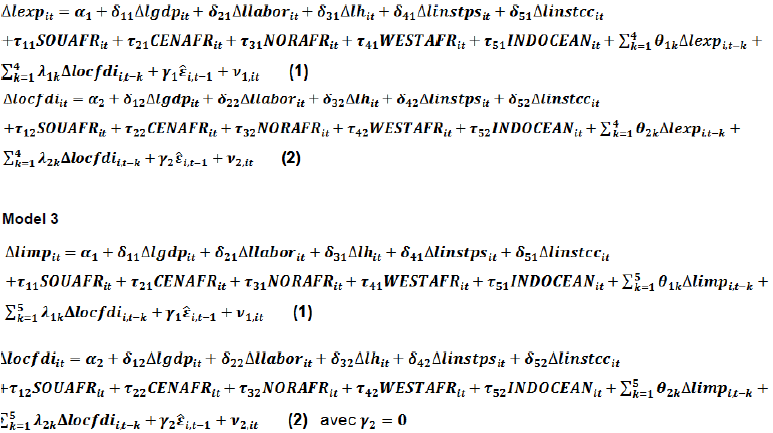
Equation for model
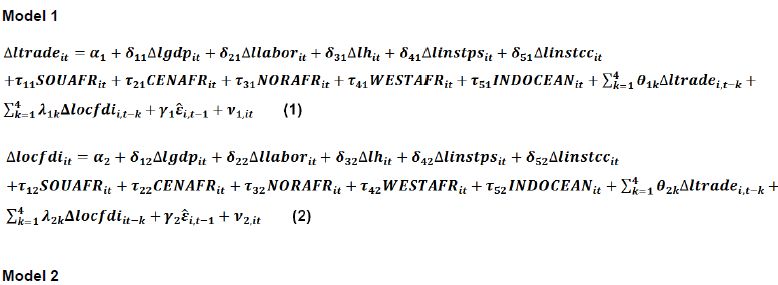
The three main equations are :

Where,
Trade = trade openness;
OCFDI = Outwards Chinese Foreign Direct Investment;
GDP = Gross Domestic Product;
H = Human Capital;
L = Labor force;
IMP = Imports goods and service (% of GDP);
EXP = Export goods and service (% of GDP);
INST-P.S = Political Stability and Absence of Violence;
INST-C.C = Control of Corruption;
SOUAFR = Southern Africa;
NORAFR = Northern Africa;
CENAFR = Central Africa;
WESTAFR = Western Africa;
INDOCEAN = Indian Ocean;
SOUAFR, NORAFR, CENAFR, WESTAFR, INDOCEAN are dummy variables that take the value 1 if a country belongs to the given sub-region and 0 otherwise.
Descriptive analysis
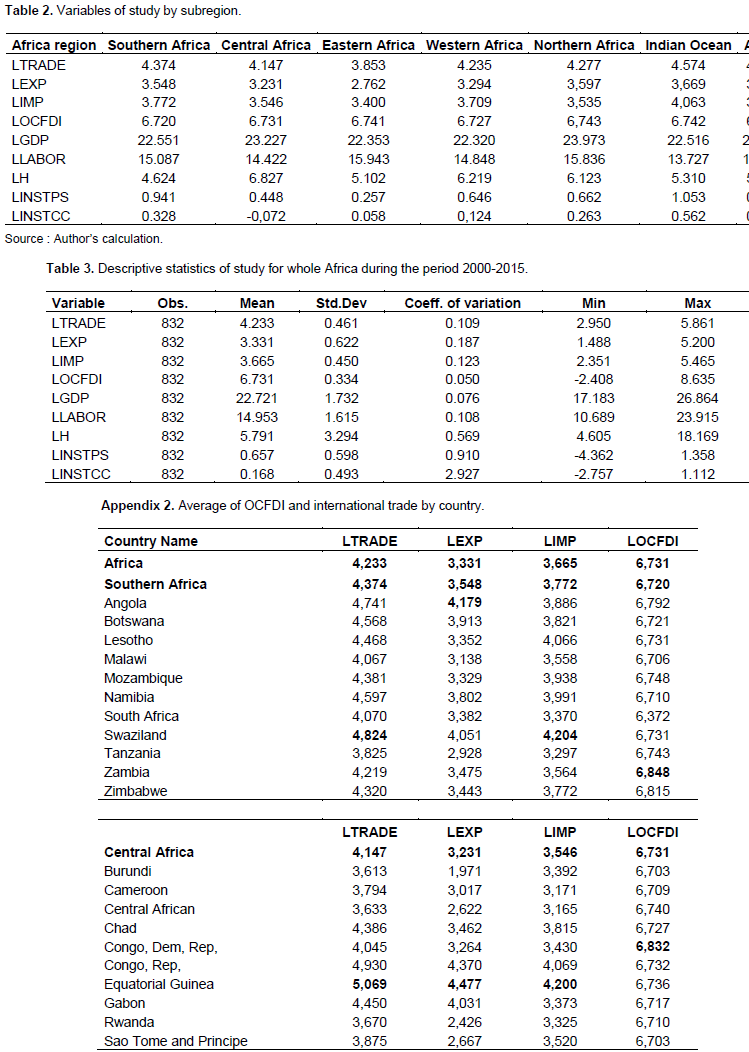
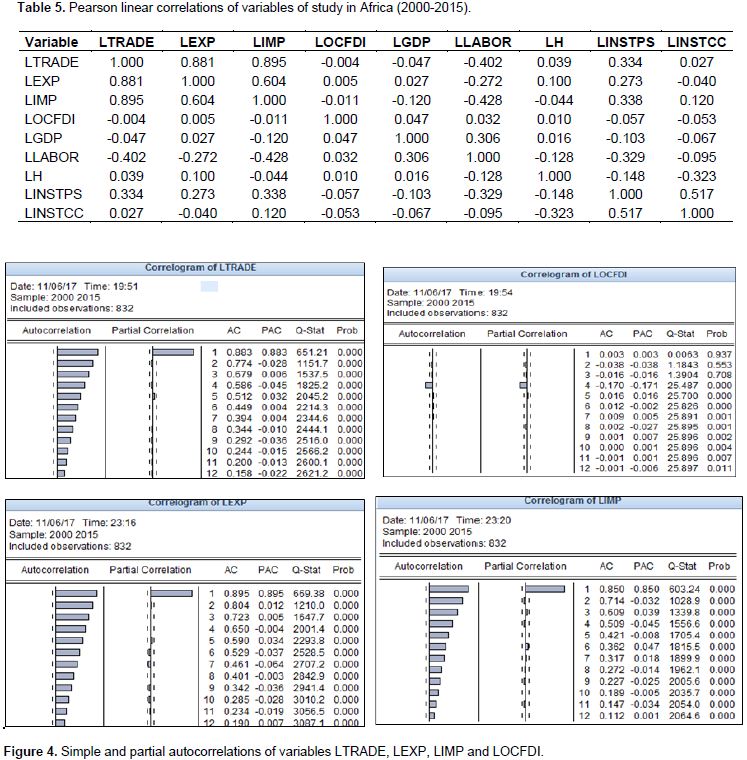
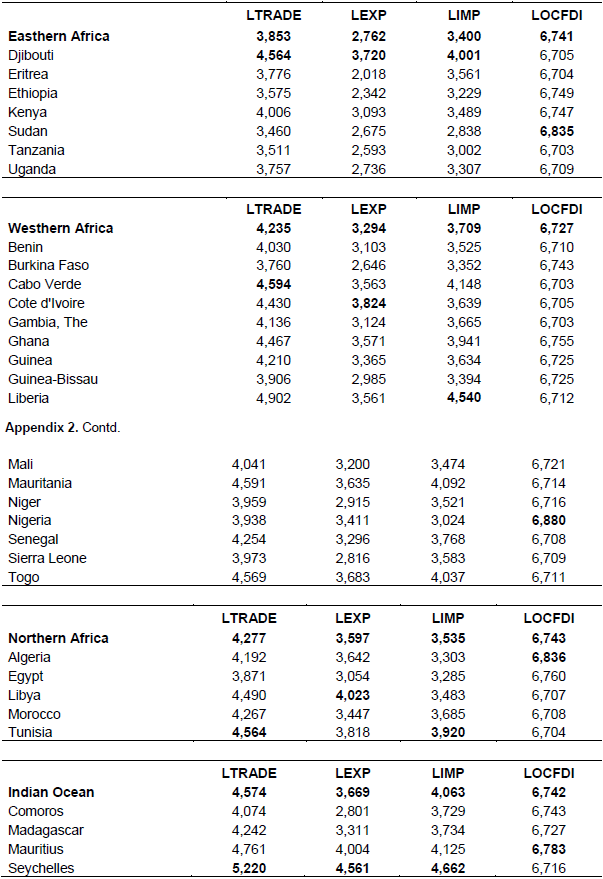
For all 832 observations (52 countries x 16 years), the most dispersed distributions are those related to the governance variables, which have the highest coefficients of variation (CV), 2,927 for the control of corruption, and 0.910 for political stability (Table 3). The panel is therefore sufficiently heterogeneous with regard to governance. Regarding the control of corruption, the Indian Ocean is on average the least corrupt zone (0.562) and Central Africa is the most corrupt (-0.072). For political stability, the Indian Ocean remains better (1.053) and East Africa is the most unstable (0.257) (Table 2). For international trade, the most homogeneous indicator is LTRADE with a coefficient of variation of 0.109, followed by LIMP (0.123) and LEXP, the most heterogeneous (0.187). Import behavior would be more similar than exports. Regarding FDI inflows from China, LOCFDI represents the most homogeneous distribution with a CV of 0.050. Its highest average sub-regional value is north Africa with 6,743 and the lowest is Southern Africa with 6,720 (Table 16 and Appendix 2). This shows a fairly low average gap (0.017) compared to the governance variables. The influx of FDI from China would therefore not be very different from one subregion to another.

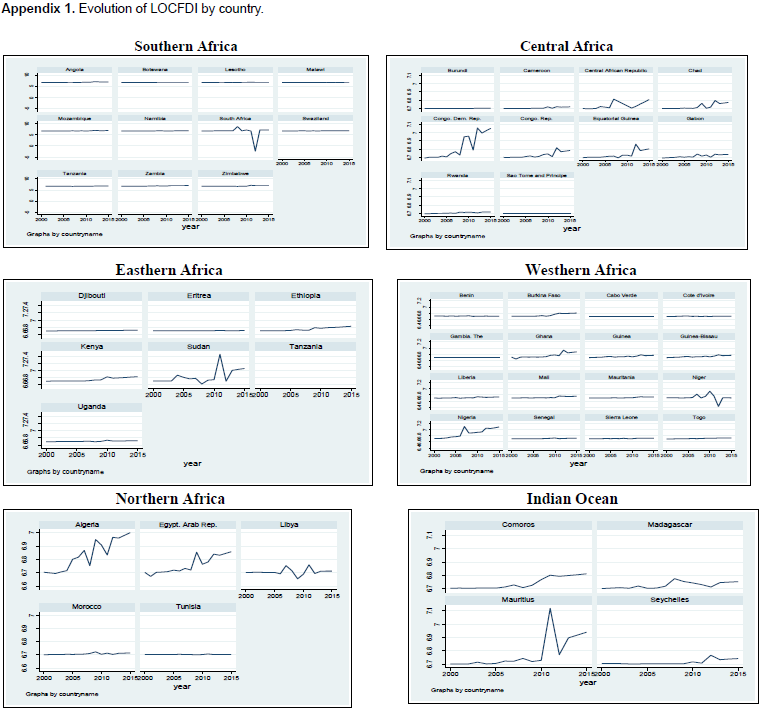
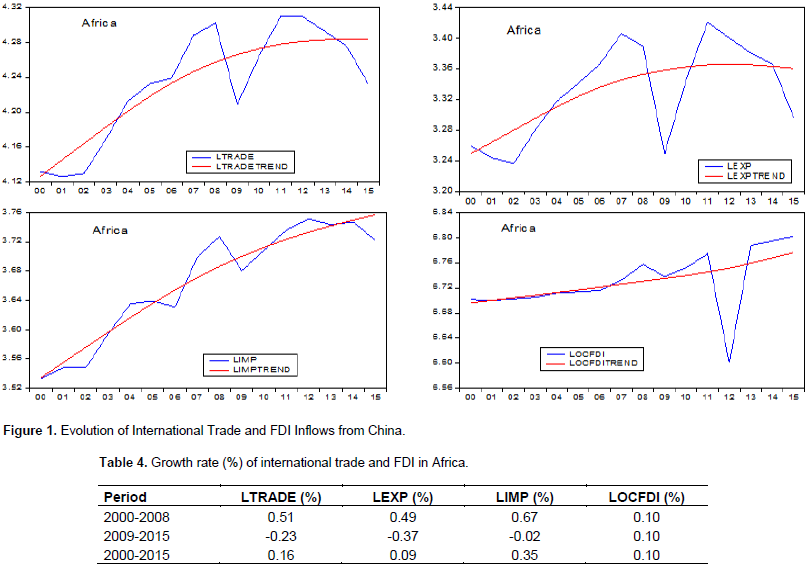
Trends of international trade and FDI flows from China
Figure 1 highlights the change in the average values ​​of the three variables informing international trade and FDI flows from China for the whole African continent. In terms of trend, we can say that LTRADE variable has globally evolved upwards, with a slight stagnation for the last three years. Thus, there is a significant shock in 2009 that materializes by a V-shaped trough. However, starting in 2012, there is a gradual decline. The level of LTRADE in 2015 is indeed similar to its 2005 value. The evolution of LEXP is similar to LTRADE. The LIMP trend is almost linear and increasing with a slight length cyclicity of 3 years. With regard to LOCFDI, the evolution is slightly linear and stagnant, with a vertiginous fall in 2012. This accidental variation is also observed in South Africa during the same year (Appendix 1). The trends of the four variables that define their long-term movements are obtained by applying the Hodrick-Prescott filter. Table 4 summarizes the evolution of these four variables. It can be seen that LOCFDI has almost stable evolution. Its growth rate is 0.10% for the two sub-periods 2000-2008 and 2009-2015. The international trade through its three indicators increased range from 2000 to 2015, 0.16% for LTRADE, 0.09% for LEXP and 0.35% for LIMP. However, they are decreasing during the period 2009 to 2015, for respective values of -0.23%, -0.37% and -0.02%. This implies that the commercial performance of the African continent fell overall between 2009 and 2015. This result is the most dependent on the fall in exports (-0.37% <-0.02%).

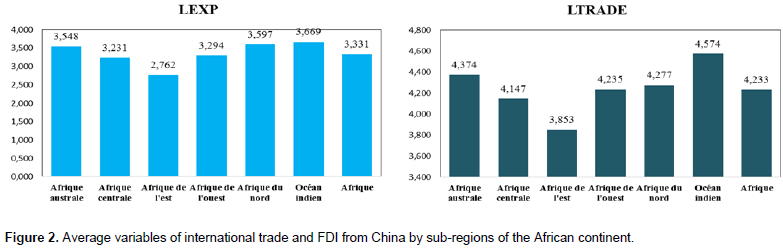
Comparison of average levels of international trade and FDI indicators by sub-regions of the African continent
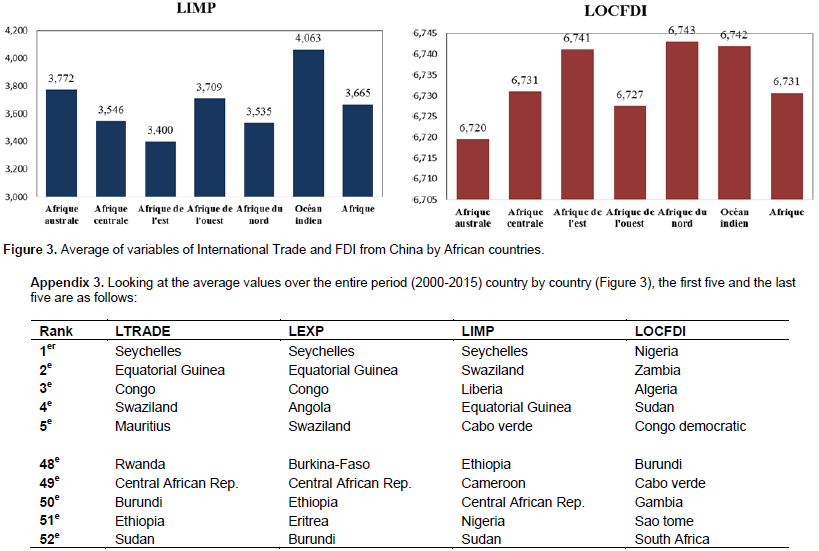
For the inter-regional comparison, looking at Figure 2, three sub-regions show practically better levels for LOCFDI. These include North Africa (6,743), the Indian Ocean (6,742) and East Africa (6,741). Southern African countries receive on average the least FDI, in this case (6,720), this is mainly attributable to South Africa, which has the lowest average (6,372) of the 52 countries in the study. For the three variables of international trade, the Indian Ocean has the highest values, 4,574 for LTRADE, 3,669 for LEXP and 4,063 for LIMP. East Africa has the lowest values (3,853, 2,762 and 3,400 respectively). These results would push us to say that at the sub-regional level, international trade is moving in the same direction as FDI.
Comparison of average levels of international trade and FDI indicators at the level of the countries of the African continent
Looking at the average values over the entire period (2000 to 2015) country by country (Figure 3), the first five and the last five are as follows (Appendix 3). In terms of country analysis, the strong regional correlation between international trade and FDI from China is not fully confirmed. We are even faced with a contradiction, particularly the case of Sudan, which is among the first for FDI and last for LTRADE and LIMP. We would therefore be tempted to say that imports vary in the opposite direction to China's FDI. This implied that at the country level, other factors than FDI would influence the level of international trade.
Linear correlations between variables of study
Considering all of the 832 observations, we notice a weakly linear relationship between China's FDI and African international trade. The Table 5 reveals a linear correlation coefficient of -0.004 between LTRADE and LOCFDI, 0.005 between LEXP and LOCFDI and -0.011 between LIMP and LOCFDI. These results, however, reflect a positive association between FDI and exports, and negative with imports. Correlations are also strong between the three indicators of international trade. However if we take this analysis back to the period, the sub-regional level or the country level, the results are undoubtedly different. For example, for Burkina-Faso, these three correlations are significant at the 5% threshold and are 0.974 between LTRADE and LOCFDI, 0.983 between LEXP and LOCFDI, and 0.942 between LIMP and LOCFDI. By examining simple autocorrelations (Figure 4), we found that there is a significant correlation between current LTRADE and its lagged values. The decrease is always exponential, that means the influence of past values decreases as one moves away from the present, but remains positive. This is almost the same for LEXP and LIMP. On the other hand, for LOCFDI, the relation between the current value and the delayed values becomes significant only from the fourth shift. The simple autocorrelation coefficient of order 4 has a negative sign and the others are almost null, it is the same for the partial autocorrelation coefficients.

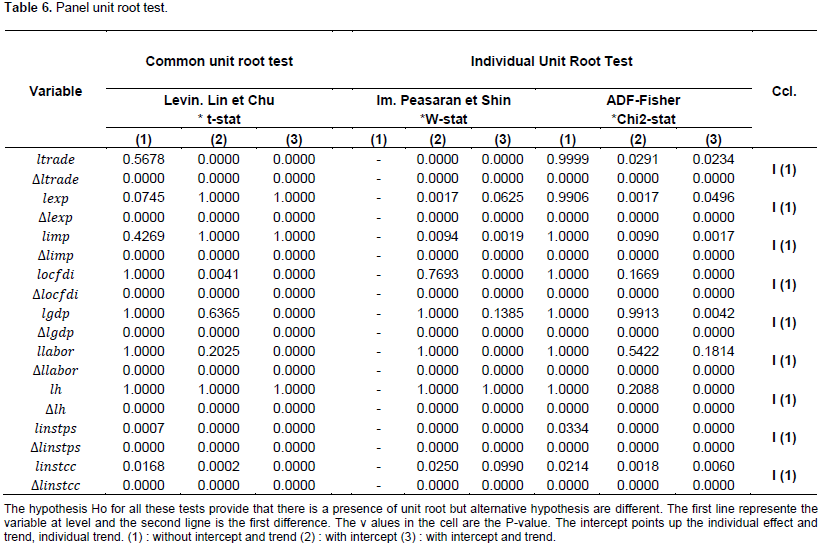
Unit root test
In the analysis of the common and individual unit root tests (Table 6), which have the same basic hypothesis H0, but different alternative hypotheses, it can be said without ambiguity that all series associated with the variables retained are integrated for order 1. We also note, a significant presence of individual effects and temporal effects, this is the case, for example, with LTRADE.
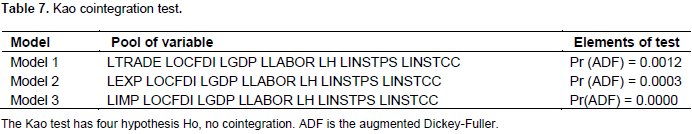
Tests de cointégration
This study has three variables for capturing international trade, which leads to three models. The cointegration test of Kao denotes cointegrated variables in all three models (Table 7). This cointegration is precisely of rank 1.

Tests de causalité en panel
The examination of the linear correlation of coefficients gave us rather mixed results according to the level of analysis (Africa, subregion, period, country). From one period to another, the correlation between international trade and FDI is generally significant, but for the same period the heterogeneity between countries mitigates this association. Therefore, it is necessary to perform panel causality tests.
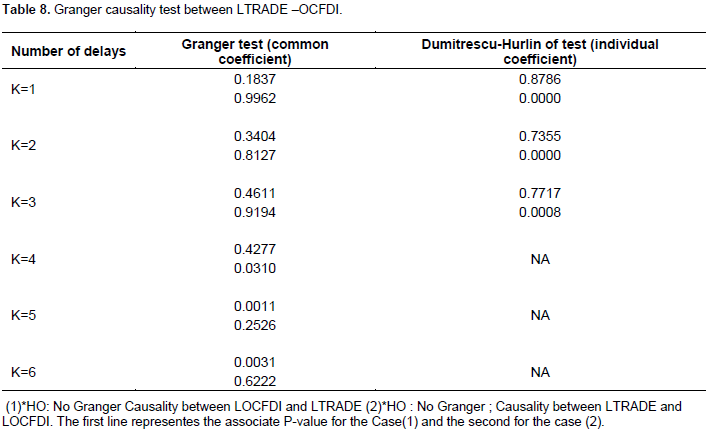
Model 1 : LTRADE and LOCFDI
Examination of Table 8 shows that for the first three offsets, the common test is not significant for both directions of causality. On the other hand, the non-admissible Dumitrescu-Hurlin coefficient test from the fourth shift reveals that LTRADE causes LOCFDI for the first three delays (p-value takes the values 0.0000, 0.0000 and 0.0008, respectively), but not the other way around (p-value = 0.8786, 0.7355, 0.7717 respectively). For the fourth delay, LOCFDI does not cause LTRADE (p-value = 0.4277> 0.05), but LTRADE causes LOCFDI (p-value = 0.0310 <0.05) according to the Granger test. From the fifth delay, LOCFDI causes LTRADE (p-value = 0.0010 for L = 5 and 0.0031 for L = 6). But LTRADE does not cause LOCFDI (p-value = 0.2526 and 0.6222 respectively). These results lead us to glimpse a double causality with staggered delays between LOCFDI and LTRADE.

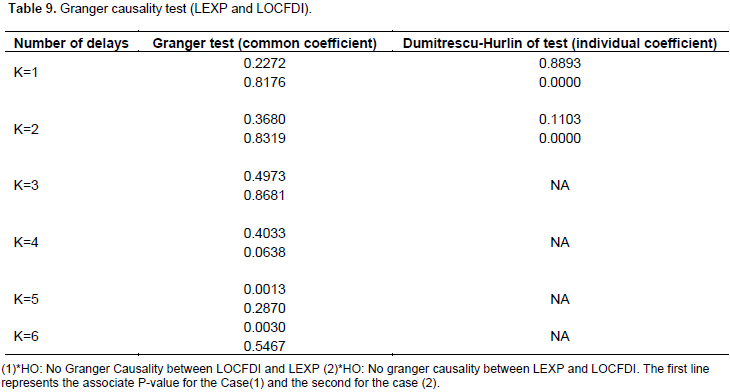
Model2 LEXP and LOCFDI
Table 9 reveals similar conclusions to those found in Table 8. However, the Dumitrescu test is only valid for the first two discrepancies. The results with LEXP go in the same direction as those of LTRADE.
Model3 LIMP and LOCFDI
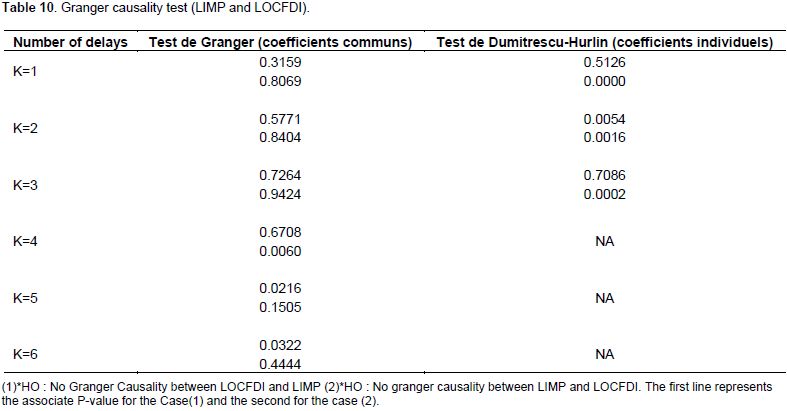
For the Granger test (Table 10), the conclusions are the same as those obtained for model1 (Table 8). The Dumitrescu test has a special feature. In fact, for the second delay, there is double causality. For delays L = 1 and L = 3, the decisions are the same as in the case of LTRADE.

Estimation choice of methods for the three models
The results of the panel causality tests lead us to glimpse the use of a dual causality model. The VAR model appears to be indicated between international trade variables and China's FDI. However, to ensure the correct VAR or VECM (Vector Error Correction Model) specification, the econometric procedure is as follows:
Step 1: Determining the number of p delays of the model according to the AIC or SC criteria.
Step 2: Johansen test determines the number of cointegration relationships.
Step 3: Identification of cointegration relationships, that is, long-term relationships between variables.
Step 4: Estimation by the maximum likelihood method of the vector model with error correction and validation using the usual tests: coefficient significance and verification that the residues are white noises, low exogeneity tests.
Determination of the optimal number of delays
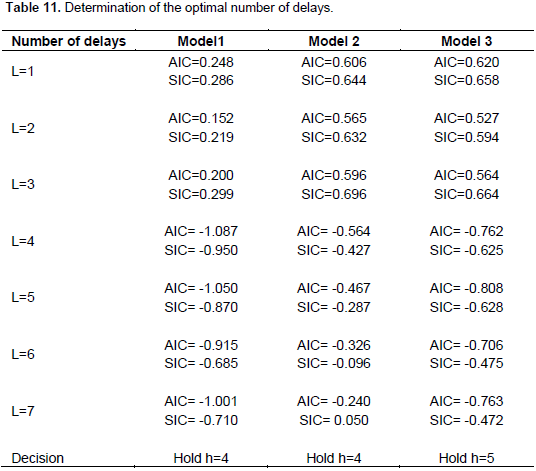
The number of delays (Table 11) to be retained in these models according to the panel causality tests (Tables 8 to 10) would be at least 5. Thus, we will retain the number of delays that minimize the Akaike information criteria (AIC) and Schwarz (SIC), based on the gradual estimation (delays ranging from 1 to 6) of VAR models with international trade variables and FDI as first differences.

Test de Johansen-Fisher
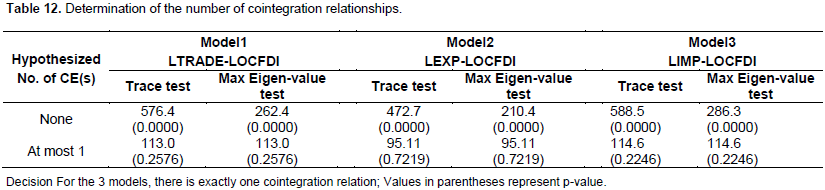
The number of cointegration relationships (Table 12) is determined by the Johansen test. Indeed, it is based on the test of the trace and the test of the maximum eigenvalue of the variance-covariance matrix of the errors, starting from five specifications. As some unit root tests for the LOCFDI series reveal (see Table 7) the presence of a deterministic trend, we will retain the specification N ° 4 (Bourbonnais, 9th edition - 2015, pp 312-313) which is based on the presence of a linear trend.
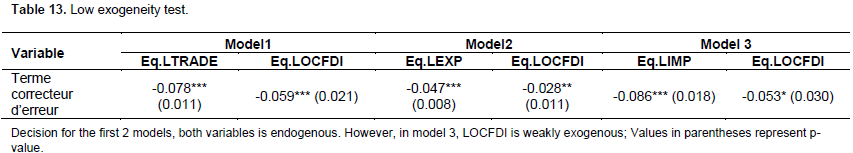
Low exogeneity test
The weak exogeneity test (Table 13) consists in verifying if the variables are indeed endogenous. This test relates to the coefficient γ of the restoring force towards equilibrium (as there is only one cointegration relation). Performing a test on γ amounts to checking if the cointegration relation is present in all equations of the model. In the end, model 3 will have to be estimated with a constraint stipulating a nullity of the correction
Estimations results and interpretation
Model 1 LTRADE
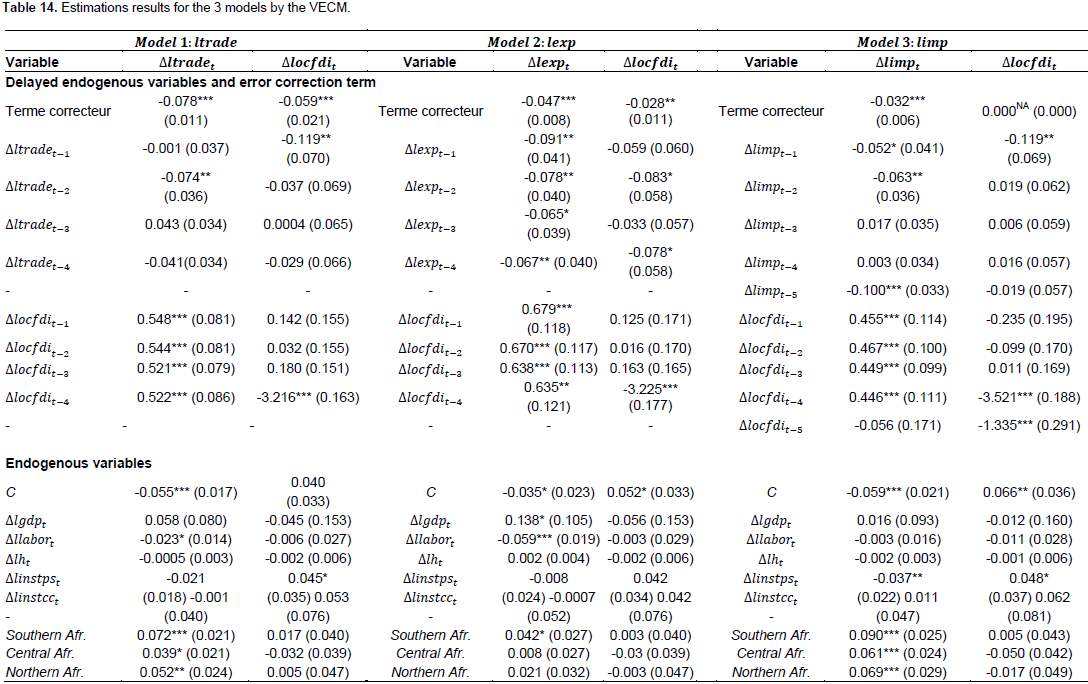
The estimation of model1 reveals mainly the following results (Table 14):
Validity of the model
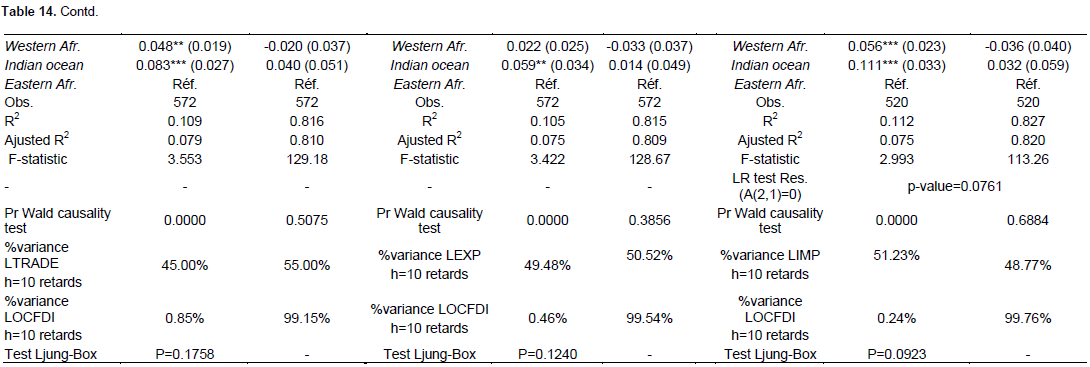
Regarding the validity of the model, the two variables LTRADE and LOCFDI are endogenous variables, based on the low exogeneity test (Table 13). Indeed, the corrective term is significant at 1% in both equations and has the expected negative sign. There is a reminder to balance. The model has residuals that are uncorrelated according to the Ljung-Box test (p-value = 0.1758> 0.05), so they have the behavior of a white noise. These elements indicate that model 1 is indeed valid.
Coefficient of endogenous variables
On the other hand, all 4 variables delayed by LOCFDI are positively associated with LTRADE at the threshold of 1%. This means that when LOCFDI increases by 10% today, LTRADE increases 5.22% 4 years later, 5.21% 3 years later, 5.44% 2 years later and 5.48% the following year. These results show a positive and almost stable influence of FDI from China on the trade openness of African countries. With regard to the decomposition of the conjectured variance at the 10th delay, LOCFDI explains 55% of the variation of LTRADE. This result is confirmed by the p-value of the Wald statistic of the Granger test, which has a value of 0.0000. It is thus concluded that LOCFDI actually causes LTRADE.
Coefficients of exogenous variables
Only sub-regional dummies in Africa are significant at 1, 2 and 3%. Souafr, Cenafr, Norafr, Westafr and Indocean are dummy variables indicating the country's membership in a given sub-region, with Eastafr being the reference variable omitted for reasons of multicollinearity. The coefficients of these variables measure the gap of the LTRADE mean for a given subregion with respect to East Africa. They are all positive, but their values do not reach 10%. In addition, the LLABOR variable with a negative sign is significant at 10%. This would mean that when the labor force increases by 10%, the trade opening decreases by 0.23%.
Equation 2
Coefficient of endogenous variables
With regard to LOCFDI, only LTRADE variables delayed by one period and LOCFDI lagged by 4 periods are significant at 5% and 1% respectively. Thus, 10% of increase of LTRADE value at time t results an decrease of 1.19% of LOCFDI in t + 1. An opening up of the economy in the present, would therefore reduce an influx of FDI in the near future. For an increase of 10% of LOCFDI in t, it is expected to observe a decline of LOCFDI 4 years later of the order of 32.16%. With regard to the decomposition of the conjectured variance at the 10th delay, LTRADE only explains 0.85% of the LOCFDI variation. The Granger test reveals that LTRADE does not cause LOCFDI (p-value = 0.5075). It is concluded that LTRADE does not formally cause LOCFDI.
Coefficients of exogenous variables
As for the LOCFDI equation, no exogenous variable is significant at 5%. Only linstps explains LOCFDI at 10%. One could say that when the stability score increases by 10%, the volume of FDI increases by 0.45%.
Model 2 LEXPORT
The estimation of model 2 reveals mainly the following results (Table 14).
Validity of the model
Regarding the validity of the model, the two variables LEXPORT and LOCFDI are endogenous variables, based on the weak exogeneity test (Table 14). Indeed, the corrective term is significant at 1 and 5% in both equations, and has the expected negative sign. There is a reminder to balance. The model has residuals that are uncorrelated according to the Ljung-Box test (p-value = 0.1240> 0.05), so they have the behavior of a white noise. These elements indicate that model 2 is indeed valid.
Equation 1
Coefficients of endogenous variables
For delayed endogenous exports, the coefficients from the first to the fourth offsets are significant at 5%. This means that when LTRADE increases by 10% during the year considered, it is expected that it decreases by 0.91% the following year, 0.78% two years later, 0.65% three years later, 0.67 four years later. On the other hand, all 4 delayed LOCFDI variables are positively associated with the 1% threshold export. This means that when LOCFDI increases by 10% today, the export increases 6.35% 4 years later, 6.38% 3 years later, 6.7% 2 years later and 6.79% the following year. These results show a positive and almost stable influence of foreign direct investment from China on the level of exports of African countries. With regard to the decomposition of the conjectured variance at the 10th delay, LOCFDI explains 50.52% of L EXPORT variation. This result is confirmed by the p-value of the Wald statistic of Granger test, which has a value of 0.0000. It thus concludes that LOCFDI actually causes LEXPORT.
Coefficients of exogenous variables
Only the dummies of the Souther Afr, Indian Ocean sub-regions are significant at 10%and 5%. Souafr, Cenafr, Norafr, Westafr and Indocean are dummy variables indicating the country's membership in a given sub-region, with Eastafr being the reference variable omitted for reasons of multicollinearity. The coefficients of these variables measure the difference in the average of exports for a given sub-region with respect to East Africa. They are all positive, for the significances of 5% and 10% for only two sub-regions. In addition, the LLABOR variable with a negative sign is significant at 1%. This would mean that when the labor force increases by 10%, the trade opening decreases by 0.59%.
Equation 2
Coefficients of endogenous variables
With regard to LOCFDI, only the variables lexport delayed by two periods and four periods and LOCFDI offset by 4 periods are significant at 10%, 10% and 1% respectively. Thus, 10% of increase in the value of the export at time t results a decrease of LOCFDI of 0.83% in t + 2 and 0.78% in t + 4. Increasing exports in the present, would therefore reduce an influx of OCFDI in the near future. For an increase of 10% of LOCFDI in t, it is expected to observe a decline of LOCFDI 4 years later of the order of 32.25%. As for the decomposition of the conjectured variance at 10th delay, LEXPORT explains only 0.46% of the variation of LOCFDI. The Granger test reveals that the export does not cause LOCFDI (p-value = 0.3856). It is concluded that LEXPORT does not formally cause LOCFDI.
Coefficients of exogenous variables
Regarding the LOCFDI equation, no exogenous variables are significant.
Model 3 LIMPORT
The estimation of model 3 reveals mainly the following results (Table 14).
Validity of the model
Regarding the validity of the model, only IMPORT is an endogenous variables, based on the weak exogeneity test (Table 13). Indeed, the correction term is significant at 1% and 10% in both equations and has the expected negative sign. There is a reminder to balance. The model has residuals that are uncorrelated according to the Ljung-Box test (p-value = 0.0923> 0.05), so they have the behavior of a white noise. These elements indicate that model3 is indeed valid.
Equation 1
Coefficients of endogenous variables
For endogenous retarded of limport, only the coefficient of the first, second and third shifts are significant at 10, 5 and 1%, respectively. This means that when the import increases by 10% during the year, it is expected to decrease by 0.52% the following year and by 0.63% two years later. On the other hand, all 4 delayed LOCFDI variables are positively associated with the 1% threshold. This means that when LOCFDI increases by 10% today, limport increases by 4.46% 4 years later, by 4.49% after 3 years, by 54.67% 2 years later and by 4.55% the following year. These results show a positive and almost stable influence of foreign direct investment from China on the level of imports of African countries. With regard to the decomposition of the conjectured variance at 10th delay, LOCFDI explains 48.77% of LIMPORT’s variation. This result is confirmed by the p-value of the Wald statistic of the Granger test, which has a value of 0.0000. It thus concludes that LOCFDI actually causes LIMPORT.
Coefficients of exogenous variables
Only the dummies in the sub-regions of Africa are significant at 1%. Souafr, Cenafr, Norafr, Westafr and Indocean are dummy variables indicating the country's membership in given sub-region, with Eastafr being the reference variable omitted for reasons of multicollinearity. The coefficients of these variables measure the difference in the average of limport for a given subregion with respect to East Africa. They are all positive, but their values do not reach 10%. In addition, the linstps variable with a negative sign is significant at 5%. This would mean that when the level of political stablity increases by 10%, the level of imports decreases by 0.37%.
Equation2
Coefficients of endogenous variables
As far as LOCFDI is concerned, only the lagged variables of a period, the fourth period and LOCFDI lagged by 5 periods are significant at 5, 1 and 1% respectively. Thus, an increase of 10% of limport at time t results a decrease of 1.19% of LOCFDI in t + 1, 35.21% in t + 4 and 13.35% in t + 5. An increase of imports in the present, would therefore reduce an influx of FDI in the near future. For a LOCFDI increase of 10% in t, it is expected to observe a decrease of LOCFDI 4 and 5 years later of the order of 35.21% and 13.35%. Regarding the decomposition of the conjectured variance at 10th delay, LIMPORT explains only 0.24% of the variation of LOCFDI. The Granger test reveals that limport does not cause LOCFDI (p-value = 0.6884). It is concluded that LIMPORT does not formally cause LOCFDI.
Coefficients of exogenous variables
As for LOCFDI equation, no exogenous variable is significant at 5%. Only linstps explains LOCFDI at 10%. One could say that when the stability score increases by 10%, the volume of FDI increases by 0.48%.