ABSTRACT
This research empirically explores the determinants of Kenya’s regional economic growth in the 47 counties over the period 2014 to 2017. Though economic policies aimed at enhancing regional growth were implemented, the economic performance has not been satisfactory hence the study seeks to find out what determines economic performance at the sub-national level. This research is based on the reduced Solow-Swan growth theoretical framework. The analysis techniques that were used in this study were descriptive and inferential statistics. All target variables except economic growth and electricity infrastructure were found to be stationary when LLC test for panel unit root was applied. Once cointegration was established using Kao test, the long-run and error correction estimates of the ARDL regression were attained after subjecting the model to diagnostic tests. This study has identified public investment, government consumption, electricity infrastructure, quality of governance, and institutions as the main determinants of regional growth in the long-run. On the other hand, the outcome from the short-run regression equation has identified human capital and budget utilization as the key sources of growth. This implies in order to effectively boost economic growth in counties, policies and resources should be directed at looking into the key factors which influence public investment, electricity infrastructure, and government consumption. This accelerates overall regional growth performance in the short-term and expands capital buildup in the long-run.
Key words: Regional economic growth, growth determinants, counties, Kenya.
Exploring determinants of long-term and short-term economic regional growth has been an interesting concern to economists who have been curious to know the elements which cause national and sub-national areas to grow at different rates. The devolution trend in unindustrialized nations is reinforced by the Bretton Woods Institutions, which considers decentralization as a key pillar of its economic growth and regional income disparity eradication strategy (World Bank, 2016). In 2010, Kenya considerably moved from a highly unified governance structure to a highly regionalized one. The fundamental objective of regionalism is to jumpstart economic advancement, eradicate poverty and reduce income discrepancy. However, in the face of increasing devolved budget and political power, local economic growth has stagnated, number of poor people increased, combined with widening regional income imbalances in devolved units, and there is ongoing discussion to ascertain why some counties grow faster than others. The emergence of endogenous and exogenous economic growth theories has helped scholars to comprehend the sources of growth disparity.
The debate over regional income disparities highlights the need for the study on the economic growth factors in Kenya. Economic literature identifies macroeconomic factors that affect economic growth and they include inflation, deficits of the budget, private and public investment, tax burdens and government spending. Also, foreign direct investment, openness to trade, political environment (crime rate and political instability) and institutional framework (corruption and property rights) are other variables which affect income growth (Vidyattama, 2010; Husnain et al., 2011). A huge amount of studies have been conducted in a quarter century on this topic in cross country research such as Barro (1991) and Mankiw et al. (1992). In addition, the discussion has also been applied for the growth cause among provinces in a nation, for example the research carried out by Vidyattama (2010) in Indonesia.
A regional or sub-national income disproportion in Kenya is a weighty matter. In Kenya, counties started displaying their displeasure with national government as early as 1963, immediately after independence, particularly through the Majimbo system and the sessional paper No 10 of 1965 (IEA, 2010). A number of regions were demanding for increased income transfers and greater political authority in identifying, developing and implementing development and growth plans. Further efforts by the Kenyan government to realize equitable regional growth, income growth and poverty eradication led to development of various economic concepts. The promulgated constitution of 2010 and county government act of 2012 entrenched the newly created 47 counties as the center of economic planning and development (IEA, 2010; ICPAK, 2014).
Economic growth has been one of the primary goals of economic policy of 47 regions in Kenya. Nonetheless, even with the devolved governance system, Kenya’s Gross Domestic Product (GDP) growth has been lower than yearly estimated targets, widening income disparities and increase in poverty rate over the years (KIPPRA, 2016). For instance, from government sources, since introduction of devolved governance system Kenya has experienced economic growth from 4.6 in 2012 to 5.9 in 2016. However, in 2017 GDP growth for Kenya slowed down due to drought and post-election violence experienced (GoK, 2019). Furthermore, according to Kenya’s sub-national level economic growth, 2013-2017, Nairobi, Mombasa, and Kiambu regions take the lead in the ranking. However, more than three quarters of the counties were below the national average GCP per capita, emphasizing significant income disparities between the economies of 47 counties (GoK, 2019). This advances the reservation on if devolved system is an effective policy for achieving regional economic growth. And if so, how can it be used to address macroeconomic problems in Kenyan Counties. The objective of this study is to scrutinize the key factors of county per capita income growth and precisely it customs the county panel data for the period 2014 to 2017. To achieve this objective, this study will utilize Autoregressive Distributed Lag (ARDL) technique, which differentiates between long-term and short-term effects of growth, and the study make use of the reduced form of the Solow and Swan growth function in econometric estimation.
EMPIRICAL LITERATURE AND RESEARCH GAPS
A number of studies have affirmed the determinants of growth using cross-country, time series and panel approach which have tried to explain why some regions or countries grow faster than others. However, since a number of these studies have used national /country level regressions and data analysis, the policy implications are challenging to infer for a regional /county level. For instance, empirical research conducted by Barro (1991), Calamitsis et al. (1999) and Rao (2010) on national level established the role of inflation growth, human capital growth, openness, rise in expenditure, increasing public investment and public debt as determinants of growth. Nonetheless there have been few studies carried out on regional level using panel series data such as Vidyattama (2010) which established infrastructure and human capital as determinants of provincial/regional growth.
In their study on Sub-Saharan Africa (SSA), Calamitsis et al. (1999) estimated the factors influencing growth in Sub-Saharan Africa, using panel data (1981-1997). The study established that per capita economic growth in SSA countries is influenced by rise in private investment, human capital growth, low budget deficit and increased exports.
Vidyattama (2010) examined the determinants of provincial economic growth in Indonesia using panel regional data (1983-2003) and the panel Generalized Method of Moments (GMM) dynamic technique based on Solow and Swan theory. It was established that increased transport infrastructure has an adverse effect on economic growth and human capital was beneficial in relation to growth, and which in specific appears to be linked with improved productivity. The findings exposed that public investment spending on growth was insignificant in Indonesia.
Most of the preceding studies on the determinants of economic growth have, however, focused on the national government levels other than the lower tier government (Barro, 1991; Calamitsis et al., 1999; Rao, 2010). These studies do not consider the emerging significance of local or regional government in planning and influencing state economic activities. Selected studies that differentiate between national and sub-national governments lump all sub-national governments together to form one collective group (Jin and Zou, 2005). This leads to information loss since sub-national governments have different roles, governance structure and influence on growth. Devolved governments in Kenya, for instance, are a diverse group and perform various roles in the different counties Lumping together all regional governments either within a nation or across nations implies that all forms of sub-national governments are identical, which is not true. Considering these issues, there appear to be room for further investigation on regional determinants of growth in Kenya by using latest disaggregated data and conducting a sub-national specific level study.
A major criticism of these previous studies is that if regression data is not stationary it may be that, due to the common trends in variables, there can be spurious correlation which imposes upward bias of the estimated coefficients. One way to correct the problem is to run regressions in the form of first differences. Such solution has its own limitations since it estimates only short-run impacts, while the effect is predicted to be long-run (Munnel, 1992). Such analysis can give misleading findings and recommendations. This current study estimated the Error Correction Model (ECM), which distinguishes between short-run and long-run growth determinants and determines the speed of adjustment to the long-run equilibrium.
EMPIRICAL FRAMEWORK
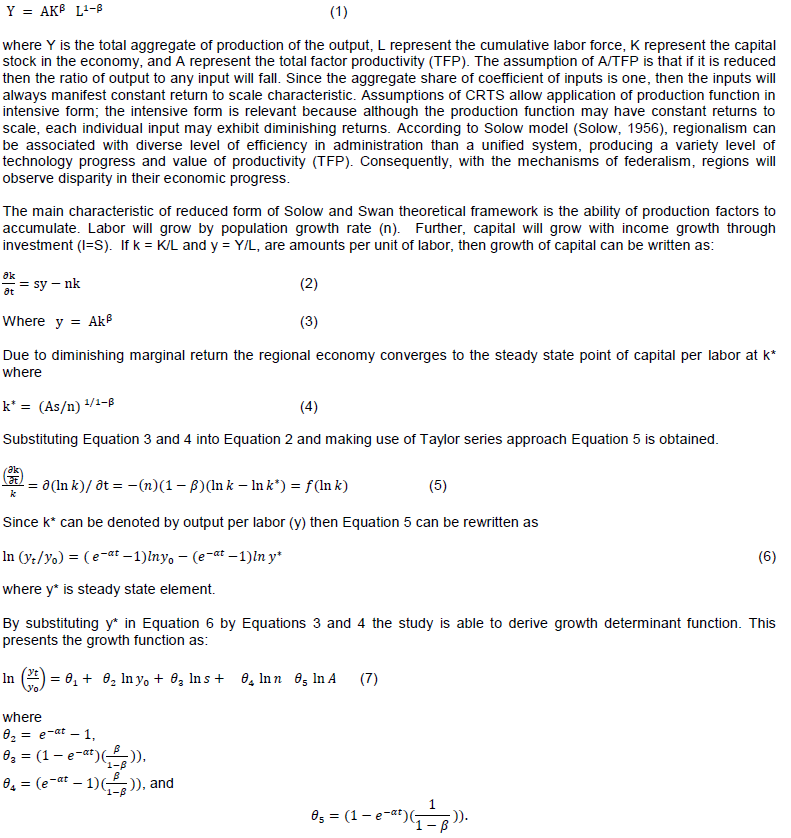
The study framework adopted reduced form of Solow and Swan theoretical framework model in regional/sub-national analysis rather than national level analysis. Both Solow and Swan proposed a neoclassical growth framework using a Cobb Douglas production equation (Solow, 1956; Swan, 1956). Therefore, this study will use Cobb Douglas production function.
Following Vidyattama (2010) and World Bank (2016) studies, the model is formalized so that the main determinant of regional growth could be described endogenously through total factor productivity in growth framework (7). TFP is a crucial determinant in both long-term regional growth differential and short-term regional growth fluctuations in Kenyan counties.
CONCEPTUAL FRAMEWORK
Figure 1 conceptualizes the theoretical framework to the objectives of this study, the hypotheses and how the procedures of data estimation relate to the problem of this study. Conceptual framework shows the independent variables which include components of government consumption, public investment, budget utilization rate, governance quality, institutional frameworks, electricity infrastructure and human capital while the dependent variable is regional economic growth (per capita GCP growth). Control variables were selected from the large body of literature on economic growth determinants as reviewed by Vidyattama (2010) and World Bank (2016). In between the dependent and explanatory variables are the intervening elements which are not controlled for. The intervening factors comprise of political instabilities, environmental factors, external shocks and domestic policies.
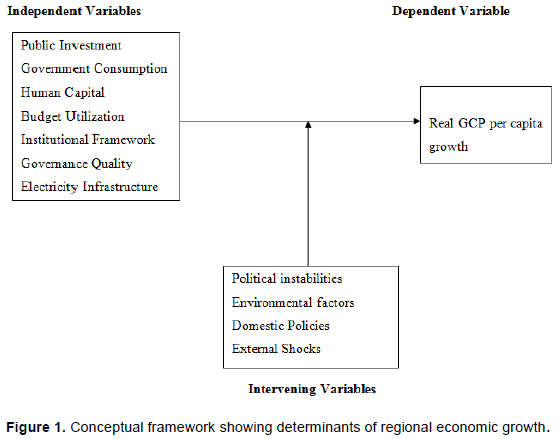
In this context, this study analyzed whether local macroeconomic growth determinants have substantial long-run and short-run effect on regional growth using panel ARDL model. The public investment and government consumption were expected to influence economic growth positively through the mechanism of improved investment and increased consumption, respectively. Regional investment in physical infra-structure is a critical prerequisite for capital accumulation in the private sector for the long-run economic growth. Government consumption can influence economic growth positively by improving purchasing power of the population into the regional economy. Human capital is expected to be positive since an improvement in human capital (skilled) expands productivity and economic growth in long-run. Also, access to affordable electricity power is a prerequisite to realizing economic expansion and reduced regional and income disparities in counties. Almost all consumption and production activities in regional level use hydroelectric energy. Governance quality as measured through Corruption incidence diminishes economic outcomes in counties. This is attributed to an increase of transaction cost and uncertainty, rent seeking, ineffective and inefficient investments, and misallocation of production factors that come with corruption. Further, poor institutional framework as measured through crime imposes large costs to private and public sectors which have a negative effect on local investment and economic activities in long-run. In addition, because economic growth is often tied to public and private expenditure, failure to spend budgeted money directly affects the rate at which the county economy expands. Figure 1 provides the Conceptual Framework of this study.
This research applied quantitative research design so as to analyze the key determinants of economic growth in the 47 regions. The selected research design is appropriate to the study as it capture the trends and effects of growth determinants. This was carried out in the period 2014 - 2017 applying annual series secondary data for forty seven regions and ARDL method, resulting in 188 regional-year observations. This research is limited to the period 2014 to 2017. The choice of the study period was informed by lifespan of devolution, availability of data and also to provide sufficient degree of freedom. This study estimated the panel PMG/ARDL model, which differentiates the growth effects between short-term and long-term. Panel technique permitted control for unobserved county heterogeneity. This study was carried out in the 47 Kenyan counties/regions. Since, counties have been receiving a substantial amount of revenues and political power from central government in order to address income inequalities and stimulate local economic activities (GoK, 2010; OCOB, 2019).
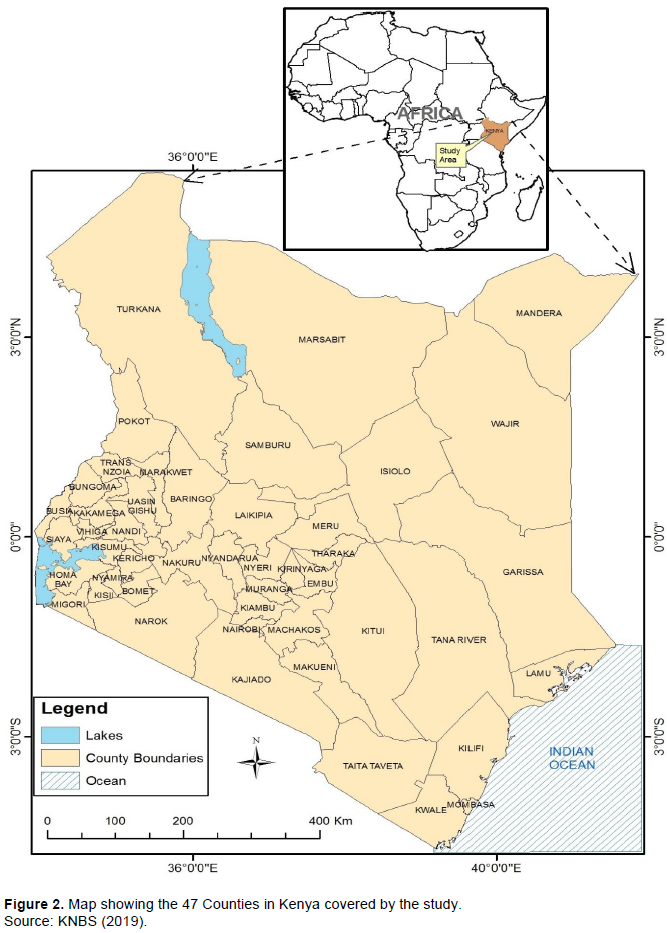
This study was carried in Kenya. Kenya is located in the continent of Africa. Kenya lies across the equator and is found in the eastern coast part of Africa. Map of the World indicate that Kenya’s latitude and longitude lie between 0.0236° S and 37.9062° E (GoK, 2010). Kenya’s total area covers 580,367 km2, making it 49th largest country in the universe, with 11,227 km2 of water and 569,140 km2 of land (GoK, 2019). The geography, political, economic and social structure of Kenya is diverse, varying across Kenya’s 47 devolved units. Nairobi County is Kenya’s seat of power and is found in the south central part of the nation. The population of Kenya is 47,564,296 (2019) and GDP per capita is estimated at $2,010 (KNBS, 2019). The country’s currency is the Kenyan Shilling (KES). The map in Figure 2 below shows the outline of 47 devolved units (47 counties) in Kenya covered by the study (KNBS, 2019).
However, due to the short lifespan of devolution, this study only observed 4 years; short time dimension is problematic during data analysis, thus this study made use of ARDL technique. ARDL framework was preferred since it is reliable and performs well for small sample size data which is appropriate for this research. The econometric findings of this investigation were also limited by the quality of data as reported by different sources; hence data for this study was not free from this apparently common data problem. This limitation originates from the problem of data missing for some years as reported by different institutions. However, such missing data was sought from other sources such as the National Treasury reports and government auditors’ general reports.
Measurement of variables and sources of data
The study uses annual series secondary statistics for the period 2014 - 2017. The choice of period was based on accessibility of statistics. This research employed secondary panel data set of 47 counties in Kenya. Secondary panel data was preferred in this study because it is readily available, cheaper and easily accessible. This research used data from Statistical abstracts reports and Economic surveys reports. Data collection schedule were used to collect the panel data set for this study. The collected panel data was entered in the data sheet where cleaning was carried out correctly to confirm reliability and validity. The subsection which follows gives the description and justification of each variables included in the model of this study.
Economic growth is the dependent variable of this research, and some past studies used the indicator Gross Domestic Product per capita (Barro, 1991; Liu et al., 2018), whereas some studies used the growth rate of Gross Domestic Product as a measure of growth. However, sub-national per capita GDP (Gross County Product (GCP)) growth rate data are available for Kenyan counties, 2014-2017, resulting in the study to adopt per capita county GDP in final estimation. Furthermore, Vidyattama (2010) and Liu et al. (2018) studies used per capita gross regional product (GRP) as the dependent variable in the sub-national level studies. The best measure of economic expansion is real GCP per capita (at constant 2009 prices in KES). The real GCP per capita growth data were attained from annual Gross County Product reports.
Determinants of regional economic growth
Public investment
Public Investment or gross fixed capital formation is one factor directly inferred by the Solow and Swan model framework. In the framework, capital investment could augment both the output level and growth level. Capital spending on capital products is expected to increase capital which, in turn, could supplement private sector productivity and induce further income growth (Mitchell, 2005; Agénor, 2000). The sign of the factor is thus likely to be positive. Public investment is measured as local capital expenditure (at constant 2009 prices), as used in Barro (1991) study. The investment variable was obtained from County Budget Implementation Review reports.
Government consumption
Government size, which is represented as the share of public consumption spending to output, has effects on income expansion. Nevertheless, there are different scholars that support either negative or positive effect on growth. Regional government consumption is ineffective on the grounds of crowding - out occurrence that is, as public products are substituted for private products, thus lowering aggregate private consumption (Mitchell, 2005; Jepchumba and Gisore, 2017). However, according to Barro (1991), consumption spending on public sector such as education and quality health is able to enhance income expansion through development in worker productivity, efficiency and adding purchasing power into population (Keynes, 1936; Romer, 2001). Government consumption was represented by recurrent expenditure. The recurrent expenditure data was obtained from County Budget Implementation Review reports.
Budget absorption
Absorption rate of county allocation denotes the share of the actual county spending out of the targeted budgeted spending. The share is an important tool in shaping the efficiency and overall performance of the counties as regards to utilization of the intended budgets (OCOB, 2013). If budget utilization rate is lower there will be weakening of the sub-national economy (Claudia and Goyeau, 2013). The sign of the factor is thus anticipated to be positive. In order to calculate the absorption rate, the study estimated the actual expenditure to pre-allocated budget share as explained by OCOB (2013). Data for this variable was obtained from County Budget Implementation Review reports.
Human capital
Human capital includes all types of public and private investments made to grow human knowledge, such as formal education, informal learning, on-the-job training, and learning by doing. Human capital is added in the Solow production growth framework since human capital can grow life level through increasing productivity, more employment openings and stimulate income expansion. This study used both primary and secondary enrolment as proxies for human capital following the research by Barro (1991). The coefficient is expected to be positive, the accumulation of human capital increases returns to capital stock, and makes growth more sustainable (Islam, 1995). Data for the variable was collected from Statistical Abstracts.
Institutional framework
Improved institutions, rule of law which is effective, better business environment, property rights which is secure and social norms that are market friendly – and good local and national government policies make an attractive climate for physical capital investment and human capital growth, thereby realizing income development. One key proxy to measure institutions system is the measurement of the amount of crime in a particular economic society. The cost instigated by crime has a negative effect on private businesses, which involves diverting human and capital assets to crime deterrence measures in short-run and otherwise depressing private investment and income growth in long-run (Cardenas, 2007). Therefore, the sign of the factor is anticipated to be negative. Amount of crime reported to the police service was used as a proxy, following Detotto and Pulina (2009) study. The data used in the study was retrieved from Economic Survey reports.
Governance quality: The World Bank lists six dimensions of measuring good governance in a country or region, that is, accountability, lack of political instability, effective government, better regulatory, good rule of law, and low corruption perception index. Good governance means better essential institutions that translate to increased productivity of both human and physical capital, and stimulate private investment. This process finally stimulates further economic expansion through Solow production function (Choe et al., 2013). Corruption and unethical conduct in Kenya infiltrate all level of government both sub-national and national. Corruption perceptions index is negative in relation to economic growth (Hanousek & Kochanova, 2015). This is attributed to an increase of transaction costs and uncertainty, rent seeking, misallocation of production factors, and inefficient private investment decisions (Choe et al., 2013). Following Hanousek and Kochanova (2015) study, average bribe by county in Kenyan Shillings (KES) was used as a proxy. The secondary data was obtained from Ethics and Anti-Corruption Commission (EACC) reports.
Electricity Infrastructure: Government provision of key public utilities, such as power, roads, transport, communication, clean water and sewerage, has a positive spillover effect on private and public productivity, implying the availability of this physical infrastructure could enhance efficiency of other physical capital goods (Ihugba, 2014). Given that Kenya largely is still in the take off stage, energy input is considered to be key since other infrastructure can only perform if there is electricity in place (Wen-Cheng, 2016). The sign of the factor is anticipated to be positive. Following research by Wen-Cheng (2016), electricity consumption in Kilowatts by county was used as a proxy. Data was retrieved from Kenya Power Distribution Master Plan reports.
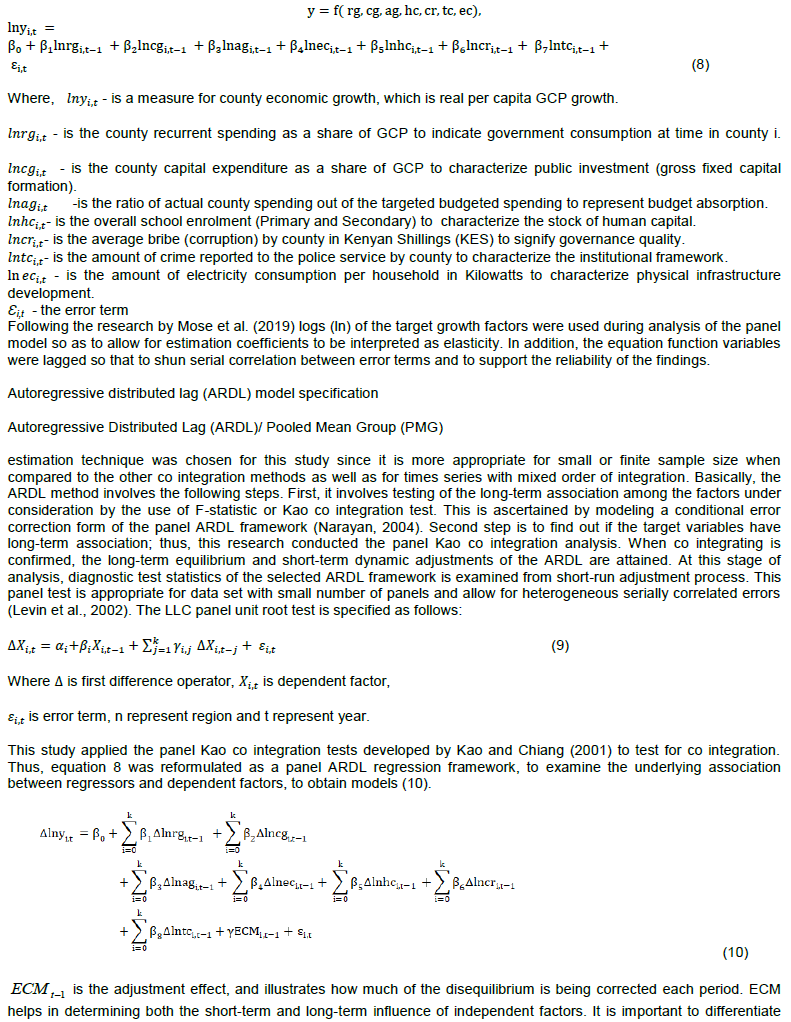
Econometric Estimation Procedure: Building on Solow-Swan theoretical model (Solow, 1956; Swan, 1956), the empirical model established from equation (7) is reformulated. Thus, panel model to be analyzed is formalized in logarithm form as:
these impacts as they can have contradictory effects on the dependent variable. The panel estimation findings are usually not consistent, biased and inefficient if econometric problems such as heteroscedasticity, autocorrelation, mis-specification of model and cross-sectional dependence of white-noise disturbance arise in the regression equation. Consequently, panel diagnostic examination is carried to guarantee the regression function is free from standard econometric challenges (Greene, 2012).
Unit root tests
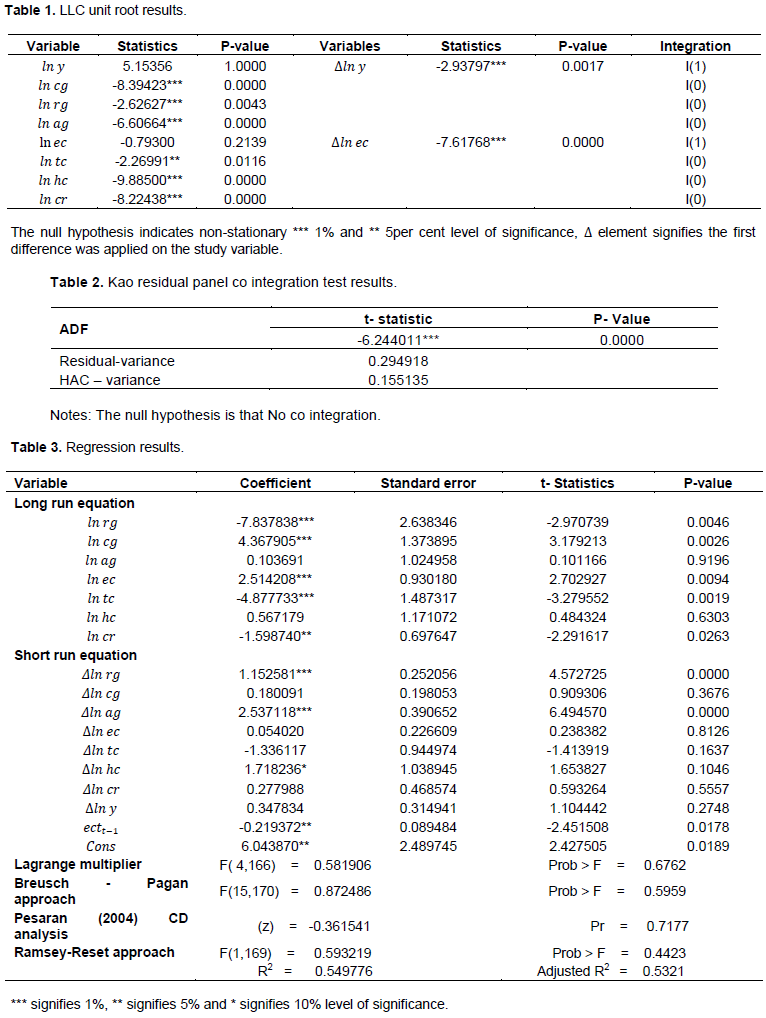
Panel unit root analysis is applied to rule out the presence of non-stationary time series, common or individual unit root. This study applied panel LLC approach at level and first difference and the finding is shown in Table 1. The outcomes in Table 1 show that all the target variables are stationary at their level excluding real per capita GCP growth and electricity infrastructure. Implying electricity infrastructure and economic growth variables are non-stationary. However, they are first differenced to become stationary and thus they are integrated of order one, I (1).
Co integration tests
The justification here is to verify for the absence of co integration by establishing whether long-run relationship exists for individual panel variables or for the panel as a whole (Narayan, 2004). In this study, Kao co integration test was conducted. Kao co integration test is superior to other co integration tests, since is founded on the Engle-Granger two-step mechanism, and assumes homogeneity on the variables (Kao and Chiang, 2001). In the case of panel Kao residual co integration analysis, from the result in Table 2, all the statics are statistically significant at 1% level, confirming the existence of strong long-term association between the target factors.
Regression results
To estimate the long-term and short-term elasticities, this research applied the ARDL/PMG specification method and Akaike Information Criterion (AIC). AIC analysis performs better in small sample data sets (Pesaran et al., 2001). Table 3 presents the result on growth factors of regional output growth in the long-run and short-term.
The specific ARDL regression finding shows that the outcome of government consumption on income is significantly negative in the long-term. Since the outcome is significant at 5% significance level, null hypothesis is disallowed at 5% level of significance. Specifically, 1% point growth in consumption budget would result a decrease in real per capita regional economic growth by 7.8% point in counties. An increase in recurrent spending is likely to cut growth given that in order to fund them, higher taxes must be introduced which will negatively impact the investment decisions by the private sector and thus on income growth in long-run. This slows down economic activities in the short-term and shrinks public physical capital growth in long-term (Oguso, 2017). The result is consistent with research by Oguso (2017) that found a negative relationship.
In the short-term government consumption is positively significant at five percent. This outcome can be credited to increase in consumption budget in most regions and thus stimulating further purchasing power of the local population in the short-period (Keynes, 1936; OCOB, 2018). Increased consumption county budget increase demand for goods and services, which in turn motivate suppliers to increase productive capacities through contracting more capital and labor factors and hence grow regional output (Romer, 2001). The result of this study is in agreement with the findings obtained by scholars like Agénor (2000). From the findings in Table 3, the influence of regional public investment on regional income growth is positive and significant at 5% significance level in long-term. The finding largely established that public investment has substantial effect on income growth in counties. This form of public spending would be linked with the local productive spending that Barro (1991) identified to be an extra factor to Solow growth framework model. Physical investment in key physical infrastructure is vital for capital buildup in the private sector for the long-run economic attainment (Barro, 1991; World Bank, 2016). A number of scholars established a positive association between study variables, for example Oguso (2017) research.
Public investment spending does not influence county growth in the short-run. So, they either did not impact output through increase in investment or the positive influence of increased capital investment is offset by the adverse influence of increasing taxes. This slows down economic activities in the short-period. The findings agree with the conclusion of Muguro (2017). The result of estimated coefficient of regional budget utilization rate is insignificant in the long-term. The insignificant outcome can be attributed to stagnated execution of budget in counties, 65% on average (OCOB, 2016), and thus slowing private capital accumulation and diminishing further growth. The finding illuminate with that of research conducted in Europe (Claudia and Goyeau, 2013).
From the finding in Table 3, budget utilization rate is significant at 5% level and positive in short-run. Specifically, an increase in the budget utilization by 1% will cause a 2.54% increase in income. The significant link can be ascribed to enhanced capital budget execution in counties (OCOB, 2019). If budget fund utilization rate is lower there will be weakening of the regional economy. The outcome contrasts the research in Europe by Claudia and Goyeau (2013) but illuminate with the findings of Becker et al. (2012) research in Europe.
Influence of electricity infrastructure on regional economic growth is positive and significant at 5% significance level in long-run. Any expansion in electricity infrastructure is estimated to stimulate agriculture process and industrial activities at local level as an additional input in the production function (Ihugba, 2014). Access to affordable electricity power is a prerequisite for continued growth and solution to poverty problems through increased production, consumption and output (Wen-Cheng, 2016). This physical infrastructure, as explained in theoretical framework, is essential to grow total factor productivity and to gear up the state for take-off into the middle phases of regional growth.
Impact of electricity infrastructure on GCP per capita is insignificant in short-run. This result could be attributed to low budget allocation on infrastructure expenditure, duplication and the underdeveloped state of physical infrastructural may hinder private investment in lower tier of government (OCOB, 2017; GoK, 2019). Most of physical infrastructure investments are generally long-run initiative for growth. Its conclusion entails availability of stable public investment for a long period (Ihugba, 2014).
The outcomes of the panel regression examination support the hypothesis that crime rate has a 5% negative and significant effect on growth. The result revealed that a 1% rise in crime rate and violence result to 4.88% decline in economic activities. The negative effects of institutional variable on private enterprises can be predominantly detrimental since they can include both short-run costs and long-run consequences for regional income growth, by diverting human and capital resources to crime deterrence agencies and otherwise depressing private investment and thus slowing aggregate regional income expansion (Cardenas, 2007; Detotto and Pulina, 2009). Amount of crime reported to the police as representative of institutions is insignificant in short-run. Insignificant relationship can be attributed to insufficient data since most local crimes goes unreported by population (Ray and Ishita, 2009).
Table 3 shows that, the coefficient of human capital is insignificant. The insignificant result can be explained by a number of reasons as follows. According to Kweka and Morrissey (2000), human capital development is indifferent in the panel model, since the influence of schooling should have very long lags. In addition,
Rajkumar and Swaroop (2008) stated that schooling variables are less likely to lead to better outcomes if regions have poor governance structure and corruption, which is, on average, a characteristic of underdeveloped countries.
The coefficient of aggregate human capital is significant at the 10% level and positive in the short-run. This outcome can be credited to surge in net enrolment in secondary and primary school as a result of subsidized secondary and free primary education in Kenya. According to macroeconomic thought, development of human capital grows labor force productivity, increases innovations, accelerate returns to capital, and makes economic expansion to be sustainable, which in turn, support poverty and inequality reduction strategies in 47 counties. According to Mankiw et al. (1992), Solow model augmented with human capital and physical capital is more capable of describing GCP growth variations between regions, and mostly the counties are likely to converge at a rate predicted by the Solow model. This result is consistent with several researches such as Islam (1995) and Husnain et al. (2011).
Corruption is significant at 5% level and negative in the long-run. The empirical result indicates that a 1% increase in corruption rate will lead to 1.6% decline in economic growth. Thus, corruption hampers local income accumulation by distorting other macroeconomic com-ponents in devolved units (Hanousek and Kochanova, 2015). Corruption incidence can cause resource misallocation when judgments on how public funds will be used, or which private sector businesses to be approved, are made by corrupt county government officials (Choe et al., 2013). There are several mechanisms, through which corruption hampers economic success in long-term. They include reduced domestic investment, exaggerated government spending, distorted budget that favour allocation in less efficient public programs with more scope of corruption and manipulation, while ignoring human capital and physical capital programs (Murphy et al., 1991).
Corruption was insignificant in short-run. This outcome can be credited to the available data on the number of documented corruption cases in Kenya, which is under-estimated since not many bribe demand incidences are actually conveyed to authorities. In addition, the consequence (positive or negative) of corruption on private sector expansion and growth entirely depend on the country and its institutions in place (Hanousek and Kocenda, 2011). Error correction term was fairly low, that of -0.22, meaning regional equilibrium slowly converge to long-term equilibrium in counties. This implies dis-equilibrium can persist for a long period of time in 47 regions.
The estimated coefficient of determination shows that the regressors jointly explain 53% of the variation in the dependent variable which means it fits the data well. Furthermore, the panel regression function passed all diagnostic tests namely Breusch-Godfrey Lagrange Multiplier (LM) test which show that autocorrelation is not a problem in the regression model. Heteroscedasticity which arise when the size of the error term varies across values of explanatory variable is absent according to Breusch-Pagan test. Ramsey RESET test show that the regression equation is well specified and the function did not suffer from contemporaneous correlation as shown by the mean value of Pesaran (CD).
This study set out to estimate empirically the long-run and short-run effects of regional economic growth determinants in Kenya, 2014-2017. In order to achieve the specific objectives, this study identified the key macroeconomic determinants of regional growth in 47 counties from literature. This study used panel econometric techniques such as testing for panel unit root test using LLC test so as to avoid the problem of spurious outcomes that arise due to non-stationary data. Using Kao panel testing approach to co integration, the study estimated the long-run static relationship and short-run dynamic relationship of the model. The findings of this study established that there exist a co integration relationship among the real GCP per capita and the regressors in the model. Panel diagnostic tests were applied to ensure the estimates are free from standard econometric problems. The coefficients of the effect of these were shown to differ in magnitude, sign and direction. However, the overall fit of the regression models suggests that the target variables explain significant amount of fluctuation of economic growth in Kenyan counties. This study has identified public investment, government consumption, quality of governance and institutions, electricity infrastructure and human capital stock as the main determinants of economic progression in the Kenya counties. The findings are similar to the regional studies by Calamitsis et al. (1999) in SSA and Vidyattama (2010) in Indonesia regions. This implies in order to effectively boost economic growth in counties, policies and resources should be directed at looking into the key factors which influence public investment levels, electricity infrastructure, government consumption, quality of governance and human capital stock.
AREAS FOR FURTHER RESEARCH
Extend macroeconomic analysis to include a more comprehensive disaggregation of investment into private and public in order to determine which element of investment contribute to regional economic growth in Kenyan counties. Macroeconomic analysis should be extended to include the other source of growth (tax revenue, intergovernmental transfer, grants, population, natural resources, land quality, public debt and budget deficit) that influence regional growth, need to be identified and taken into account in the analysis. For this reason, some extra macroeconomic factors should be included as control variables during panel estimation.
The author has not declared any conflict of interests.
REFERENCES
|
Agénor PR (2000). The economics of adjustment and growth. Academic Press.
|
|
|
|
Barro RJ (1991). Economic Growth in a cross Section of Countries. The Quarterly Journal of Economics 106(2):407-443.
Crossref
|
|
|
|
|
Becker SO, Egger PH, von Ehrlich M (2012). Too Much of a Good Thing? On the Growth Effects of the EU's Regional Policy. European Economic Review 56:648-668.
Crossref
|
|
|
|
|
Calamitsis D, Ghura D, Basu A (1999). Adjustment and Growth in Sub-Saharan Africa. IMF Working Paper 99/51 (Washington: International Monetary Fund).
|
|
|
|
|
Cardenas M (2007). Economic Growth in Colombia: A Reversal of 'fortune'? Working papers series - Documentos de trabajo. pp. 1-36.
|
|
|
|
|
Choe C, Dzhumashev R, Islam A, Khan ZH (2013). The Effect of Informal Networks on Corruption in Education: Evidence from the Household Survey Data in Bangladesh. The Journal of Development Studies 49(2):238-250.
Crossref
|
|
|
|
|
Claudia A, Goyeau D (2013). EU Funds Absorption Rate and the Economic Growth. Timisoara Journal of Economics and Business 6(20):153-170.
|
|
|
|
|
Detotto C, Pulina M (2009). Does More Crime Mean Fewer Jobs? An ARDL Model. Working Paper, 2009/05.
|
|
|
|
|
Government of Kenya (GoK) (2019). Economic surveys. Nairobi, KNBS. 2019 Kenya Population and Housing Census: Volume II. Available at:
View
|
|
|
|
|
Government of Kenya (GoK). (2010). Socio Economic data of Kenya, 2011, Economic surveys. Nairobi, Kenya. Available at:
View
|
|
|
|
|
Greene WH (2012). Econometric Analysis. England, Pearson Education Limited.
|
|
|
|
|
Hanousek J, KoÄenda E (2011). Public investments and fiscal performance in new EU member states. Fiscal Studies 32(1):43-72.
Crossref
|
|
|
|
|
Hanousek J, Kochanova A (2015). Bribery environments and firm performance: Evidence from CEE countries. CEPR Discussion Paper, No. DP10499.
Crossref
|
|
|
|
|
Husnain MI, Khan M, Haq Padda I, Akram N, Haider A (2011). Public Spending, FDI and Economic Growth: A Time Series Analysis for Pakistan (1975-2008). International Research Journal of Finance and Economics 61:21-27.
|
|
|
|
|
ICPAK (2014). Paper on the impact of Decentralized Funds in Kenya. ICPAK, 8, Nairobi.
|
|
|
|
|
Institute of Economic Affairs (IEA) (2010). Devolution in Kenya, Prospects, Challenges and the Future. IEA Research paper, series No.24.
|
|
|
|
|
Ihugba OA (2014). Nigerians total government expenditure: its relationship with economic growth. Mediterranean Journal of Social Sciences 5(17):67-76.
|
|
|
|
|
Islam N (1995). Growth empirics: a panel data approach. The Quarterly Journal of Economics 110(4):1127-1170.
Crossref
|
|
|
|
|
Jepchumba K, Gisore N (2017). Effect of Budget Deficit on Private Investment in East African Community for the period 1981-2015: A Panel Data Analysis. International Journal of Business, Economics and Management 4(1):26-37.
Crossref
|
|
|
|
|
Jin J, Zou HF (2005). Fiscal decentralization, revenue and expenditure assignments, and growth in China. Journal of Asian Economics 16(6):1047-1064.
Crossref
|
|
|
|
|
Kao C, Chiang M (2001). On the estimation and inference of a cointegrated regression in panel data. In: Baltagi BH, Fomby TB, Hill RC (eds.). Advances in Econometrics. London, Emerald Group Publishing Limited pp. 179-222.
Crossref
|
|
|
|
|
Keynes J (1936). General Theory of Employment, Interest and Money. Harcourt Company.
|
|
|
|
|
Kenya National Bureau of Statistics (KNBS) (2019). Gross County Product Report 2019, Nairobi, Kenya. Available at:
View
|
|
|
|
|
Kweka J, Morrissey O (2000). Government Spending and Economic Growth in Tanzania, 1965-1996: CREDIT Research Paper.
|
|
|
|
|
Liu J, Tang J, Zhou B, Liang Z (2018). The effect of governance quality on economic growth: Based on China's provincial panel data. Economies 6(4):56-89.
Crossref
|
|
|
|
|
Levin A, Lin CF, Chu CSJ (2002). Unit root tests in panel data: asymptotic and finite-sample properties. Journal of Econometrics 108(1):1-24.
Crossref
|
|
|
|
|
Mankiw G, Romer D, Weil D (1992). A contribution to the empirics of economic growth. Quarterly Journal of Economics CVII(2):407-437.
Crossref
|
|
|
|
|
Mitchell D (2005). The Impact of Government Spending on Economic Growth. Washington DC, Heritage Foundation.
|
|
|
|
|
Mose N, Kibet L, Kiprop S (2019). The Effect of County Government Expenditure on Gross County Product in Kenya: A Panel Data Analysis. African Journal of Business Management 13(13):428-437.
Crossref
|
|
|
|
|
Muguro WJ (2017). Effect of Public Expenditure on Economic Growth in Kenya: 1963-2015. Master's thesis, KCA University, Nairobi, Kenya.
|
|
|
|
|
Munnel AH (1992). Policy Watch. Journal of Economic Perspectives, 6(4), 189-198.
Crossref
|
|
|
|
|
Murphy K, Shleifer A, Vishny R (1991). The Allocation of Talent: Implications for Growth. Quarterly Journal of Economics 106:503-530.
Crossref
|
|
|
|
|
Narayan PK (2004). Reformulating critical values for the bounds F -statistics approach to cointegration: an application to the tourism demand model for Fiji. Department of Economics Discussion Papers, No. 02/04, Monash University, Australia.
|
|
|
|
|
Office of the Controller of Budget (OCOB) (2013-2019). Annual County Governments Budget Implementation Review Report. Nairobi, Government Printer.
|
|
|
|
|
Oguso A (2017). Growth Effects of Public Recurrent Expenditure in Kenya. Journal of Economics, Management and Trade 19(2):1-20.
Crossref
|
|
|
|
|
Pesaran MH, Shin Y, Smith RP (2001). Bounds Testing Approaches to the Analysis of Level Relationships. Journal of Applied Econometrics 16(3):289-326.
Crossref
|
|
|
|
|
Rajkumar SA, Swaroop V (2008). Public Spending and Outcomes: Does Governance Matter? Journal of Development Economics 86(8):96-111.
Crossref
|
|
|
|
|
Rao BB (2010). Time-series econometrics of growth-models: A guide for applied economists. Applied Economics 42(1):73-86.
Crossref
|
|
|
|
|
Ray R, Ishita C (2009). Crime, Corruption and Institutions. Monash University Discussion Paper 20(9):1-52.
|
|
|
|
|
Romer DH (2001). Advanced Macroeconomics. Berkeley, the McGraw-Hill Co. Inc.
|
|
|
|
|
Solow RM (1956). A contribution to the theory of Economic Growth. The Quarterly Journal of Economics 70(1):65-94.
Crossref
|
|
|
|
|
Swan TW (1956). Economic Growth and Capital Accumulation. Economic Record 32(2):334-361.
Crossref
|
|
|
|
|
Vidyattama Y (2010). A Search for Indonesia's Regional Growth Determinants, ASEAN Economic Bulletin 27(3):281-294.
Crossref
|
|
|
|
|
Wen-Cheng L (2016). Electricity consumption and economic growth: Evidence from Taiwanese Industries. Sustainability 9(50):1-15.
Crossref
|
|
|
|
|
World Bank (2016). Kenya Country Economic Memorandum: From Economic Growth to Jobs and Shared Prosperity. Working Paper, No. 103822, Nairobi, Kenya.
|
|