ABSTRACT
The purpose of this paper is to compare two of the most commonly utilized methods employed to measure the Intellectual Capital (IC) value: Market to Book (MtB) ratio and the Value Added Intellectual Coefficient (VAIC), in order to determine the most suitable in the context of Italian listed firms and their respective relationships with some key IC determinants. The study is conducted for a sample of Italian listed firms over the period 2009-2014. Different tests are employed to compare VAIC and MtB, while two linear panel regression models with fixed effects models are performed in order to test the relationship between IC value and selected determinants. The results suggest that the MtB ratio is a better estimator of IC value than VAIC. MtB, IA and profitability – are significant positive drivers, while leverage and size are significant negative drivers. For VAIC, only profitability and leverage are significant determinants, both having a positive effect. Recognised limitations in measuring IC value through MtB are partially mitigated because the sample is composed of listed companies preparing financial statements according to IFRS since 2005. Managers should try to avoid rigidity in their organisational structure and to focus on an IC investment strategy. The results could be beneficial for financial analysts and investors in selecting the best method for IC measurement. The paper makes an innovative comparison between two alternative IC metrics, to determine which is more effective in capturing IC value in an Italian listed firms’ context. Further, it identifies some key determinants of IC value.
Key words: Intellectual capital, intangible assets, market-to-book ratio, value added intellectual coefficient (VAIC), Italian listed firms.
Recent years have been marked by the emergence of a knowledge-based economy in which intangible assets have acquired pivotal importance compared to tangible assets, and represent critical success factors for both achieving competitive advantage and generating economic wealth since they are knowledge-based, specific to a given company, and are difficult to replicate and imitate (Chen et al., 2005; Ahangar, 2011; Zou and
Huan, 2011).
Several authors recognise that the accounting term “intangible assets” and the management term “intellectual capital” are largely synonymous (Puntillo, 2009; Pena et al., 2012; Goebel, 2015; Osinski et al., 2017). Khalique et al. (2015: 225) argue that “intellectual capital represents a combination of intangible assets or resources, such as knowledge, know-how, professional skills and expertise, customer relationships, information, databases, organisational structures, innovations, social values, faith, and honesty. These can be used to create organisational value and provide a competitive edge to an organisation”.
Moreover, Dumay (2016: 169) emphasizes the concept of “value” rather than “wealth” by defining IC as follows: “[IC] is the sum of everything everybody in a company knows that gives it a competitive edge […] Intellectual Capital is intellectual material, knowledge, experience, intellectual property, information […] that can be put to use to create [value]”.
Intellectual Capital can also be identified with those hidden values, which due to the prudent attitude of the standard setters are not recognised in the financial statements but valued by the market, contributing to enrich the difference between market value and book value (Chen et al., 2005; Dumay, 2009; Maditinos et al., 2011).
According to the Resource-Based view (RBV) theory, IC can be considered as a bundle of strategic assets which being rare, inimitable and difficult to acquire on the market, constitute fundamental drivers of firm value creation and sustainable competitive advantage (Villalonga, 2004; Ahangar, 2011). As such, the identification, management, and measurement of IC have become a significant focus for both researcher and practitioner interest (Dumay, 2009; Zou and Huan, 2011; Pena et al., 2012; Osinski et al., 2017).
According to scholars, the need to measure and manage IC arises from the “what gets measured gets managed” paradigm coupled with the need to reduce the gap between book and market value as well as information asymmetry (Andriessen, 2004: 234).
Several authors have stressed the internal and external benefits to the firm of accurate IC measurement. The internal benefits conferred upon the management of the firm extend to better strategy formulation and evaluation, coupled with better business performance (Dumay, 2009; Bhasin, 2012; Dženopoljac et al., 2016). The external benefits relate to the provision of more detailed and useful information to investors about the sources of firm value creation, whereby information asymmetry and thus the cost of equity are reduced, and the decision-making process of investors in the firm is enhanced (Bhasin, 2012; Dumay, 2016; Osinski et al., 2017).
However, many difficulties arise when attempting to identify and measure the IC. First, accounting principles are inadequate in terms of providing a correct representation of intangible assets on the balance sheet due to the overly-conservative standpoint of standard setters, thereby giving rise to an absence of the necessary data (Lev et al., 2005). Second, some managers are unwilling to disclose sensitive information about the firm’s valuable IC resources as this may give rise to a loss of competitive advantage (Dumay, 2016). Finally, the idiosyncratic nature of IC resources, typically related to specific features of an individual enterprise such as its business model and activities, itself prevents the development of a universal measurement model (Paździor and Paździor, 2012).
Due to the recent focus of the business world on IC, coupled with issues of more precise identification and measurement, there has been a proliferation of measurement frameworks and models, each with its relative merits, though to date no commonly accepted model for IC measurement has emerged or synthesis achieved (Anghel, 2008; Khalique et al., 2015; Osinski et al., 2017). According to the extant literature, a gap emerges since there is no single model recognised as superior to the others and which is universally applicable to any country. Further, there is a paucity of studies which provides an analytical comparison between different IC measurement models in order to find which is most suitable in a given context, and thus helping practitioners, investors and researchers with IC evaluation.
In the context of German listed companies, Goebel (2015) compares three different IC measurement models, long-run value-to-book (LRVTB), Market to Book, and Tobin’s q, and finds that LRVTB is the best estimator for IC value, while other authors focus on a single method (e.g. MtB, VAIC) in their studies. Underpinned by the existing theoretical and empirical literature (Goebel, 2015), the purpose of this paper is to compare different methods for measuring IC value in order to find which is the most suitable approach in the context of Italian private sector listed firms. Grounded on Sveiby’s (2001) IC measurement classification methods, as revised by Sydler et al. (2014), this paper employs two methods classified as applying to the monetary and organizational levels: the Market to book Ratio (MtB), based on the market capitalization approach, and the Valued Added Intellectual Coefficient (VAIC), based on the return on assets approach.
The two methods are selected on the basis of the following rationale. Firstly, consistent with the findings of Ramanauskaitė and Rudžionienė (2013), the methods are among the most utilized and discussed in the literature in general (Pulic, 1998; Cazavan-Jeny, 2004; Mavridis, 2004; Chen et al., 2005; Bramhandkar et al., 2007; Gan and Saleh, 2008; Ahangar, 2011; Maditinos et al., 2011; Morariu, 2014; Tseng et al., 2015; Dženopoljac et al., 2016), and in particular in the Italian context (Puntillo, 2009; Gigante, 2013; Iazzolino and Laise, 2013; Forte et al., 2017). Secondly, given that the methods are based predominantly on established accounting rules, they are as a result more transparent, comparable and reliable than alternative methods (Jurczak, 2008; Paździor and Paździor, 2012; Sydler et al., 2014).
MtB and VAIC: theoretical background
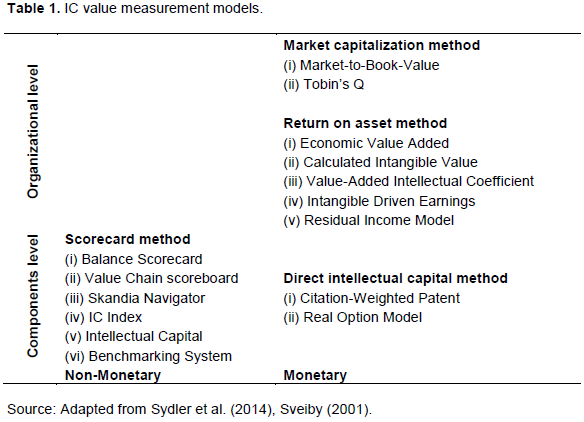
Here, the classification of Sydler et al. (2014: 247), grounded on Sveiby (2001), has been adopted as a reference point. Table 1 presents a two-dimensional matrix in which a range of IC value measurement models are classified by valuation level (organisational or components level) and by the monetary nature or otherwise of the method (non-monetary or monetary).

According to this classification, two methods which are classified as monetary-based and placed at the organisational level have been selected as the focus of the research: the (Market Capitalization Methods (MtB) and the Return on Assets Methods (VAIC). Both lead to a quantitative measure and are based on accounting and market data which are readily obtainable and verifiable, thus allowing for simple comparison (Pulic, 1998, 2000; Firer and Williams; 2003; Jurczak, 2008; Paździor and Paździor, 2012; Sydler et al., 2014). Moreover, they are among the most employed IC measurement tools in the literature, and especially in the Italian context (Bramhandkar et al., 2007; Puntillo, 2009; Morariu, 2014; Goebel, 2015; Forte et al., 2017).
Within the “Market Capitalization Approach” family, the predominant measure is the MtB ratio. This approach is underpinned by the assumption that IC constitutes a significant “hidden value” of intangible resources that are not reported as “assets” in the financial statements (Brennan, 2001; Forte et al., 2017). The approach is based on the holistic effect of interactions between IC components which in turn generates value that exceeds the aggregate value of the individual estimates (Van der Meer-Kooistra and Zijlstra, 2001). It gauges the value of a company’s IC as the difference between the company’s market capitalisation and its book value, and thus positive IC value arises where the market-to-book ratio exceeds unity (Stewart, 1997).
In recent years, several studies have employed the MtB ratio in order to estimate IC value according to the Market Capitalization Approach (Brennan, 2001; Cazavan-Jeny, 2004; Bramhandkar et al., 2007; Kuo-An Tseng et al., 2015; Goebel, 2015; Forte et al., 2017). These studies assume that financial markets are efficient and accurate in their valuation of listed companies beyond their financial statements, drawing upon all relevant information from other sources, and that any excess value over a company’s book value depends on a correct valuation of both the company’s visible (e.g. protected brands) and its invisible (e.g. “overall reputation”) intangible assets (Lal Bhasin, 2012). Bramhandkar et al. (2007: 359) argue that the MtB ratio measure is “well established in the literature and, although broad, readily identifies those organizations doing a better job with their knowledge assets”. Moreover, RamanauskaitÄ— and RudžionienÄ— (2013) find that MtB based methods are the most common in their review of the IC valuation method literature. Several scholars argue that the MtB ratio is simple to apply, it uses publicly available data, and it enables simple comparison across companies (Bramhandkar et al., 2007; Jurczak, 2008; Paździor and Paździor, 2012; Forte et al., 2017).
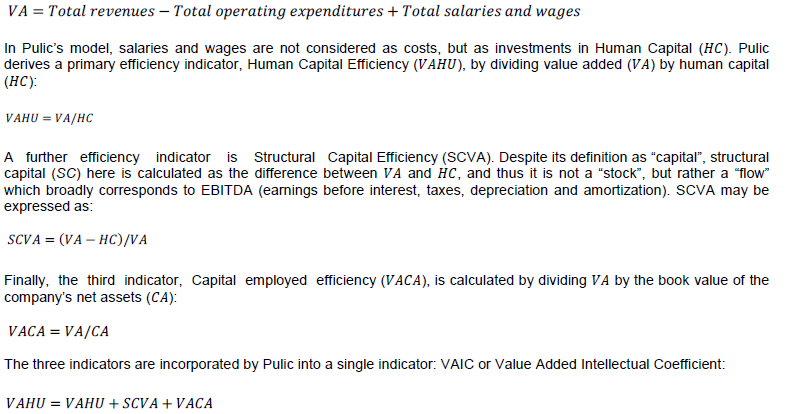
However, two key issues arise from the application of the MtB ratio: (i) the distortion of data generated by historical cost accounting; and (ii) the influence of “unpredictable” market fluctuations, especially in the short-term analysis (Paździor and Paździor, 2012; Goebel, 2015). In summary, the MtB ratio allows measurement of the specific contribution of intangibles (assumed to be equivalent to IC) to the creation of additional value, as captured by the excess of the market to the book value of a company’s net assets. The VAIC method is one application of the Return on Assets (ROA) approach proposed by Pulic (1998, 2000). It aims to provide objective and verifiable information about the efficiency of both tangible and intangible assets in the creation of “value added” ( ) which in turn is generally calculated as:

Various authors outline the advantages of this indicator: (i) the model requires only a simple calculation; (ii) VAIC, and its components may be derived from accounting data which are in turn generated entirely from the firm’s operations and verified by its auditors; (iii) as it is based on objective data, VAIC may be used effectively for comparison between firms; and (iv) conceptually, VAIC is based on value added which is a widely accepted measure of value creation through business activity (Firer and Williams; 2003; Jurczak, 2008; Puntillo, 2009; Ahangar, 2011; Maditinos et al., 2011; Paździor and Paździor, 2012).
However, authors also discuss some key limitations of VAIC (Stahle et al., 2011; Iazzolino and Laise, 2013; Goebel et al., 2015; Dzenopoljac et al., 2016). Firstly, as it focuses mainly on the Value-Added Income Statement, it utilises a traditional accounting computation and thus cannot be considered a true alternative to other more traditional methodologies (e.g. EVA). Secondly, if human capital is argued to be an investment, then it should be added to capital employed. Thirdly, VAIC assumes that all labour expenses recognised in the income statement are linked to IC, whereas a proportion of such expenses may reasonably be considered as mere operating expenses incurred during the period.
Prior research on MtB and VAIC
A number of authors study the relationship between IC value, calculated in terms of the MtB ratio, and the level of IC disclosure (Brennan, 2001). Cazavan-Jeny (2004) investigates potential determinants of the difference between market value and book value in French firms, finding a positive relationship between the MtB ratio and goodwill, growth, risk, and profitability, though finds no association with either expensed intangibles intensity or capitalised intangibles intensity.
Bramhandkar et al. (2007) analyse 139 drugs industry firms and focus on the impact of IC management, measured as the difference between market value and book value, on organisational performance. They find that firms with the highest level of intangible assets clearly outperform those with lower levels; the former enjoy significantly better returns and less stock price variability. Bhasin (2012) examines a small sample of Indian pharmaceutical companies and applies the market value added (MVA) approach for measuring IC and finds a negative relationship between IC and net operating profit. In an Italian context, Forte et al. (2017), analyse a sample of 140 Italian listed firms over the period 2009-2013 in order to determine the relationship between IC value and its drivers. They find that intangible assets, auditor quality, profitability, family ownership, and leverage positively affect IC value. Finally, Goebel (2015) conducts a study of German non-financial companies, comparing three IC value measures, MtB, Tobin’s q, and LRVTB (long-run value-to-book), and finds that the latter is the best estimator for IC value. However, she finds no relationship between LRVTB and intangible assets, a positive relationship with wages and leverage, and a negative relationship with size.
Regarding the VAIC, Firer and Williams (2003) use VAIC to analyse the effect of IC on ROA and market value in South African companies. They find a weak association between VAIC and profitability, productivity and market valuation, suggesting that physical capital is the predominant success factor for corporate performance. Chen et al. (2005) study Taiwanese listed companies to examine the relationship between VAIC and firm market value and current and future financial firm performance. They find evidence of a positive impact on market value and financial performance, and that VAIC may be an indicator for future financial performance. Tan et al. (2007) analyse the association between IC and financial performance for Singaporean listed companies and find that they are positively related. Ahangar (2011) examines a sample of Iranian companies to assess the association between VAIC components and firms’ profitability, employee productivity and growth in revenues. He observed that Human Capital Efficiency (HCE) positively affects profitability, employee productivity and growth in revenues, while Capital Employed Efficiency (CEE) exerts a negative influence on employee productivity and growth in revenues. Maditinos et al. (2011) examine the influence of VAIC on firms’ market value and financial performance for a sample of 96 Greek companies listed on the Athens Stock Exchange and only find a significant positive relationship between human capital efficiency (HCE) and financial performance. Morariu (2014) examines the relationship between IC performance and corporate performance for a sample of 72 Romanian listed companies and finds a negative association between VAIC and MtB. Dzenopoljac et al. (2016) employ VAIC to measure the contribution of IC to value creation in Serbian ICT companies and find that only one component of VAIC, CEE, has a significant positive effect on financial performance as measured by indicators such as ROE and ROA. Sardo and Serrasqueiro (2018) examined the relationship between VAIC, growth opportunities and financial performance in a sample of 2,044 non-financial listed firms belonging to 14 European countries. They observed that IC improves firms’ financial performance proxied as ROA in high-tech, medium-tech and low-tech firms and that growth opportunities positively affect firms’ financial performance through the efficient use of IC. Finally, Smriti and Das (2018) analyse d a sample of 710 Indian publicly listed firms for the period 2001 to 2016 to examine the relationship between VAIC, and firms’ profitability, productivity, sales growth and market value and, find evidence of a strong influence of VAIC on all firms’ performance dimensions, except for HCE which positively influences firms’ productivity only.
Furthermore, the determinants of VAIC have been modelled for the banking sector, though with mixed results. El Bannany (2008) investigates a sample of UK banks over the period 1999-2005, and finds that investments in information technology systems, barriers to entry, and the efficiency of investment in IC have a significant and negative impact on IC performance in terms of VAIC, while only bank efficiency has a significant positive impact on IC performance. Puntillo (2009) investigates the relation between value creation efficiency and firms’ market value and financial performance for a sample of 21 banks listed on the Milan Stock Exchange, though does not find any association, except for a positive and significant association between Capital Employed Efficiency (CEE), as a component of VAIC, and measures of the firm performance. However, Gigante (2013) analyses the relationship between value-creation efficiency and bank market valuations and financial performance for a sample of European quoted banks over the period 2004-2007. He finds a positive and significant relationship between firms’ profitability and VAIC, while an insignificant relationship is found between MTB and VAIC.
In summary, a review of the extant literature reveals that while there is a plethora of empirical studies which employ a single method for IC measurement, studies comparing different IC value measures are scarce. Given that each method has its relative merits, consistent with Goebel (2015), this paper attempts to fill a gap in the literature by comparing the two most commonly utilised IC measurement methods, the MtB and VAIC approaches, in the context of Italian listed companies in order to gauge which is more suitable for capturing IC value as well as the drivers of such value.
Intangible assets
Intangible assets are an important component of IC, and there is a substantial overlap between the two (Osinski et al., 2017). Indeed, intangible assets are widely considered in the literature as synonymous with IC (Lev et al., 2005; Osinski et al., 2017). According to the RBV theory, due to their particular characteristics of rare, strategic and hard-to-imitate resources, they constitute a key source of competitive advantage, ensuring superior economic and financial performance (Villalonga, 2004).
Goebel (2015), analysing a sample of companies listed on the German Stock Exchange for the period 2000-2010, uses the market capitalisation approach to measure IC value, proxied by the LRVTB. However, she does not find any significant association between the dependent variable (LRVTB) and the total intangible assets and R&D expenses.
Cazavan-Jeny (2004) argues that the intensity of intangible asset investments should be positively related to the MtB ratio as the market is capable of valuing those intangible assets which are not adequately recognised in the firm’s balance sheet. However, analysing a sample of French listed companies for the period 1994-1999, the author finds a negative, though insignificant, the association between the MtB ratio and goodwill and R&D expenses. Villalonga (2004) measures IC using R&D, and advertising expenditures recognised in the income statement and (capitalised) intangible assets recognised on the balance sheet and finds a positive association between IC value and such expenditures. Consistent with the existing literature (Cazavan-Jeny, 2004; Bhasin, 2012), and according to the market capitalisation approach, the following hypothesis is stated:
H1a: IC value, measured in terms of MtB, is positively associated with recognised (visible) intangible assets.
To the best of the authors’ knowledge, there are no extant studies which test the relation between VAIC (as the dependent variable) and investment in intangible assets. However, if VAIC measures IC, it should be influenced by investments in, and the management of, intangible assets. Thus, a positive relationship between VAIC and investments in intangibles should be expected. Consistent with this argument, the authors hypothesise that there is a positive relation between VAIC and investment in IA. Accordingly, the hypothesis is stated as follows:
H1b: IC value, measured in terms of VAIC, is positively associated with recognised (visible) intangible assets.
Control variables
The authors add some control variables to their models: profitability, leverage, size and growth. Cazavan-Jeny (2004) finds that profitability in French firms positively affects firm MtB ratios. Consistent with this finding, Forte et al. (2017) analyse a sample of Italian listed companies for the period 2009-2013 and find that profitability positively influences the level of IC proxied by MtB. Several studies investigate the relationship between IC value in terms of VAIC and firms’ profitability (Firer and Williams, 2003; Mavridis, 2004; Chen et al., 2005; Gan and Saleh, 2008; Puntillo, 2009; Ahangar, 2011; Maditinos et al., 2011; Gigante, 2013; Morariu, 2014; Dženopoljac et al., 2016), specifying VAIC as an independent rather than a dependent variable in order to examine whether better IC management affects firms’ profitability. On the contrary, El-Bannany (2008) specifies VAIC as the dependent variable in his model and finds that bank efficiency and profitability both have a positive impact on IC performance. Muhammad and Ismail (2009) examine the relationship between IC and business performance measured in terms of ROA in Malaysian financial firms and find evidence of a positive relationship.
Based on the influential governance position of lenders, Goebel (2015) investigates the relationship between leverage and IC value, in German firms and finds a positive relationship with the leverage ratio. Further, Forte et al. (2017) find a positive relationship between firm leverage and IC value, measured in terms of MtB, for Italian firms. On the other hand, several studies find evidence of a negative influence exerted by leverage on market value due to the higher risk level perceived by investors. Barclay et al. (1995) find that companies with high MtB ratios have significantly lower leverage than companies with low MtB ratios. Antoniou et al. (2008) investigate the determinants of leverage ratios for companies in France, Germany and England and find that the leverage ratio has a negative relation with the MtB ratio. Ogden et al., (2003), analysing a sample of US-listed firms also find a negative relationship between MtB and leverage. Hovakimian et al. (2004), analysing a sample of listed firms for the period 1982-2000, find a negative relationship between MtB and leverage. The authors explain that the negative effect of MtB is consistent with the hypothesis that firms with high growth opportunities have low target debt ratios. An alternative explanation is that managers are reluctant to issue equity when their firm’s MtB ratio is low because they believe that the stock is undervalued.
Leverage measures the debt proportion of financing employed by the company to finance its investment. The higher is the degree of leverage, the greater the financial risk that the firm faces, and in return the greater the profits required by investors to compensate (Suhermin, 2014). To the authors’ best knowledge, no studies investigate the effect of leverage on VAIC as a proxy for IC as the extant literature focuses on VAIC as an independent variable.
Goebel (2015) argues that firm size is a positive driver of IC value, due to the better access to resources enjoyed by larger firms, along with their greater market power. However, Goebel finds a significant and negative relationship between firm size and IC value. In the same vein, Forte et al. (2017), find a negative relationship between firm size and IC value. This negative relationship suggests that the MtB ratio falls as firm size increases, evidencing that due to their lower flexibility and greater complexity, larger firms face more difficulties in the development of IC (Forte et al., 2017).
According to Patton (2007), productivity and growth in revenue of a firm rely more on its IC and business process than on its physical assets. Bontis (2003) argues that leveraging knowledge assets is the key to a firm’s prosperity. Based on these studies, therefore, it may be argued that a firm with higher IC performance is expected to enjoy higher productivity and thereby higher growth in revenue. Thus, companies with greater IC will experience better financial performance, which can be gauged by the growth in revenue (Mohiuddin et al., 2006). Firm growth is also included as a control variable as IC is recognised as a pivotal driver in the generation of economic wealth and growth (Bontis, 2003).
Sample selection and research methodology
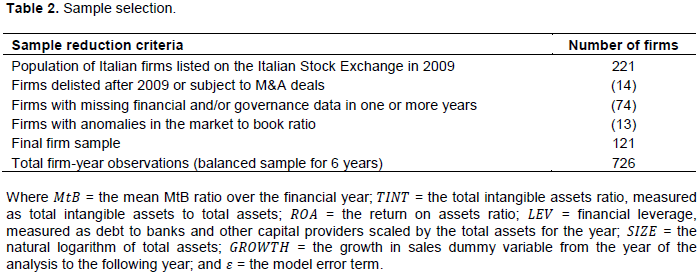
The study sample includes all Italian companies listed on the Milan Stock Exchange. The study period commences in 2009, in order to avoid the direct effect of the global financial crisis on firm market values and extends to the year 2014. All of the accounting and financial market data are collected from the AIDA Database. The sample is initially composed of 221 companies, representing all of 74 companies on the basis of missing data, leaving a sample of 147 companies. The authors also removed 14 firms that were delisted due to mergers, acquisitions, or bankruptcy, and 12 firms with anomalies in their market to book ratios, leaving a final balanced panel of 121 listed firms, thereby providing 726 firm-year observations, as shown in Table 2.
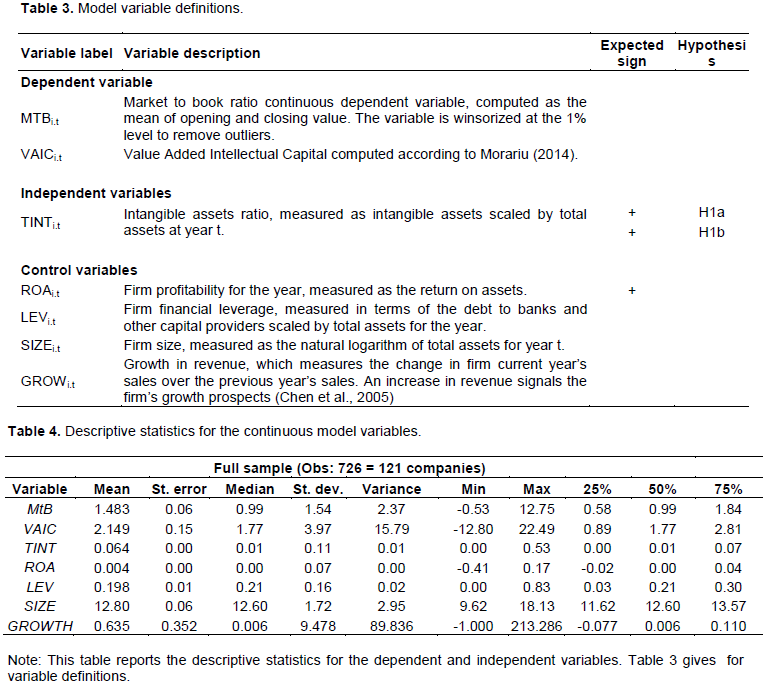
Two alternative dependent variables are used to measure IC value: (i) the market-to-book ratio and (ii) the VAIC. The market-to-book ratio is measured in terms of the mean of the opening and closing values of the market to book ratio in order to smooth some of the volatility in this ratio in a given year. The study sample consists of listed firms which prepare their financial statements following IFRS, so the problem of historical cost accounting is at least partially addressed as the majority of firm assets, and liabilities are assessed at their fair values. IC value is also gauged using VAIC, consistent with Morariu (2014). So, the VAIC is the sum of the three coefficients, VAHU, SCVA, and VACA. The two Equations 1 and 2 are estimated by two linear panel regression models with fixed effect and robust standard errors performed using STATA software (the Hausman test suggested that the fixed effects model was more appropriated than random effects):
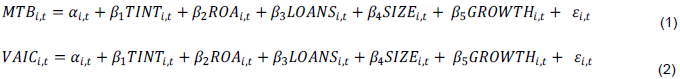
Where = the mean MtB ratio over the financial year; = the total intangibles assets ratio, measured as total intangible assets to total assets; = the return on assets ratio; = financial leverage, measured as the debt to banks and other capital providers, scaled by total assets; = the natural logarithm of total assets; = the growth in sales dummy variable which measures the change in a firm’s current year’s sales over the previous year’s; and = the model error term.
Table 3 provides the definitions for the model variables, along with the coefficient signs expected from the hypotheses stated.
Descriptive statistics
Italian firms listed as at 2009. Then, screening led to the exclusion Table 4 reports the descriptive statistics for the model variables over the sample period 2009-2014. The MtB ratio has a mean of 1.483, and so as authors might expect market value exceeds the book value of firms on average, and thus such firms create significant market value over their book value base. However, while not shown in the table, only 49.31% of the sample firms (N= 358) have an MtB greater than or equal to one, and only 33.61% of the firms have an MtB exceeding the sample mean.
Table 4 also shows that firms have a mean VAIC of 2.149, indicating that on average firms create € 2.149 of firm value for each euro invested in them. While not shown in the table, 38.43% of the sample firms (N= 279) have a VAIC value over the sample mean. Sample firms have an intangible asset (TINT) ratio of 0.064, and thus on average, only 6.4% of firm’ total assets are invested in intangibles, while the sample maximum is 0.53 (53%). The sample firms have a mean ROA of only 0.4%, suggesting that sample firms have weak profitability. Sample firms have a mean leverage ratio (LEV) of 19.80%, and thus on average such firms rely on bank loans to finance 19.80% of their total assets. Firm size (SIZE) is on average € 12.80m when expressed in natural logarithm terms. Table 4 also shows that on average the firms enjoy an increase in revenue (GROWTH) of 0.635 from the previous year, suggesting that IC value, on average, leads to increasing future revenues. The table shows that sample firms in the first quartile suffer a decrease in revenues (of around 7.7%) and this, probably contributes to the low sample firm profitability.
Regression models
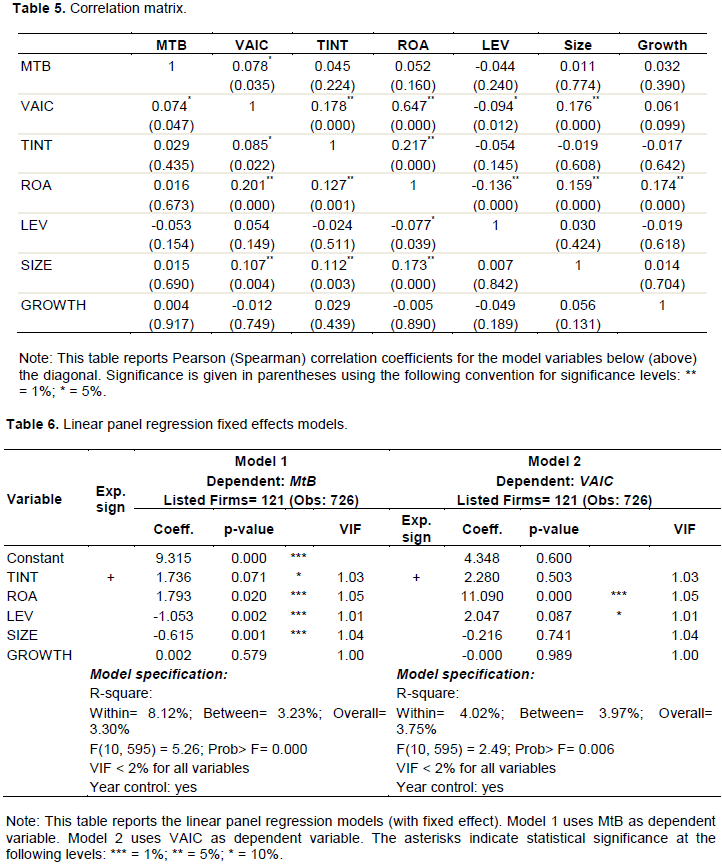
Table 6 presents the results of the linear panel regression models for the two competing dependents, the MtB ratio and VAIC, as proxies for IC value. The F-tests for both Model 1 (F(10, 595) = 5.26; Prob> F= 0.000) and Model 2 (F(10, 595) = 2.49; Prob> F= 0.006) are significant at the 1% level. To test for potential multicollinearity issues, Variance Inflation Factors, reported in the last column of Table 6, are computed for all of the variables, though the statistics are all well below the threshold of 2 for each set of model variables.
In order to compare the two models (Equations 1 and 2, respectively), which differ solely in the dependent variable, in Table 7 the authors estimate two tests (shown in panels A and B, respectively). Panel A shows Zellner’s seemingly unrelated regression (SUREG) and then estimates the linear combinations of parameters in order to test the impact of TINT on the dependent variables MtB and VAIC. Panel B in Table VI7 estimates the Akaike’s information criterion (AIC) and the Bayesian information criterion (BIC), respectively.
Correlation analysis
Table 5 presents a Pearson correlation matrix for the model variables below the diagonal. There is an insignificant positive correlation between MtB and TINT. Further, there is a weak positive correlation between VAIC and TINT. The moderate positive correlation between MtB and VAIC suggests that a higher level of IC is associated with an increase in company value. This finding also suggests that the MtB ratio increases as VAIC increases.
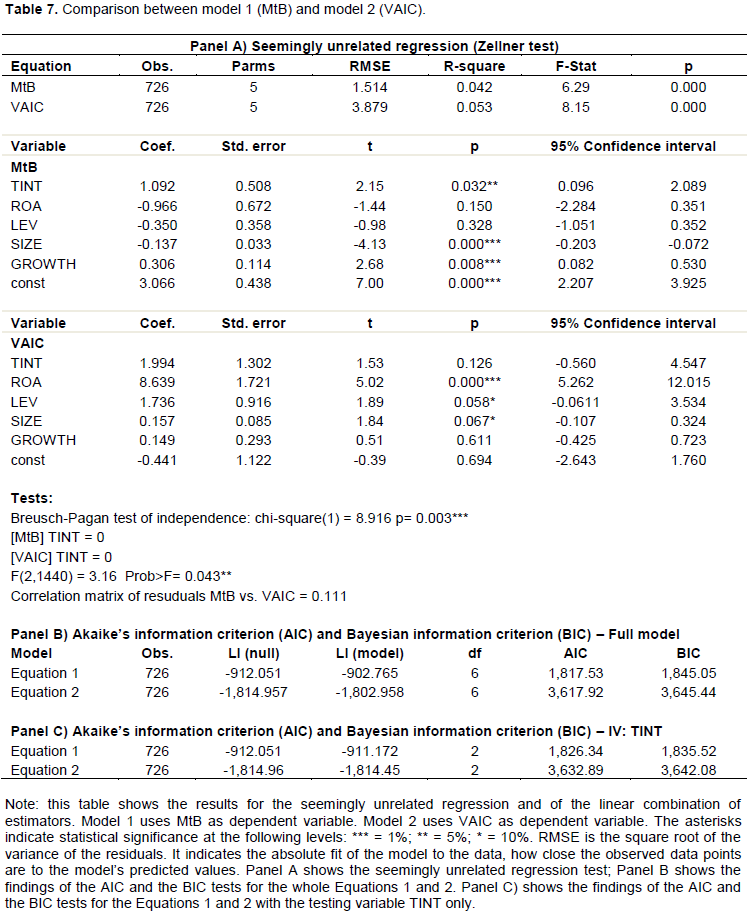
The SUREG test shown in Table 7, panel A, indicates that the coefficient of TINT is 1.092 (significant at the 5% level) in Equation 1, while its coefficient in model 2 is 1.994 (though not significant). The SUREG correlation matrix between MtB and VAIC shows a low positive correlation (0.111), while the Breusch-Pagan test of independence is significant at 1% level. The linear combination of estimators (Table 7) shows a coefficient of -0.901 (even though not significant) that is the difference between the coefficient between TINT and the dependent variables MtB (1.092) and VAIC (1.994), respectively. With the linear combination of estimators, we test the null hypothesis that the difference between the two coefficients above (MtB and VAIC) is zero. Since the test is not significant, we cannot reject the null hypothesis that the difference between the two coefficients (TINT on MtB, and TINT on VAIC) is zero. In sum, our findings suggest that TINT impacts MtB, while it does not impact on VAIC. In conclusion, this test suggests that investments in net (total) intangible assets is a good predictor of the variation in the market-to-book ratio.
These findings were confirmed by the AIC and BIC tests. According to both the AIC and BIC tests, the model with the smaller value of the information criterion fits better (Akaike, 1974; Raftery, 1995). The model in Equation 1 (using MtB as the dependent variable) shows an AIC value of 1,817.53 and a BIC value of 1,845.055, with 6 degrees of freedom. The model in Equation 2 (using VAIC as the dependent variable) shows an AIC value of 3,617.916 and a BIC value of 3,645.441, with 6 degrees of freedom. The results of the AIC and BIC tests, shown in Table VI7, panel C, also do not change if in the regression model we include only the testing variable TINT (the control variables are omitted). Therefore, the findings suggest that model in Equation 1 is better than that in Equation 2, even though the difference between the AIC and BIC values is weak (the difference is included in the range 0-2 times) (Raftery, 1995). These findings suggest little difference between the two models in explaining the influence of TINT and other control variables on the dependent MtB (in Equation 1) and VAIC (in Equation 2). Table 6 shows the results of the two-regression models (Equations 1 and 2) with control variables to corroborate the analysis.
For Model 1 (Equation 1), with MtB as the dependent, the coefficient of TINT is positive, consistent with expectations, though significant only at the 10% level. Consistent with Villalonga (2004), Cazavan-Jeny (2004) and Forte et al. (2017) the positive relationship supports the argument that financial markets place significant emphasis on (recognised) investments in intangible assets by recognising, that such investments will generate future value. So, financial markets incorporate intangible assets into company valuations (OECD, 2006), even though most intangible assets are not included within a company’s financial statements (Bhasin, 2012). Thus, there is some weak support for hypothesis H1a.
With regard to the control variables, the coefficient of the variable ROA is positive and significant at the 1% level. Thus, increasing firm profitability leads to an increase in firm MtB ratios. This finding is consistent with Cazavan-Jeny (2004), Chen et al. (2005) and Forte et al. (2017). The coefficient of the variable LEV is negative, and significant at the 1% level. This finding is consistent with Barclay et al. (1995), Antoniou et al. , (2008), Ogden et al. (2003) and Hovakimian et al., (2004), and provides evidence that firms with high MtB, and thus good growth opportunities, tend to have low target debt ratios.
The coefficient of the variable SIZE is negative and significant at the 1% level. Thus, the MtB ratio falls as firms grow. This supports the argument that bigger firms, which suffer from lower flexibility and greater complexity, face more difficulties in the development of IC value proxied by the MtB ratio (Goebel, 2015; Forte et al., 2017). Finally, the coefficient of the variable GROWTH is positive, though insignificant, a result which is not consistent with the prior literature (Bontis, 2003; Mohiuddin et al., 2006; Patton, 2007).
For Model 2, the coefficient of the variable TINT is positive, as expected, though insignificant. VAIC seeks to measure how much and how effectively IC can create organisational value (Osinski, 2017). It measures how much new value (value added) is created per monetary unit of resources invested. Firm investment in intangible assets, as a proxy for IC value, does not impact immediately on VAIC, but has only as a lagged effect, increasing firm (market) value in the future through an increase in the revenues and cash flows. Thus, H1b is not supported.
With regard to the control variables, the coefficient of the variable ROA is positive, statistically significant at the 1% level. The finding is consistent with El-Bannany (2008), and Muhammed and Ismail (2009) who find a positive relationship between VAIC, or its components, and firm profitability.
The variable LEV has a positive sign, though it is statistically significant only at the 10% level. Thus, the higher is firm leverage and the greater the share of VA which is distributed through the payment of interest, in turn increasing SCVA and VAIC. Moreover, this finding may also be explained by the leverage affecting the relationship between IC and company value as proxied by the VAIC. Neither the SIZE nor GROWTH variables have significant coefficients in Model 2.
The results of Models 1 and 2 give rise to the following observations. First, the authors find that MtB is at least partly driven by a firm’s investment in intangible assets (e.g. patents, trademarks, goodwill, and so on). When capitalised in the statement of the financial position and adequately explained in the notes to the accounts, intangible investments signal to financial markets the efforts made by a company to generate greater revenue and future cash flows compared to firms that do not invest in such assets. The results are consistent with the holistic market-based approach, according to which intangible assets disclosed in the financial statements contribute to IC value (as the difference between market and book value). Secondly, VAIC is not driven by a firm’s investment in intangible assets as the value added only reflects current firms’ performance (and not the prospective economic value of the firm) in the year of the analysis according to the revenues and expenses recognised in the income statement. Finally, the results for hypotheses H1a and H1b suggest that MtB and VAIC provi6derepresent very different IC proxies.
This paper proposes a comparison between two competing measures of IC value, the MtB ratio and VAIC, both of which are widely employed in the IC literature (Bramhandkar et al., 2007; Morariu, 2014). In terms of taxonomy, the two methods are monetary based and belong to the organisational level family (Sydler et al., 2014). Both give rise to a quantitative measure and are based on accounting and market data which are easily obtainable and verifiable, by users of financial statements, thus allowing simple comparison (Jurczak, 2008; Paździor and Paździor, 2012; Sydler et al., 2014). One innovation of this paper is that it enables a comparison of the two competing methods in an Italian context. Another innovation of this study is that it employs the VAIC as a dependent rather than as an independent variable.
Different tests and two-panel linear regression models for a sample of 121 Italian non-listed firms for the period 2009-2014 are estimated. The same set of independent variables is employed in each model to ensure comparability among them. Consistent with expectations, the finding show that MtB captures IC value better than VAIC. This supports the hypothesis that the intensity of intangible asset investment is positively related to the MtB ratio as financial markets can evaluate such assets even though they are not adequately recognised in the balance sheet. However, intangible assets are able to signal investment in knowledge that may create future value for the firm (e.g. investment in patents, trademarks, R&D, and so on). As expected, the investment in intangible assets does not influence VAIC as it appears to be influenced more by the revenues generated by past investments in assets. VAIC assesses actual firm performance in terms of value added in the current year using the estimation of three income statement indicators. Moreover, VAIC is not limited to measuring the impact on overall efficiency of human and structural capital, but also takes account of the contribution of physical capital. In contrast to MtB, stakeholders do not readily obtain VAIC as it requires the estimation of its components.
As expected, the positive relationship between MtB and VAIC and firm profitability suggests that both dependent variables “record” the increase in firm revenue resulting from prior investment strategies in both tangible and intangible assets. ROA gauges the profitability of the firm from investments in not only intangible assets but also tangible assets. Leverage impacts negatively on the MtB ratio because an increase in leverage threatens future firm profitability and value (firm risk increases). In contrast, leverage impacts positively on VAIC due to an increased use of debt and resulting interest payments that will increase SCVA (one of the components of VAIC), given a constant level of value creation.
The negative association between MtB and firm size suggests that the MtB ratio falls as firm size increases, evidencing that bigger firms, due to their lower flexibility and greater complexity, face more difficulties in the development of IC (Goebel, 2015; Forte et al., 2017). However, VAIC is not influenced by firm size, as revenue growth does not impact on this dependent. There is, therefore, no significant relationship between VAIC and firm policies such as intangible resources development or structural firm characteristics such as firm size.
This study is subject to a number of limitations. First, the sample is restricted to 121 Italian listed companies due to the difficulty of collecting a larger dataset. At the end of 2014, only 384 firms were listed on the Italian Stock Exchange. Second, there exist limitations in the financial information available when measuring IC value. In particular, historical costs produce a distorting effect on the difference between market and book value, though Italian listed companies have to prepare both consolidated and separate financial statements according to IFRS since 2005. As a consequence, the criticism of the MtB ratio is partially addressed as assets and liabilities are typically assessed at fair value, and thus do not closely adhere to the historical cost convention.
This study has implications for academic researchers, practitioners, and firm managers. The approach employed allows academic researchers to investigate the most appropriate method for measuring IC value for the benefit of investors. Comparing two of the most commonly employed methods in the literature to measure IC value should aid practitioners and investors to make more judgements that are informed. Omotayo (2015) argues that it is essential for the management of a company to look for the means to gain, maintain, and manage knowledge in order to achieve higher levels of success. The Market Capitalization Approach (which includes the MtB method) sees investment in intangible assets as essential for the generation of higher future profits. The findings of this paper suggest that managers should try to address the risk that firm growth may lead to a diminution of IC value through the application of a consistent IC-oriented investment strategy. Further, practitioners such as financial analysts should be aware of the existence of different ways of measuring firm performance, as results evidence that VAIC and ROA are highly related. It is worth exploring from a non-shareholder perspective the many facets of corporate performance in order to address the needs of all stakeholders.
Finally, this study helps to identify avenues for future research. First, to address one limitation of this paper, other IC measurement models might be tested. Second, further sources of information available to investors might be explored regarding company intangible investment policies, including narrative disclosures, thus enabling a broader mixed methods perspective. Third, the methodological approach adopted in this paper may be replicated in a wider international comparative study.
The authors have not declared any conflict of interests.
REFERENCES
|
Ahangar RG (2011). The relationship between intellectual capital and financial performance: An empirical investigation in an Iranian company. African Journal of Business Management 5(1):88-95.
|
|
|
|
Akaike H (1974). A New Look at the Statistical Model Identification. IEEE Transactions on Automatic Control 19(6):716-723.
Crossref
|
|
|
|
|
Andriessen D (2004). IC valuation and measurement: classifying the state of the art. Journal of Intellectual Capital 5(2):230-242.
Crossref
|
|
|
|
|
Anghel I (2008). Intellectual capital and intangible assets analysis and valuation. Theoretical and Applied Economics 3(3):75-84.
|
|
|
|
|
Antoniou A, Guney Y, Paudyal K (2008). The determinants of Capital Structure: Capital Market-Oriented versus Bank-Oriented Institutions. The Journal of Financial and Quantitative Analysis 43(1):59-92.
Crossref
|
|
|
|
|
Barclay MJ, Smith CW, Watts RL (1995). The determinants of corporate leverage and dividend policies. Journal of Applied Corporate Finance 7(4):4-19.
Crossref
|
|
|
|
|
Bhasin ML (2012). Measurement and disclosure of intellectual capital in a developing country: An exploratory study, Australian Journal of Business and Management Research 2(8):63-75.
|
|
|
|
|
Bontis N (2003). Intellectual capital disclosure in Canadian corporations. Journal of Human Resource Costing and Accounting 7(1):9-20.
Crossref
|
|
|
|
|
Bramhandkar A, Erickson S, Applebee I (2007). Intellectual capital and organizational performance: an empirical study of the pharmaceutical industry. The Electronic Journal of Knowledge Management 5(4):357â€362.
|
|
|
|
|
Brennan N (2001). Reporting intellectual capital in annual reports: e6dence from Ireland. Accounting, Auditing and Accountability Journal 14(4):423-436.
Crossref
|
|
|
|
|
Cazavan-Jeny A (2004). Le ratio market-to-book et la reconnaissance des immatériels-une étude du marché français, Comptabilité-Contrôle-Audit 10(2):99-124.
Crossref
|
|
|
|
|
Chen MC, Cheng SJ, Hwang Y (2005). An empirical investigation of the relationship between intellectual capital and firms' market value and financial performance. Journal of Intellectual Capital 6(2):159-176.
Crossref
|
|
|
|
|
Dumay J (2016). A critical reflection on the future of intellectual capital: from reporting to disclosure. Journal of Intellectual Capital 17(1):168-184.
Crossref
|
|
|
|
|
Dumay JC (2009). Intellectual capital measurement: a critical approach. Journal of Intellectual Capital 10(2):190-210.
Crossref
|
|
|
|
|
Dženopoljac V, Janoševic S, Bontis N (2016). Intellectual capital and financial performance in the Serbian ICT industry. Journal of Intellectual Capital 17(2):373-396.
Crossref
|
|
|
|
|
El-Bannany M (2008). A study of determinants of intellectual capital performance in banks: the UK case. Journal of Intellectual Capital 9:487-498.
Crossref
|
|
|
|
|
Firer S, Williams M (2003). Intellectual capital and traditional measures of corporate performance. Journal of Intellectual Capital 4(3):348-360.
Crossref
|
|
|
|
|
Forte W, Tucker J, Matonti G, Nicolò G (2017). Measuring the intellectual capital of Italian listed companies. Journal of Intellectual Capital 18(4):710-732.
Crossref
|
|
|
|
|
Gan K, Saleh Z (2008). Intellectual capital and corporate performance of technology-intensive companies: Malaysia evidence. Asian Journal of Business and Accounting 1(1):113-130.
|
|
|
|
|
Gigante G (2013). Intellectual Capital and Bank Performance in Europe. Accounting and Finance Research 2(4):120-129.
Crossref
|
|
|
|
|
Goebel V (2015). Estimating a measure of intellectual capital value to test its determinants. Journal of Intellectual Capital 16(1):101-120.
Crossref
|
|
|
|
|
Hovakimian A, Hovakimian G, Tehranian H (2004). Determinants of target capital structure: The case of dual debt and equity issues. Journal of financial economics 71(3):517-540.
Crossref
|
|
|
|
|
Iazzolino G, Laise D (2013). Value added intellectual coefficient (VAIC) A methodological and critical review. Journal of Intellectual Capital 14(4):547-563.
Crossref
|
|
|
|
|
Jurczak J (2008). Intellectual capital measurement methods. Economics and Organization of Enterprise 1(1):37-45.
Crossref
|
|
|
|
|
Khalique M, Bontis N, Abdul Nassir bin Shaari J, Hassan Md IA (2015). Intellectual capital in small and medium enterprises in Pakistan. Journal of Intellectual Capital 16(1):224-238.
Crossref
|
|
|
|
|
Lev B, Cañibano L, Marr B (2005). An accounting perspective on intellectual capital. In: Marr, B. (Ed.) Perspectives on Intellectual Capital. Oxford UK pp. 42-55.
Crossref
|
|
|
|
|
Maditinos D, Chatzoudes D, Tsairidis C, Theriou G (2011). The impact of intellectual capital on firms' market value and financial performance. Journal of intellectual capital 12(1):132-151.
Crossref
|
|
|
|
|
Mavridis DG (2004). The intellectual capital performance of the Japanese banking sector. Journal of Intellectual capital 5(1):92-115.
Crossref
|
|
|
|
|
Mohiuddin M, Najibullah S, Shahid AI (2006). An exploratory study on intellectual capital performance of the commercial banks in Bangladesh. The Cost and Management 34(6):40-54.
|
|
|
|
|
Morariu MC (2014). Intellectual capital performance in the case of Romanian public companies. Journal of Intellectual Capital 15(3):392-410.
Crossref
|
|
|
|
|
Muhammad NMN, Ismail MKA (2009). Intellectual capital efficiency and firms' performance: study on Malaysian financial sectors. International Journal of Economics and Finance 1(2):206-212.
Crossref
|
|
|
|
|
OECD (2006). Creating Value from Intellectual Capital. Meeting of the OECD Council at Ministerial Level. Available at:
View
|
|
|
|
|
Ogden JP, Jen FC, O'Connor PF (2003). Advanced corporate finance: policy and strategies. New Delhi: Pearson Education, Singapore. pp. 146-186.
|
|
|
|
|
Omotayo FO (2015). Knowledge Management as an important tool in Organisational Management: A Review of Literature. Library Philosophy and Practice 1(2015):1-23.
|
|
|
|
|
Osinski SPM, Matos F, Roman DJ (2017). Methods of evaluation of intangible assets and intellectual capital. Journal of Intellectual Capital 18(3):470-485.
Crossref
|
|
|
|
|
Patton JR (2007). Metrics for knowledge-based project organizations. Academic Management Journal 72(1):33-43.
|
|
|
|
|
Paździor A, Paździor M (2012). Measurement of intellectual capital in a company, In International Conference Management, Knowledge and Learning: 843-849.
|
|
|
|
|
Pena ND, Ruiz VRL, Navarro JLA (2012). A case study of control strategy based on intellectual capital management. African Journal of Business Management 6(16):5622-5632.
Crossref
|
|
|
|
|
Pulic A (1998). Measuring the performance of intellectual potential in the knowledge economy. The 2nd World Congress on the Management of Intellectual Capital, Hamilton, ON, January 21-23.
|
|
|
|
|
Pulic A (2000). VAICt - an accounting tool for IC management. International Journal of Technology Management 20(5-8):702-714.
Crossref
|
|
|
|
|
Puntillo P (2009). Intellectual capital and business performance, Evidence from Italian banking industry. Electronic Journal of Corporate Finance 4(12):97-115.
|
|
|
|
|
Raftery AE (1995). Bayesian model selection in social research. Sociological Methodology 25:111-163.
Crossref
|
|
|
|
|
Ramanauskaitė A, Rudžionienė K (2013). Intellectual capital valuation: methods and their classification. Ekonomika 92(2):79-92.
Crossref
|
|
|
|
|
Smriti N, Das N (2018). The impact of intellectual capital on firm performance: a study of Indian firms listed in COSPI. Journal of Intellectual Capital 19(5):935-964.
Crossref
|
|
|
|
|
Stahle P, Stahle S, Aho S (2011). Value added intellectual coefficient (VAIC): a critical analysis, Journal of Intellectual Capital 12(4):531-551.
Crossref
|
|
|
|
|
Stewart T (1997). Intellectual Capital: The New Wealth of Nations. Doubleday Dell Publishing Group, New York, NY.
|
|
|
|
|
Suhermin A (2014). The effect of intellectual capital on stock price and company value in manufacturing companies listed in Indonesia Stock Exchange 2008-2012 with size and leverage as moderating variables. The Indonesian Accounting Review 4(02):157-168.
Crossref
|
|
|
|
|
Sveiby K (2001). Methods for measuring intangible assets. Available at
View
|
|
|
|
|
Sydler R, Haefliger S, Pruksa R (2014). Measuring intellectual capital with financial figures: Can we predict firm profitability?. European Management Journal 32(2):244-259.
Crossref
|
|
|
|
|
Tan Pew H, Plowman D, Hancock P (2007). Intellectual capital and financial returns of companies. Journal of Intellectual capital 8(1):76-95.
Crossref
|
|
|
|
|
Tseng KA, Lin CI, Yen SW (2015). Contingencies of intellectual capitals and financial capital on value creation: Moderation of business cycles. Journal of Intellectual Capital 16(1):156-173.
Crossref
|
|
|
|
|
Van der Meer-Kooistra J, Zijlstra SM (2001). Reporting on intellectual capital. Accounting, Auditing and Accountability Journal 14(4):456-476.
Crossref
|
|
|
|
|
Villalonga B (2004). Intangible resources, Tobin'sq, and sustainability of performance differences. Journal of Economic Behavior and Organization 54(2):205-230.
Crossref
|
|
|
|
|
Zou X, Huan TC (2011). A study of intellectual capitals impact on listed banks performance in China. African Journal of Business Management 5(12):5001-5009.
|
|