ABSTRACT
This paper investigates the role of speculative activity in the agricultural commodity futures market in the period 2006-2017. Specifically, the study tests the causal relationship between the prices of fourteen agricultural commodities listed on the US commodity market Chicago Mercantile Exchange (CME) and Chicago Board of Trade (CBT) and the trading activity of commodity index traders (CITs) and swap dealers. The analysis uses the Granger Causality test based on a seemingly unrelated regression (SUR) system. The results show that CIT and swap dealer positions did not significantly influence prices of agricultural commodities, but might explain the increase in their price volatility. The findings disprove Masters’ hypothesis that speculators produced a bubble in the commodity market. In this context, any attempt (such as taxes) by lawmakers to limit speculation should be carefully evaluated.
Key words: Commodity index traders, swap dealers, agricultural futures market, Masters’ hypothesis, Granger causality.
In recent years, prices of agricultural commodities have undergone abrupt variations, which have threatened food security of countries, which are more dependent on food imports and characterized by poverty. The phenomenon has attracted the attention of food policy makers and academics, who investigate both causes and possible solutions. The rising level and volatility of food prices was particularly evident in 2007-2008. FAO (2009) states that in fact there was a real "surge" in both spot and future prices in that period, and it generated an increase of about 100 million undernourished individuals worldwide. These fluctuations continued in the following years: in 2009 there was a collapse in prices, but prices rose again in 2011. From 2011 to 2014, agricultural commodity prices were stable, but later they declined again and in 2016 the FAO food price index reached the same level as 2007 (FAO, 2017).
There are many possible economic reasons for these anomalous price movements, including the progressively extreme weather conditions, the development of emerging economies (particularly China), and the increasing use of land for the production of biofuels instead of food.
However, according to Gheit (2008), Masters and White (2008), Petzel (2009), Hamilton (2009), Einloth (2009), Robles et al. (2009), Wahl (2009), Gilbert (2010), and Tang and Xiong (2012), factors related to changes in supply and demand fundamentals cannot fully explain the high volatility of agricultural commodity prices since 2007. The other factor that could have increased volatility since 2007 is excessive speculation. On this point, Masters (2008), Masters and White (2008), and Gilbert (2010) find that speculators and, among others, commodity index traders (CITs), could have caused a bubble that burst in 2009, generating a sudden and unexpected drop in commodity prices.
There are in fact several explanations for the “special” role of CITs in increasing commodity price volatility. First, they mainly take long positions and renew them through the rollover technique, without disinvesting before the expiration date. Moreover, unlike “traditional” speculators, CITs invest in different commodity indices rather than focusing on a specific one. This makes their participation in different commodity markets very wide. Finally, CITs cannot only buy long-term derivatives directly on futures market, but can also invest in commodity indices "sold" by swap dealers, and thus be involved in numerous contracts.
The idea that excessive speculation in the commodity futures market could have pushed future and spot prices up above levels justified by supply and demand fundamentals thus creating a ‘bubble’, was first put forward by Masters (2008) and is thus known in the literature as “Masters' hypothesis”. Michael Masters, the director of the hedge fund Master Capital Management L.L.C., in fact put forward his theory to the permanent subcommittee of the United States Senate (2009), set up to investigate anomalies in wheat prices by the Chicago Board of Trade. Specifically, Masters accused CITs of being responsible for commodity price fluctuations recorded in 2007-2008 and called for the Senate to establish stringent limits to speculation (FAO, 2009).
Masters’ hypothesis was supported with data published in the SCOT reports by the Commodity Futures Trading Commission (CFTC). These showed a significant increase in the open interest held by CITs in 2007, 2008, 2010 (when the threshold of 500,000 contracts on corn was exceeded) and 2014. The data also proved the rapid and significant growth in volumes of contracts. In the case of corn, for example, the number of future contracts rose from 273,000 in December 2008 to almost 405,000 in December 2009.
Masters’ hypothesis led to heated debate about the role of CITs in the commodity futures market.
Some authors share Masters’ point of view (Gheit, 2008; Masters and White, 2008; Petzel, 2009; Hamilton, 2009; Einloth, 2009; Robles et al., 2009; Wahl, 2009; Gilbert, 2010; Tang and Xiong, 2012; Van Huellen, 2019).
Other authors, "skeptics" (Headey and Fan, 2008; Brunetti and Büyüksahin, 2009; Irwin et al., 2009; Till, 2009; Aulerich et al., 2009; Sanders et al., 2010; Stoll and Whaley, 2010; Buyuksahin and Harris, 2011; Capelle-Blancard and Coulibaly, 2011; Irwin et al., 2011; Rouwenhorst and Tang, 2012), find that Masters’ bubble hypothesis shows weaknesses and is not consistent with typical market mechanisms.
Moreover, studies by the World Bank (2008) and Childs and Kiawu (2009) follow a weaker version of Masters' hypothesis, finding that the absence of a statistically significant impact of the speculator activity on commodity futures prices does not imply that this activity had no effect at all.
Overall, previous literature finds conflicting evidence that Masters’ hypothesis provides a valid explanation of agricultural future market functioning, and further studies on the real impact of speculator positions are needed. In this context, this paper aims to test the possible Causality relation between the trading activity of CITs and swap dealers and the prices and price volatility of the main agricultural commodities in the period 2006-2017. Specifically, our paper tries to answer the following research questions: (i) did CITs and swap dealers’ trading activity influence agricultural commodities prices in the period 2006-2017? and (ii) did CITs and swap dealers’ trading activity influence agricultural commodities price volatility in the same period?
The study enriches previous literature from different points of view. First, to our knowledge, our dataset is the first to include not only the 12 agricultural commodity markets of the SCOT report, but also the soybean meal and the oats markets. A second innovation is the extension of the time horizon, as our data are collected from 13 June 2006 to 26 December 2017, for a total of 603 observations. We also improve previous literature from a methodological point of view as we calculate the Granger Causality by using a SUR system. Finally, we use two different proxies for speculation: the working T index (long-term speculation) and the volume of open interest ratio (short-term speculation).
The rapid increase in agricultural commodity prices recorded in mid-2008, their rapid subsequent decrease and their further fluctuations in the following years stimulated a debate on the role of speculation in financial markets.
In this context, in 2008 Michael Masters put forward his hypothesis. The large amount of speculative funds invested in different types of agricultural commodity derivatives in recent years and the significant and unwarranted upward pressure on their prices support the validity of Masters’ hypothesis in the agricultural commodity market.
The first strand of literature shares Masters’ point of view (Gheit, 2008; Masters and White, 2008; Petzel, 2009; Hamilton, 2009; Einloth, 2009; Robles et al., 2009; Wahl, 2009; Gilbert, 2010; Tang and Xiong, 2012; Van Huellen, 2019).
Gilbert (2010) examines commodity price trends in different futures markets: crude oil, aluminium, nickel, copper, corn, soybeans, and wheat. He finds evidence that in the period under investigation (2006-2008 for crude oil and grains and 2000-2008 for three non-ferrous metals), commodity index funds influenced commodity futures prices in two of the seven markets. Specifically, the author identifies three bubbles for copper (in 2004, 2006 and 2008) and a bubble for soybeans (at the beginning of 2008).
Tang and Xiong (2012) demonstrate that, together with the rapid growth of investments in commodity indices, non-energy commodity prices became increasingly correlated with oil prices in the period 1998-2011. They interpret this result as evidence that the price of agricultural commodities was influenced not only by fundamentals, but also by the trading activity of speculative funds, and the process of “market financialization” led to a growing correlation between commodities.
Petzel (2009) supports Masters’ hypothesis, finding that unleveraged futures positions of index funds represented new demand and the amount of these investments was “too big” for the size of the commodity futures market.
According to Wahl (2009), the sudden rise in commodity prices recorded in the period 2006-2008, proved by an increase in the FAO index of 71%, could not be explained by long-term factors such as the demand of emerging countries or stagnation of production. It could only be explained by food speculation. Moreover, Einloth (2009) supports Masters’ hypothesis using the basic theory of storage. This theory, which states that low inventories lead to the rise of commodity prices and the increase of marginal convenience yield, was not however completely verified by the author for the oil market. Einloth (2009) interprets his result as evidence that the oil price peaks recorded in 2008 were due to the effects of speculation, although he does not focus specifically on index trader activities. These ideas were shared by Gheit (2008) and Hamilton (2009).
Robles et al. (2009) also support this view. Their analysis, based on 49 Granger Causality tests and developed using different speculation proxies, shows in fact that index trader speculative activity positively influenced the prices of four agricultural commodities (maize, rice, soybeans and wheat) in the period 2006-2008. The same conclusion is reached by Van Huellen (2019) in his study of three agricultural commodities (wheat, corn and soybeans) in the period 2006-2015.
Sharing the bubble hypothesis, Masters and White (2008) recommended three specific regulatory steps to establish more stringent limits on speculation. The first step was re-establishing speculative position limits for all products and all markets, to be applied every month by the CFTC instead of on a spot basis. Second, they called for an amendment to the Commodity Exchange Act, in order to define excess speculation numerically in terms of open interest. The third step was legislation aiming to eliminate or, at least, drastically reduce, index speculation.
Masters’ hypothesis was also supported by the U.S. Senate Permanent Subcommittee on Investigations (2009), which was established to examine the performance of the Chicago Board of Trade’s (CBOT) wheat futures contract. The subcommittee, in its report dated 24 June 2009, concluded in fact that: "there is significant and persuasive evidence to conclude that these commodity index traders, on the whole, were one of the main causes of unjustified changes in the price of futures contracts on wheat compared to the price of wheat in the spot market".
However, Masters’ hypothesis shows some weaknesses. The "skeptics", including Headey and Fan (2008), Brunetti and Büyüksahin (2009), Irwin et al. (2009), Till (2009), Aulerich et al. (2009), Sanders et al. (2010), Stoll and Whaley (2010), Buyuksahin and Harris (2011), Capelle-Blancard and Coulibaly (2011), Irwin et al. (2011), Hamilton and Wu (2012), Rouwenhorst and Tang (2012), Sanders and Irwin (2013), Sanders and Irwin (2016), and Etienne et al. (2017), argue in fact that the bubble hypothesis has several critical aspects and is not consistent with typical market mechanisms.
Specifically, Irwin et al. (2009) identify three logical inconsistencies. The first is equating money flows into derivatives markets with demand for physical commodities. Combined with the evidence that commodity future markets are zero-sum, this suggests that money flows in themselves did not necessarily impact prices. Moreover, Irwin et al. (2009) find that, as CITs are rarely involved in the delivery process of physical commodities or the cash market in general, their trading could have not influenced the equilibrium cash prices. The third inconsistency is identifying index funds as pure risk-seeking speculators and hedgers as pure risk avoiding, because on the market speculators sometimes hedge and hedgers sometimes speculate.
In addition to these “errors”, there are other ways in which the bubble hypothesis is not convincing, as suggested by Irwin et al. (2009). First, if the hypothesis held, many investments made by index traders should have been linked to an increase in stocks while, in reality, in the period 2006-2008 stocks declined in most commodity markets. Second, in the same period, the relationship between prices and inventories for storable commodities was convex. Moreover, markets with the highest concentration of index fund positions showed the smallest price increases (Irwin et al., 2009), which is the opposite of what the bubble hypothesis predicts. Furthermore, the buying positions of index funds were very predictable, and this conflicts with theoretical models based on the assumption of unpredictable trading patterns of these traders to make arbitrage risky. Fifth, price increase in 2006-2008 was also recorded in markets without index fund participation and for commodities without futures markets (Headey and Fan, 2008; Stoll and Whaley, 2010). Again, in the same period, speculation was not excessive if properly compared to the demand for hedging. Speculation in fact should not be considered excessive only in terms of capital flows speculated; the needs of hedgers also need to be taken into account. On this point, the absence of excessive speculation was tested by Buyuksahin and Harris (2011) in the crude oil futures market in 2004-2009, by Till (2009) in the crude oil, heating oil, and gasoline futures markets in 2006-2009 and by Sanders et al. (2010) in nine agricultural futures markets in 2006-2008. The role of CITs in creating a bubble in the commodity futures market is also minimized by Stoll and Whaley (2010). They show that commodities outside an index are correlated with those within an index to the same extent that they are correlated each other. In their opinion, this means that fundamentals, rather than CIT investments, explain the correlation.
In this context many studies, using the Granger Causality test, find very little evidence of a causal relationship between index fund positions and movements in different agricultural commodity futures prices. This supports the idea that index funds did not cause a bubble (Brunetti and Büyüksahin, 2009; Aulerich et al., 2009; Capelle-Blancard and Coulibaly, 2011; Irwin et al., 2011; Rouwenhorst and Tang, 2012; Gilbert and Pfuderer, 2014; Garcia et al., 2015; Donati et al., 2016; Etienne et al., 2017).
Specifically, Irwin et al. (2011) find evidence that Masters’ hypothesis could be verified in the period January 2004-September 2009 only for the corn market (and not for corn, soybeans and wheat considered jointly), and only when the percentage of open interest was used as proxy of speculation. They also find a negative relation between the two variables rather than a positive one, as one would expect if index traders had actually been responsible for the bubble.
Capelle-Blancard and Coulibaly (2011) also find very little evidence of a causal relationship between index fund positions and movements in the futures prices of the twelve commodities examined in the SCOT reports in the period 2006-2010.
Moreover, Brunetti and Büyüksahin (2009), using not-publicly available data provided by the CFTC large trader reporting system, test the Granger Causality between the daily rate of returns of futures contracts on corn and other non-agricultural commodities and the daily positions of the five most important categories of traders in two different periods (2005-2009 for non-agricultural commodities and 2006-2009 for corn). They find that corn prices were not affected by trader positions. The same not-publicly available data, referring to the twelve agricultural commodities analyzed in the SCOT reports, are used by Aulerich et al. (2009), who find no evidence of the validity of Masters’ hypothesis.
Rouwenhorst and Tang (2012) also find very weak evidence of a causal relationship between index trader positions and movements in the futures prices of the twelve commodities examined in the SCOT reports. Their results show in fact that in the period 2006-2010, only one commodity of twelve passed the Granger Causality test, and with a negative coefficient. Also Gilbert and Pfuderer (2014) use the same test in order to verify the role of CIT positions in explaining weekly returns of four commodities (corn, soybeans, CBOT wheat and KCBT wheat) in the period January 2006-December 2011. Their evidence shows no Causality at the 5% significance level and a weak negative Causality at the 10% significance level, only in the corn market. This appears to confirm that index traders bore no responsibility for the rise in agricultural commodities weekly returns.
Moreover, Donati et al. (2016) consider the twelve agricultural commodities of the SCOT reports in order to test the causal relationship between CIT positions and commodities returns and both realized and implied volatility between 2006 and 2015. They also investigate the inverse relationship between these variables and, in order to use daily as well as weekly data, choose the volume to open interest ratio (VOIR) as proxy of trading activity. Their results find no significant relationships except for a negative link between trading activity (measured by VOIR) and realized volatility. Finally, Etienne et al. (2017) find mixed results in their study of the causal relationship between CIT net long positions and the weekly returns of four agricultural commodities (corn, soybeans, CBOT wheat and KCBT wheat) in the period January 2004-June 2015 using the Granger test. Specifically, they find a weak and negative relationship between the variables investigated only on the corn market.
In order to overcome possible limits of the Granger Causality test, Sanders and Irwin (2016) test the same relationship investigated by Etienne et al. (2017) using a Fama-MacBeath regression, considering the 19 markets appearing in the IDD reports. Their estimations, conducted from 2008 to 2015 on annual, quarterly and monthly data, show no positive relationship between CIT positions and commodities market returns. In fact, they even find slight evidence of a reduction in returns due to index traders’ purchases.
However, the absence of a statistically significant causal relationship between commodity futures prices and index fund positions does not imply that trading activity of CITs had no effect at all. A weaker version of Masters' hypothesis may in fact be useful. This is the idea of the World Bank (2008), Robles et al. (2009), and studies by Childs and Kiawu (2009), which identify the massive amount of investments by non-commercial traders in the agricultural commodity market as one of the different elements leading to the agricultural commodity price rise in 2008.
Overall, the literature finds conflicting evidence that CIT speculative activity in the futures market has been a source of agricultural commodity price rises in recent years. Most papers seem not to support Masters’ hypothesis, and agree that there is no direct impact of commodity index funds on commodity futures prices. However, these studies are based on different samples and time horizons, which means their results are not comparable. Further research on the market impact of agricultural commodity index funds is needed.
This paper attempts to fill this gap by testing the possible Causality relation between the trading activity of CITs and swap dealers and prices and price volatility of the main agricultural commodities in the period 2006-2017.
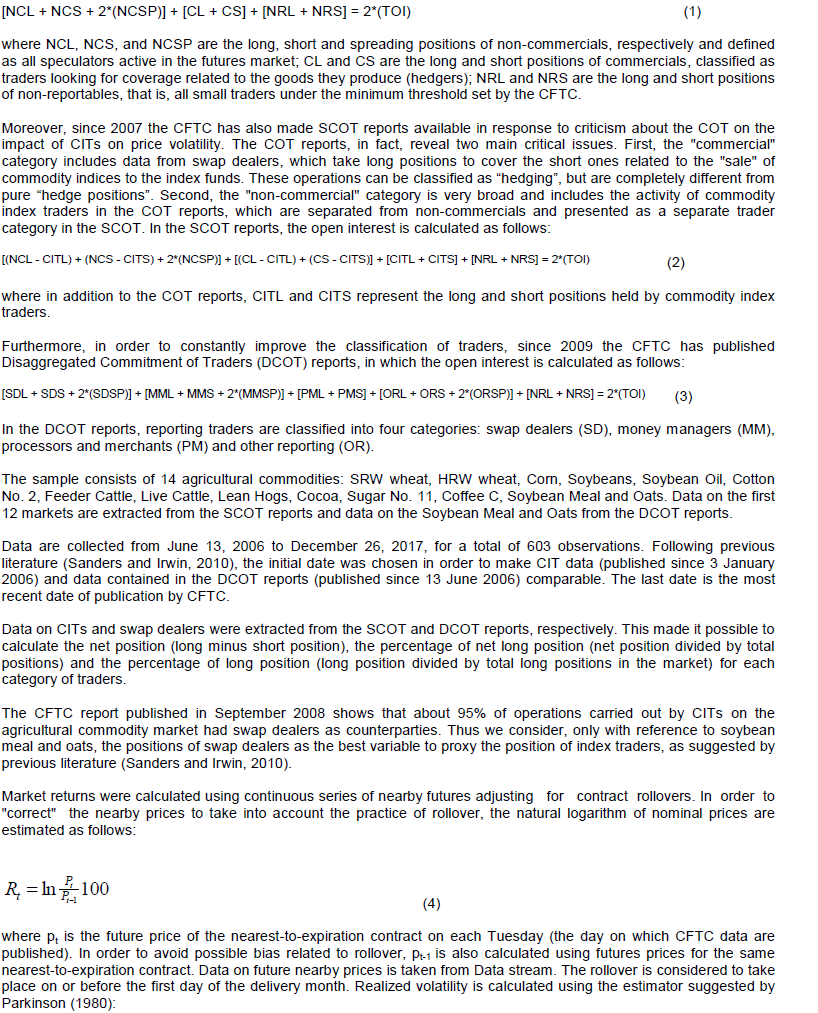
Data on trading activity was collected on the commodity US futures markets Chicago Mercantile Exchange (CME) and Chicago Board of Trade (CBT) provided by the Commodity Futures Trading Commission (CFTC) in the following reports: Commitments of Traders (COT), Supplemental Commitment of Traders (SCOT) and Disaggregated Commitment of Traders (DCOT). The COT reports, published since 1985, provide a weekly breakdown of open interest for futures and options on futures markets in which 20 or more traders hold positions equal to or above the reporting levels established by the CFTC. The total open interest is divided among different categories of traders as follows:
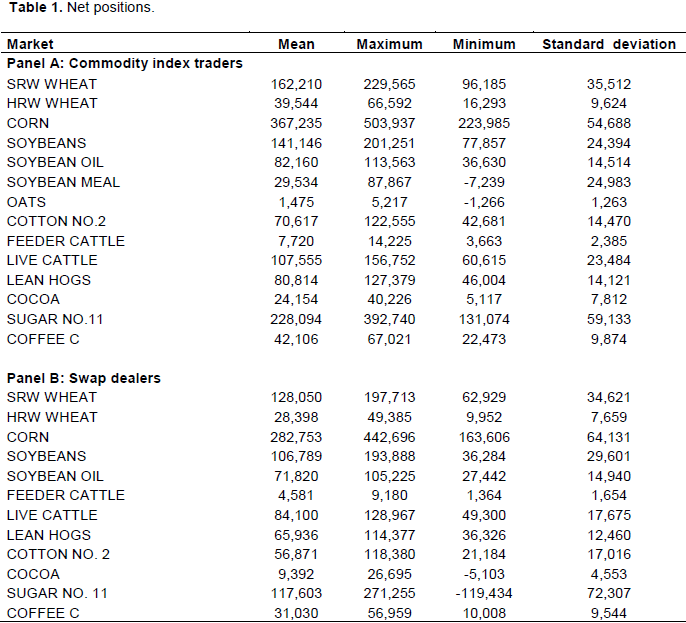
The software Eviews was used for the econometric analysis. As regards our sample, data provided by the CFTC enable us to estimate the net long position of index traders and swap dealers in the period 2006-2017. The net position was calculated by subtracting short positions from long positions (in number of contracts): a positive value indicates a net long position, while a negative value indicates a net short position. Summary statistics are shown in Table 1.
Table 1 shows the net positions held by CITs (Panel A) and swap dealers (Panel B) from June 2006 to December 2017. Data are extracted from the CFTC website.
CITs show a positive minimum net position for all commodities except soybean meal and oats (Table 1, Panel A). Consequently, for these two markets, as suggested by Sanders and Irwin (2010), we consider swap dealer data as proxy for index trader data. Swap dealers show a negative minimum net position in two markets (cocoa and sugar No. 11), as shown in Table 1, Panel B. This indicates that the correspondence between positions of swap dealers and index traders was not perfect in the period 2006-2017. This evidence is consistent with results of Sanders and Irwin (2010), who found a negative net long position for the same two markets in the period 2006-2010. Table 1 also shows that CITs always have longer positions than swap dealers.
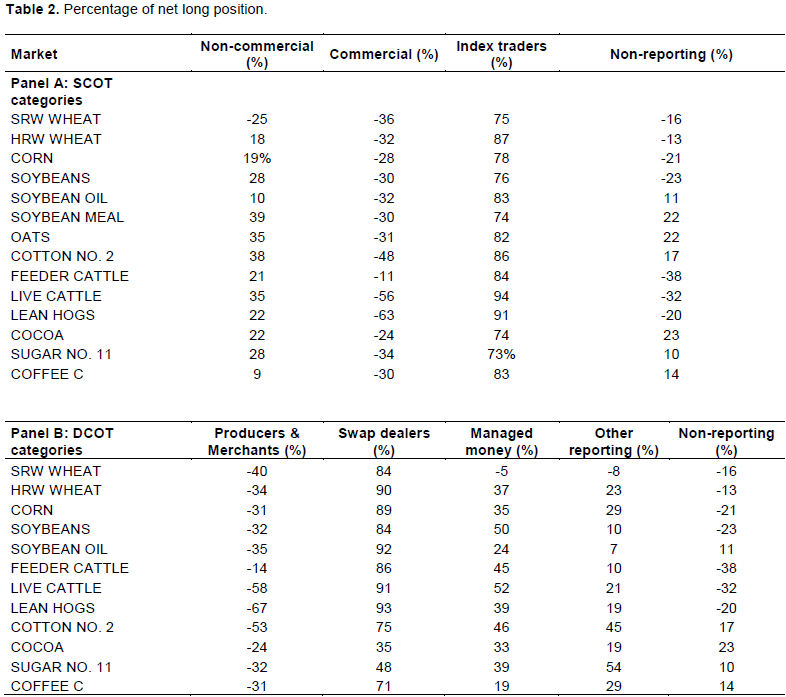
Moreover, we estimate the net long position of index traders and swap dealers by means of an alternative measure. Table 2 shows in fact the percentage of net long position held by SCOT categories (Panel A) and DCOT categories of traders (Panel B) from June 2006 to December 2017. The percentage of net long position is calculated by dividing the net position by the total positions held by each category of trader. This indicator reveals whether traders are focused on the long or short side of the market.
Table 2 shows the percentage of net long positions held by SCOT categories (Panel A) and DCOT categories (Panel B) from June 2006 to December 2017. Data were extracted from the CFTC website.
Index traders show a positive percentage of net long position in each market, with a range varying from 73% (sugar No. 11) to 94% (live cattle), as shown in Table 2, Panel A. This indicates that these traders concentrated on the long side of the market in the period 2006-2017. The percentage of net long position of commercials is however always negative. This is not surprising given that this category of traders includes hedgers, who focus on the short side of the market in order to cover the risk related to the production of agricultural commodities. Moreover, the net positions of non-commercial are always positive, except for SRW wheat.
Despite the different classification of traders, Table 2, Panel B shows that the net position of producers and merchants (which roughly corresponds to the category “commercials” in Table 2, Panel A) is negative in every market, while the net position of managed money and other reporting is always positive, except for SRW wheat. Swap dealers concentrate on the long side of the market and report very high percentages.
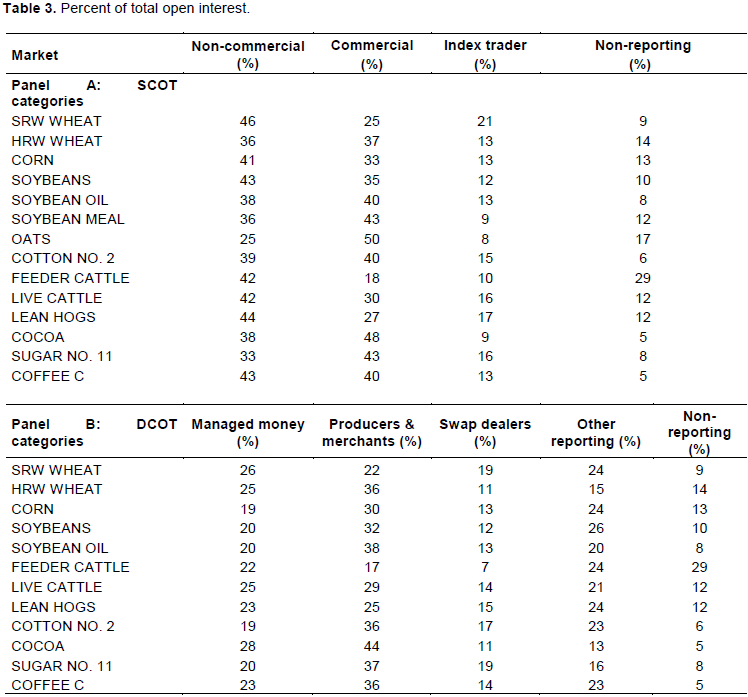
The net positions and the percentage of net long position reveal whether traders operate mainly on the long or the short side of the market. In order to identify the importance of each category, it is however necessary to quantify speculation. The percentage of open interest (short-term speculation) held by each trading category is shown in Table 3.
Table 3 shows the percentage of total open interest hold by SCOT categories (Panel A) and DCOT categories of traders (Panel B) from June 2006 to December 2017. Data are extracted from the CFTC website.
Table 3, Panel A shows that the highest percentage of open interest is held by non-commercials and commercials traders, while index traders hold a lower percentage ranging from 9 to 21%. This demonstrates that overall the participation of index traders in the market in the period 2006-2017 was not higher than that of other traders, although index traders tended to hold high net positions (Table 1, Panel A) and to be focused on long positions (Table 2, Panel A). This is confirmed in the case of swap dealers (Table 3, Panel B), which held even lower percentages of total open interest than index traders. These data are consistent with the evidence found by Sanders and Irwin (2010) and Irwin (2013).
These data show that, in the period 2006-2017, commodity index traders and swap dealers hold globally high and mainly long net positions that, in term of open interest, were lower than those of commercial and non-commercial traders.
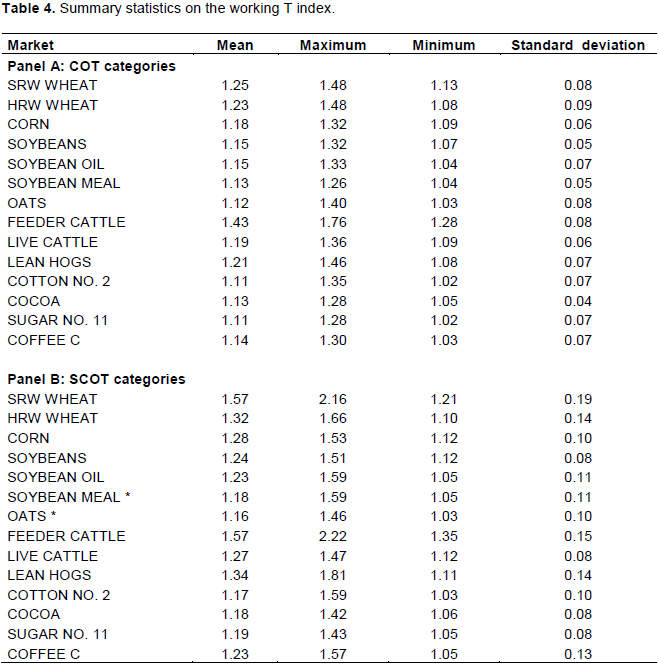
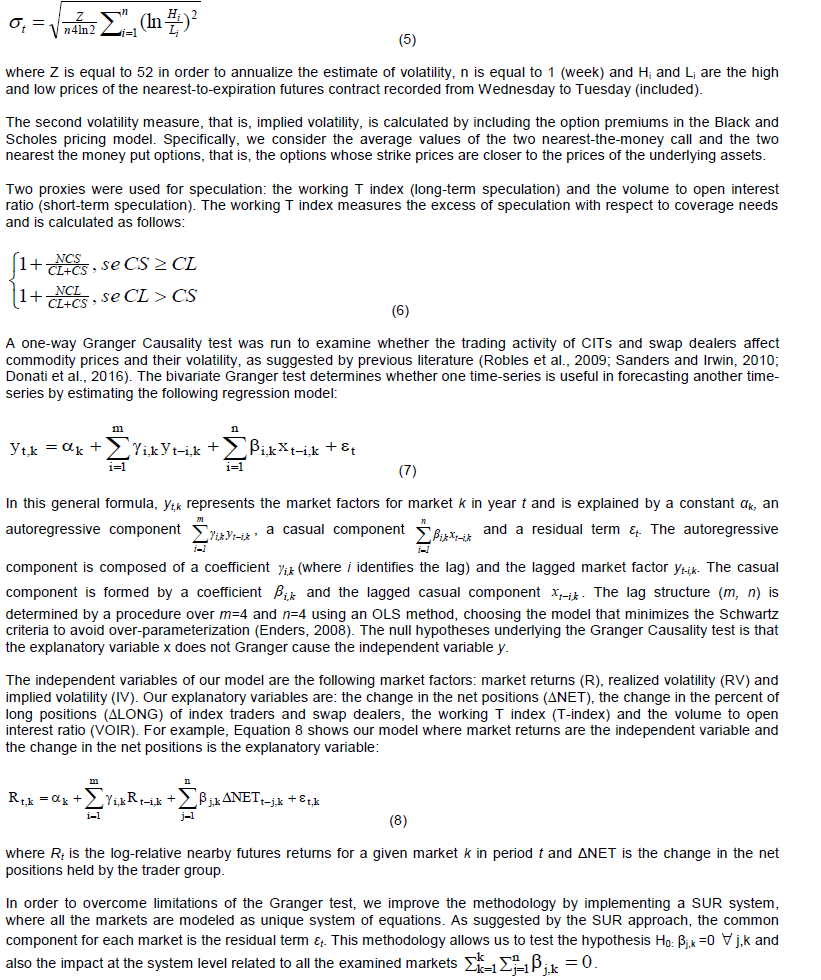
The working T index was also used to proxy long-term speculation. Data on this variable, which expresses in percentages the excess of speculation compared to coverage needs, are reported in Table 4, Panel A shows low values of the working T index, which means that speculation was barely sufficient to meet hedgers' coverage needs. The highest values are found in the markets for SRW wheat (1.25) and feeder cattle (1.43). These results are confirmed in Panel B, which shows data calculated using information extracted from the SCOT reports, and supports the evidence found by Sanders et al. (2010).
Table 4 shows summary statistics of the working T index for COT (Panel A) and SCOT categories (Panel B) from June 2006 to December 2017. Following Equation 6, in Panel B, the working T index is calculated by re-categorizing index traders into a non-commercial category. Results for the two markets, indicated with *, are obtained from DCOT data on the assumption that commercial and non-commercial traders of SCOT reports correspond, respectively to producers and merchants and to swap dealers + managed money + other reportable of DCOT reports. Non-reportable traders are considered 50% non-commercial (speculators) and 50% commercial (hedgers).
This paper aims to study the impact of CITs and swap dealers’ trading activity on agricultural commodities prices and volatility in the period 2006-2017. Data provided by the CFTC was first collected in order to estimate the explanatory variables to insert into Model 8. Granger Causality tests describe the results of which the robustness is verified in robustness check.
Granger Causality tests
In order to verify the existence of a possible Causality relationship between speculative traders’ activity and agricultural commodity prices and volatility, Granger Causality tests were conducted. Here, we consider three proxies of speculation, that is, percentage of long position, the working T index and VOIR, as explanatory variables, and market returns and realized volatility as independent variables. The robustness check tests the robustness of our results considering net positions as explanatory variable and implied volatility as independent variable.
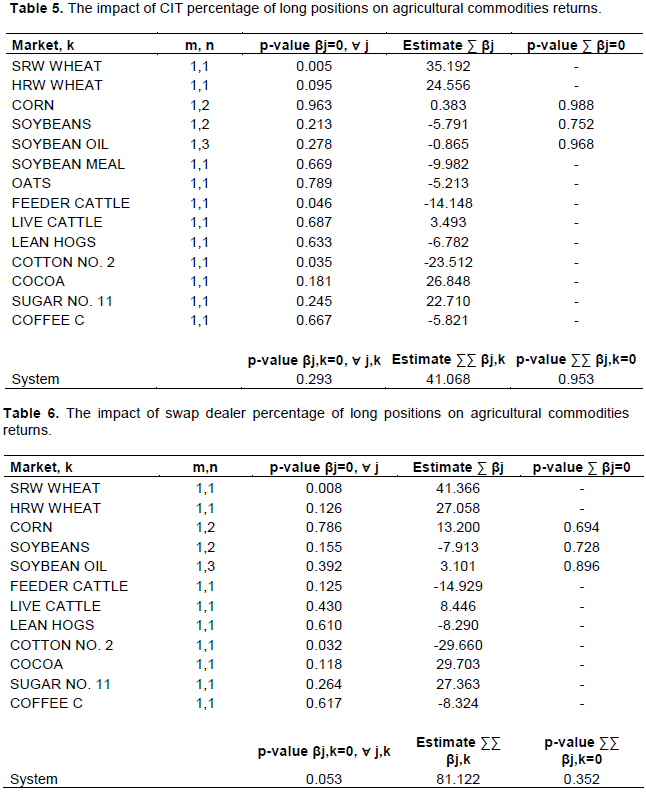
The first analysis tests whether the CIT percentage of long positions positively influenced agricultural commodities returns in the period 2006-2017. Results are shown in Table 5, where the (m, n) lag structure minimizing the Schwartz criteria is 1 for every market except for corn, soybeans and soybean oil. In the SUR system, parameters are pooled for the constant term (αK) and the estimated β2,K of the long position variable.
Table 5 shows the results of the Granger Causality test. The null hypothesis is that CITs percentage of long positions did not influence agricultural commodities returns from June 2006 to December 2017. Models are estimated across the K markets using a SUR system. In the model, the Wald tests do not reject the following cross-market coefficient restrictions: α1= α2=…αK; β2,1= β2,2=…β2,K. The common coefficients are estimated as a single pooled parameter across all K markets.
Results reported in Table 5 show that, market-by-market, for 11 of the 14 examined markets, the CIT percentage of long positions does not influence agricultural commodities returns at all, as p-values are higher than 5%. P-values lower than this threshold are found however in the case of SRW wheat, feeder cattle and cotton No. 2. However, only for the SRW wheat market the relationship is positive (the estimated coefficient is 35.192), and moreover, the SUR system shows a global p-value equal to 0.293. This means that, considering the 14 markets together, the CIT percentage of long positions did not lead to an increase in agricultural commodities returns in the period 2006-2017. These conclusions, based on weekly data, confirm previous findings by Sanders and Irwin (2010), Stoll and Whaley (2010), Aulerich et al. (2009), Irwin (2013), and Donati et al. (2016).
The second analysis tests whether the swap dealer percentage of long positions positively influenced agricultural commodities returns in the period 2006-2017. Results are shown in Table 6, where the (m, n) lag structure minimizing the Schwartz criteria is 1 for every market except for corn, soybeans and soybean oil. In the SUR system, parameters are pooled for the constant term (αK) and the estimated β2,K of the long position variable.
Table 6 shows the results of the Granger Causality test. The null hypothesis is that swap dealer percentage of long positions did not influence agricultural commodities returns from June 2006 to December 2017. Models are estimated across the K markets using a SUR system. In the model, the Wald tests do not reject the following cross-market coefficient restrictions: α1= α2=…αK; β2,1= β2,2=…β2,K. The common coefficients are estimated as a single pooled parameter across all K markets.
Results reported in Table 6 show that, market-by-market, for 10 of the 12 examined markets, the swap dealer percentage of long positions does not influence agricultural commodities returns at all, as p-values are higher than 5%. P-values lower than this threshold are however found in the case of SRW wheat and cotton No. 2. However, only for the SRW wheat market is the relationship positive (the estimated coefficient is 41.366), and moreover, the SUR system shows a global p-value equal to 0.053. This result suggests that, considering the 12 markets together, the swap dealer percentage of long positions did not lead to an increase in agricultural commodities returns in the period 2006-2017.
The impact of traders’ positions on agricultural commodities price volatility was also investigated. First, we conduct a Granger Causality analysis aiming to test whether the CIT percentage of long positions impacted agricultural commodities realized volatility in the period 2006-2017.
The results show that, market-by-market, for 9 of the 14 examined markets, the CIT percentage of long positions does not influence agricultural commodities realized volatility at all. P-values lower than 5% are found only in the case of SRW wheat, corn, soybeans, cotton No. 2 and sugar No. 11, for which all estimated coefficients are positive. This means that, in the case of these commodities, in the period 2006-2017 a rise in the percentage of long position held by CITs caused an increase in realized volatility. The results obtained in the market-by-market analysis are confirmed at the SUR system level, as the system shows a global p-value equal to 0.015. However, the directional impact (positive) is not statistically different from zero (p-value is equal to 0.820). This evidence is partially consistent with previous studies identifying a causal relationship between CIT positions and some commodity price volatility (Aulerich et al., 2009; Tang and Xiong, 2012; Algieri, 2016).
Second, we conduct a Granger Causality analysis aiming to test whether the swap dealer percentage of long positions influenced agricultural commodities realized volatility in the period 2006-2017.
The results show that, market-by-market, for 7 of the 12 examined markets, the swap dealer percentage of long positions does not influence at all agricultural commodities realized volatility, as p-values are higher than 5%. P-values lower than this threshold are however found in the case of SRW wheat, corn, soybeans, soybean oil and cotton no.2, and for all these, except for soybean oil, estimated coefficients are positive. This means that for these commodities a rise in the percentage of long position held by swap dealers caused an increase in realized volatility in the period 2006-2017. The results obtained in the market-by-market analysis are confirmed at the SUR system level, as the system shows a global p-value equal to 0.001. In this case, as in Table 6, the significance of the result is weakened by the fact that the cumulative impact (positive) is not statistically different from zero. These results are broadly in line with the findings of Borin and Di Nino (2012) who verify a positive relationship between swap dealer activity and volatility in a few markets using a different estimation methodology.
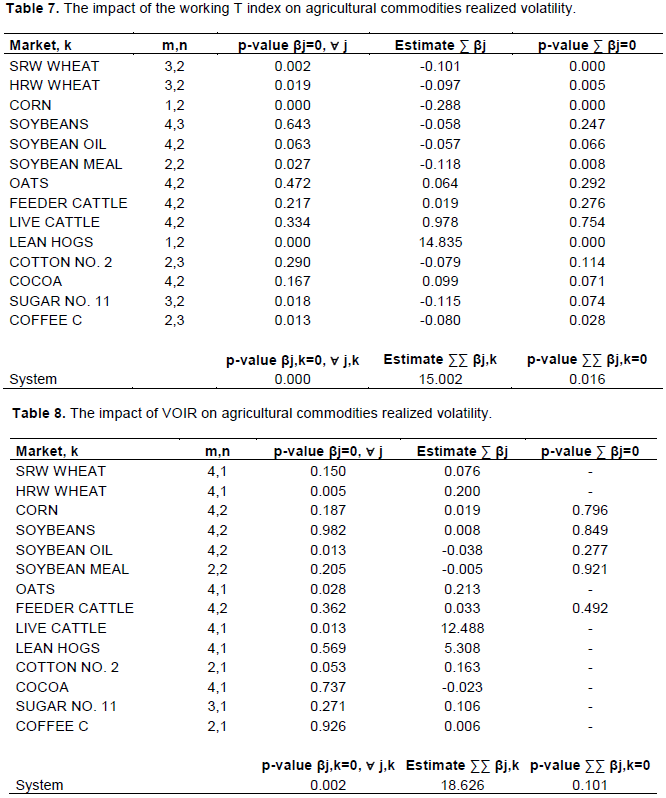
Third, we conduct a Granger Causality analysis to investigate the relationship between the working T index and agricultural commodities realized volatility in the period 2006-2017. Results are shown in Table 7.
Table 7 shows the results of the Granger Causality test. The null hypothesis is that the working T index did not influence agricultural commodities realized volatility from June 2006 to December 2017. Models are estimated across the K markets using a SUR system. In the model, the Wald tests do not reject the following cross-market coefficient restrictions: γ2,1= γ2,2=…γ2,K. The common coefficients are estimated as a single pooled parameter across all K markets.
Results reported in Table 7 show that, market-by-market, for 7 of the 14 examined markets, the working T index does not influence at all agricultural commodities realized volatility. P-values lower than the 5% threshold are found in the case of SRW wheat, HRW wheat, corn, soybean meal, lean hogs, sugar No. 11, and coffee C. All their coefficients are negative, except in the case of lean hogs. This means that, in the period 2006-2017, a rise in the long-term speculation contributed to reduce the realized volatility in the SRW wheat, HRW wheat, corn, soybean meal, lean hogs, sugar No. 11, and coffee C markets. In the same period however, an excess of long-term speculation in the lean hog market contributed to increasing the realized volatility. The results obtained in the market-by-market analysis are confirmed at the SUR system level, as the system shows a global p-value equal to 0.000, but with a positive and statistically significant cumulative impact. These results strengthen those on realized volatility, showing a positive relationship between CITs and swap dealers percentage of long positions and realized volatility, and are consistent with previous studies by Sanders and Irwin (2010), Du et al. (2011), and Algieri (2016).
Finally, we test whether short-term speculation influenced agricultural commodities realized volatility in the period 2006-2017. Short-term speculation is proxied by the ratio between volume and open interest (VOIR), as suggested by Peck (1981), Streeter and Tomek (1992), and Du et al. (2011). Results are shown in Table 8.
Table 8 shows the results of the Granger Causality test. The null hypothesis is that VOIR did not influence agricultural commodities realized volatility from June 2006 to December 2017. Models are estimated across the K markets using a SUR system. In the model, the Wald tests do not accept the following cross-market coefficient restrictions: γ2,1= γ2,2=…γ2,K ; γ3,1= γ3,2=…γ3,K. For this reason, it is not possible to impose any restrictions on the system and all parameters are estimated market-by-market.
Results reported in Table 8 show that, market-by-market, for 10 of the 14 examined markets, VOIR does not influence agricultural commodities realized volatility at all, as p-values are higher than 5%. P-values lower than this threshold are found only in the case of HRW wheat, soybean oil, oats and live cattle. All these coefficients are positive, except in the case of soybean oil. This means that, in the period 2006-2017, a rise in the short-term speculation contributed to increasing the realized volatility in the HRW wheat, oats and live cattle markets. In the same period, however, an excess of short-term speculation in the soybean oil market contributed to decreasing the realized volatility. The results obtained in the market-by-market analysis are confirmed at the SUR system level, as the system shows a global p-value equal to 0.002. These findings are consistent with previous studies by Streeter and Tomek (1992), Luu and Martens (2003), Robles et al. (2009), and Du et al. (2011).
Results on realized volatility are available on request.
Robustness checks
The robustness of our results was test. First, we focus on the impact of speculative traders’ positions on agricultural commodities returns using net positions instead of the percentage of long positions. Our analysis on CITs demonstrates that their net positions do not lead to an increase in returns, but rather to a decrease, thus confirming our previous findings. Specifically, our results show that, market-by-market, for 12 of the 14 examined markets, CIT net positions do not influence at all agricultural commodities returns. P-values lower than 5% are found only in the case of corn and feeder cattle. However, in both markets the relationship is negative (the estimated coefficients are -0.419 and -5.79, respectively) and moreover, the SUR system shows a global p-value equal to 0.008 with a negative cumulative directional impact. This suggests that, considering the 14 markets together, CIT net positions did not lead to an increase in agricultural commodities returns in the period 2006-2017, but rather to a reduction. The result is particularly significant because the cumulative directional impact is statistically different from zero (p-value equal to 0.047). These findings are partially consistent with those by Stoll and Whaley (2010) in the cotton market, Sanders and Irwin (2010) in the corn market and Etienne et al. (2017) in the corn market.
Our robustness analysis on swap dealers also shows that their net positions do not lead to an increase in returns but to a reduction, consistently with our results for CITs. The market-by-market analysis shows that for 11 of the 12 examined markets, swap dealer net positions do not influence agricultural commodities returns at all. The only p-value lower than the 5% threshold is found in the case of the lean hog market. However, in this market, the relationship is negative (the estimated coefficient is -22.900) and, moreover, the SUR system shows a global p-value equal to 0.019 with a negative cumulative directional impact. This means that, consistently with the results shown in Table 6, considering the 12 markets together, swap dealer net positions did not lead to an increase in agricultural commodities returns in the period 2006-2017, but at most to a reduction.
Second, we use net positions instead of percentage of long positions to test the robustness of our previous results related to the influence of speculative traders’ positions on agricultural commodities realized volatility (Tables 7 and 8). Our robustness analysis on CITs shows that their net positions did not drive realized volatility in the period 2006-2017. These findings are consistent with those of Aulerich et al. (2009), who find no Causality relationship between CIT net positions and volatility in the period 2004-2005, and poor evidence of Causality in the period 2006-2008.
Our robustness analysis on swap dealers also shows that their net positions did not impact realized volatility in the period 2006-2017. As in previous cases, all markets for which n=1 have in fact the same Causality test result (β1=0.854). Overall, there is therefore no evidence that the net positions held by swap dealers impacted agricultural commodities realized volatility in the period 2006-2017.
Third, we use implied volatility instead of realized volatility to test the robustness of our previous results. The analysis on CITs shows that their net positions do not drive implied volatility either market-by-market or at a SUR system level. Specifically, all markets have p-values higher than 5% and the SUR system has a global p-value equal to 0.789. These results confirm previous findings by Aulerich et al. (2009), who detect no Causality either market-by-market or at system level.
The robustness analysis on swap dealers also shows that their net positions do not drive implied volatility because market-by-market all p-values are higher than 5% and the global p-value of the SUR system is equal to 0.516. This means that net positions of the two categories of traders did not impact implied volatility in the period examined.
Percentage of long positions was also used instead of net positions to test the influence of speculative traders’ positions on agricultural commodities implied volatility. Our analysis on CITs shows that their percentage of long positions did not impact implied volatility either market-by-market or at a system level in the period 2006-2017. The global p-value is in fact equal to 0.230. As regards swap dealers, our analysis demonstrates that a high percentage of long positions leads to a reduction in implied volatility. Our results show that, market-by-market, for 10 of the 11 examined markets, the swap dealer percentage of long positions does not influence agricultural commodities implied volatility at all, as p-values are higher than 5%. P-values lower than this threshold are found only in the case of soybean oil market. However, in this case, the relationship is negative (the estimated coefficient is -0.476) and, moreover, the SUR system shows a global p-value equal to 0.039 with a negative cumulative directional impact (not statistically different from zero). This means that, considering the 11 markets together, the swap dealer percentage of long positions did lead to a reduction in soybean oil implied volatility in the period 2006-2017, but the direction of the impact across markets is simply not consistent with a systematic effect. This evidence confirms previous findings by Sanders and Irwin (2010), who detect a negative relationship in four of fourteen analyzed markets and also at a SUR system level.
Moreover, we test the robustness of our previous results concerning the influence of the two speculation proxies on agricultural commodities implied volatility. Our analysis shows that the working T index does not drive implied volatility. The result is that all markets for which n=1 have the same Causality test result, where β1=0.222. Overall, there is no evidence that the T index impacted agricultural commodities implied volatility in the period 2006-2017, as suggested by Sanders and Irwin (2010).
Furthermore, the analysis on VOIR shows our short-term speculation measure does not drive implied volatility either. The results demonstrate in fact that, market-by-market, for 12 of the 13 examined markets, VOIR does not influence agricultural commodities implied volatility at all. The only p-value lower than 5% is found for the cocoa market. The estimated coefficient of this market is negative and indicates that, in the period 2006-2017, a rise in short-term speculation contributed to reducing implied volatility. Despite these market-by-market results, the SUR system shows a global p-value equal to 0.036, but the positive cumulative directional impact is not statistically different from zero. This means that, considering the 13 markets together, VOIR leads to a decrease of the cocoa market, and the direction of the impact across markets is not consistent with a systematic effect, so our previous results are confirmed.
Finally, we conclude that neither CITs nor swap dealers can be considered responsible for the increase in agricultural commodities prices in the period 2006-2017. As regards price volatility, however, our results appear to depend on the measure of volatility used. Long-term speculation appears to have led to an increase in realized volatility, but not in implied volatility. Short-term speculation, on the other hand, appears to have caused mixed effects in both types of volatility, but results are not clear at system level.
Results in robustness check are available on request.
This study investigates the role of speculative activity in the agricultural commodity futures market in the period 2006-2017. It tests the causal relationship between the prices of fourteen agricultural commodities and the trading activity of commodity index traders and swap dealers. The analysis tests the relationships, at a weekly frequency, by means of bivariate Granger Causality tests and using an SUR system approach, which improves the power of statistical tests. We proxy trading activity through net long position and percentage of long position held by CITs and swap dealers, and speculation through the working T index (long-term speculation measure) and VOIR (short term speculation measure). We measure price volatility by means of realized volatility and implied volatility.
Our results do not show any Causality between CIT and swap dealer trading activity and weekly returns, thus confirming previous findings by Sanders and Irwin (2010). Unlike that study, however, we identify a positive relationship between the percentage of traders holding long positions and realized volatility. This is also confirmed by the long-term speculation proxy and, in some markets, also by the short-term one.
Overall, our study suggests that CITs and swap dealers cannot be accused of having generated a bubble in the agricultural commodity market, but they may have increased price volatility. Criticism of Masters’ theory in current literature therefore appears to be grounded. However, speculation does appear to impact on price volatility, and because agricultural commodities are used for essential purposes of food, feed and fuel, increasing volatility has negative effects at global level. We do not disprove previous evidence that speculation is necessary to meet the needs of hedgers for coverage, but it is the case that if it were to become the main activity of the market, the futures markets would fall into disuse.
On the other hand, however, it would also be risky to impose stricter limits on speculation, because there is no convincing evidence that speculators have "driven" prices to take advantage of them. On the basis of previous literature and our results, restrictive measures would be not only unjustified, but also potentially harmful. If speculation were too stringently discouraged, hedgers would no longer find counterparties to "cover" their positions and would be forced to search for alternative instruments, such as insurance products, instead of those offered by the futures market. Insurance companies, however, apply very high premiums to protect farmers, as the climate risk is both incisive and unpredictable. In the end, these higher costs would inevitably be borne by final consumers and no positive effect would be had on prices or volatility. These conclusions do not suggest that the futures market has worked well in recent years, or that it should be left unregulated, but only that before adopting restrictions on speculation, further research is needed on the role of speculation in agricultural commodity markets. Any attempt by lawmakers to limit speculation should be carefully evaluated in order to avoid depriving the market of a precious source of liquidity and producers of an irreplaceable hedging instrument.
The authors have not declared any conflict of interests.
REFERENCES
|
Algieri B (2016). Conditional price volatility, speculation, and excessive speculation in commodity markets: sheep or shepherd behavior? International Review of Applied Economics 30(2):210-237.
Crossref
|
|
|
|
Aulerich NM, Irwin SH, Garcia P (2009). The price impact of index funds in commodity futures markets: evidence from the CFTC's daily large trader reporting system (No. 1960-2019-1523).
|
|
|
|
|
Borin A, Di Nino V (2012). The role of financial investments in agricultural commodity derivatives markets. Bank of Italy Temi di Discussione (Working Paper) No, 849.
Crossref
|
|
|
|
|
Brunetti C, Buyuksahin B (2009). Is speculation destabilizing?. Working paper 29 Commodity Futures Trading Commission. Available at:
View
Crossref
|
|
|
|
|
Buyuksahin B, Harris JH (2011). Do speculators drive crude oil futures prices? The Energy Journal 32(2):167-202.
Crossref
|
|
|
|
|
Capelle-Blancard G, Coulibaly D (2011). Index trading and agricultural commodity prices: A panel Granger causality analysis. International Economics 126:51-71.
Crossref
|
|
|
|
|
Childs N, Kiawu J (2009). Factors behind the rise in global rice prices in 2008. U.S. Department of Agriculture, Economic Research Service, RCS-09D-01. Available at:
View
|
|
|
|
|
Donati M, Zuppiroli M, Riani M, Verga G (2016). The impact of investors in agricultural commodity derivative markets. Outlook on Agriculture 45(1):25-31.
Crossref
|
|
|
|
|
Du X, Yu CL, Hayes DJ (2011). Speculation and volatility spillover in the crude oil and agricultural commodity markets: a Bayesian analysis. Energy Economics 33(3):497-503.
Crossref
|
|
|
|
|
Einloth J (2009). Speculation and recent volatility in the price of oil. Working Paper, Division of Insurance and Research, Federal Deposit Insurance Corporation. Available at:
View
|
|
|
|
|
Enders W (2008). Applied econometric time series. John Wiley & Sons.
|
|
|
|
|
Etienne XL, Irwin SH, Garcia P (2017). New evidence that index traders did not drive bubbles in grain futures markets. Journal of Agricultural and Resource Economics 42(1):45-67.
|
|
|
|
|
Food and Agriculture Organization (FAO) (2009). The 2007-2008 food price swing impact and policies in Eastern and Southern Africa. FAO commodities and trade technical paper, 12, Rome. Available at:
View
|
|
|
|
|
Food and Agriculture Organization (FAO) (2017). The future of food and agriculture. Trends and challenges. Rome. Available at:
View
|
|
|
|
|
Garcia P, Irwin SH, Smith, A. (2015). Futures market failure?. American Journal of Agricultural Economics 97(1):40-64.
Crossref
|
|
|
|
|
Gheit F (2008). Testimony before the subcommittee on oversight and investigations of the Committee on Energy and Commerce, U.S. House of Representatives.
|
|
|
|
|
Gilbert CL (2010). Speculative influences on commodity futures prices 2006-2008. Geneva, Switzerland: United Nations Conference on Trade and Development.
|
|
|
|
|
Gilbert CL, Pfuderer S (2014). The role of index trading in price formation in the grains and oilseeds markets. Journal of Agricultural Economics 65(2):303-322.
Crossref
|
|
|
|
|
Hamilton JD (2009). Causes and Consequences of the Oil Shock of 2007-08 (No. w15002). National Bureau of Economic Research.
Crossref
|
|
|
|
|
Hamilton J, Wu C (2012). Effects of index-fund investing on commodity futures prices, University of California, San Diego. Unpublished working paper.
Crossref
|
|
|
|
|
Headey D, Fan S (2008). Anatomy of a crisis: the causes and consequences of surging food prices. Agricultural Economics 39(1):375-391.
Crossref
|
|
|
|
|
Irwin SH, Sanders DR, Merrin RP (2009). Devil or angel? The role of speculation in the recent commodity price boom (and bust). Journal of Agricultural and Applied Economics 41(2):393-402.
Crossref
|
|
|
|
|
Irwin SH, Garcia P, Good DL, Kunda EL (2011). Spreads and non-convergence in Chicago board of trade corn, soybean, and wheat futures: are index funds to blame? Applied Economic Perspectives and Policy 33(1):116-142.
Crossref
|
|
|
|
|
Irwin SH (2013). Commodity index investment and food prices: does the "Masters Hypothesis" explain recent price spikes? Agricultural Economics 44(1):29-41.
Crossref
|
|
|
|
|
Luu JC, Martens M (2003). Testing the mixtureâ€ofâ€distributions hypothesis using "realized" volatility. The Journal of Futures Markets 23(7):661-679.
Crossref
|
|
|
|
|
Masters MW (2008). Testimony before the Committee on Homeland Security and Governmental Affairs, Washington DC, 2008. Available at:
View
|
|
|
|
|
Masters MW, White AK (2008). The accidental hunt brothers: how institutional investors are driving up food and energy prices. Available at:
View
|
|
|
|
|
Parkinson M (1980). The extreme value method for estimating the variance of the rate of return. Journal of Business 53(1):61-65.
Crossref
|
|
|
|
|
Peck AE (1981). The adequacy of speculation on the wheat, corn, and soybean futures markets. In Research in Domestic and International Agribusiness Management Goldberg RA, Greenwich CN (ed.), JAI Press pp. 17-29.
|
|
|
|
|
Petzel T (2009). Testimony before the CFTC. Available at:
View
|
|
|
|
|
Robles M, Torero M, Von Braun J (2009). When Speculation Matters (Issue Brief 57). Washington, DC: International Food Policy Research Institute.
|
|
|
|
|
Rouwenhorst KG, Tang K (2012). Commodity investing. Annual Review of Financial Economics 4:447-467.
Crossref
|
|
|
|
|
Sanders DR, Irwin SH (2010). A speculative bubble in commodity futures prices? Cross-sectional evidence. Agricultural Economics 41(1):25-32.
Crossref
|
|
|
|
|
Sanders DR, Irwin SH, Merrin RP (2010). The adequacy of speculation in agricultural futures markets: too much of a good thing? Applied Economics Perspectives and Policy 32(1):77-94.
Crossref
|
|
|
|
|
Sanders DR, Irwin SH (2013). Measuring index investment in commodity futures markets. Energy Journal 34(3):105-127.
Crossref
|
|
|
|
|
Sanders DR, Irwin SH (2016). Bubbles, froth and facts: another look at the Masters hypothesis in commodity futures markets. Journal of Agricultural Economics 68(2):345-365.
Crossref
|
|
|
|
|
Stoll HR, Whaley RE (2010). Commodity index investing and commodity futures prices. Journal of Applied Finance 20(1):7-46.
Crossref
|
|
|
|
|
Streeter DH, Tomek WG (1992). Variability in soybean futures prices: an integrated framework. Journal of Futures Markets 12(6):705-728.
Crossref
|
|
|
|
|
Tang K, Xiong W (2012). Index investment and the financialization of commodities. Financial Analysts Journal 68(6):54-74.
Crossref
|
|
|
|
|
Till H (2009). Has there been excessive speculation in the US oil futures markets? What can we (carefully) conclude from new CFTC data? EDHEC Position Paper November, EDHEC Risk Institute.
Crossref
|
|
|
|
|
United States Senate, Permanent Subcommittee on Investigations (2009). Excessive speculation in the wheat market. U.S. Government Printing Office: Washington, D.C.. Available at:
View
|
|
|
|
|
Van Huellen S (2019). Price discovery in commodity futures and cash markets with heterogeneous agents. Journal of International Money and Finance 95:1-13.
Crossref
|
|
|
|
|
Wahl P (2009). Food speculation the main factor of the price bubble in 2008. World Economy, Ecology and Development. Available at:
View
|
|
|
|
|
World Bank (2008). G8 Hokkaido-Toyako Summit. Double Jeopardy: responding to high food and fuel prices. Available at:
View
|
|