Odyssey literally means a long and eventful or adventurous journey; this study therefore reflects the significance of South African multinational companies (MNCs) sojourn in the Southern African Development Community (SADC). Numerous South African MNCs have ventured into global markets after the successful ending of apartheid and the institution of a majority government in South Africa. Although this expedition outwards by South African MNCs into the SADC has been widely acclaimed in several articles, little research presents an aggregate view of this development. This article attempts to fill the literature and empirical gap. As well as, investigate if there is an Odyssean ‘Penelope’ impact.
The economic capacity of a country, particularly its industrial in frastructure, banking and agricultural capabilities, determines the trend that its exports follow (Ahmed et al., 2004; AGRA, 2013; UN-OHRLLS, 2013; World Investment Report, 2014). It has been observed that the increasing levels of political, religious, xenophobic and economic crises in the SADC have resulted in wars (including currency wars), which in the long run have negatively impacted on the aggregate levels of productivity and infrastructure (Fontyn, 2013; Freeth, 2015; Mubangizi, 2015; Xie, 2015). Most researchers (Lawson, 2010; SADC, 2012; Tekere, 2012; Moyo, Sill and O'Keefe, 2013) have continually viewed economic growth experienced in the region as jobless growth. These in essence have continued unabated despite government support for economic equality, which is expected to lead to a reduction in the level of poverty.
Rising trade and current account deficits in predominantly all SADC countries have further weakened the ability of member states to tackle these problems, especially with an increasing debt burden (SADC, 2015) passed on by poorly managed state owned enterprises (SOE). As a direct consequence, most SADC countries have not been able to build or repair deteriorated and/or destroyed infrastructure. The resultant effect of this trend is that the SADC economy is increasingly dependent on South African MNCs to provide cheap and affordable goods and services (Mthombeni, 2006; Gorp, 2008). This study measures the strategic impact of South African originated MNCs on the level of regional economic development and investment within the SADC region.
The article probes the relevance of the six gaps hypothesis that form the basis for the perviousness of underdevelopment, which keeps these countries (especially most of the countries in the SADC region, save for South Africa and Botswana) trapped perpetually in low-growth incarceration (Gerring and Thacker, 2008; Yusuf, 2009; Dunning, 2010). Although, quite a number of studies have been conducted to investigate the strategic importance of regional economic integration on the expansion strategies of multinational corporations (Mthombeni, 2006; Pradhan, 2010; Hunya, 2012; Acquaah et al., 2013), there are few documented studies on the SADC region in specific. Furthermore, while a number some of these studies (Mthombeni, 2006; Balaam and Veseth, 2008; Chanmongkolpanich and Panthong, 2009; Tambunlertchai, 2009; Banner and Papathanakos, 2014; Zhou et al., 2016) have also been centred on the benefits of foreign investment to the host nation, specific studies that investigates the impact of South Africa- originated MNCs on the host nations economic development have not been documented. This research intends to fill those voids.
The impact of South African MNCs in the SADC
Contemporary research (Msuya, 2007; Draper and Freytag, 2008; Gerring and Thacker, 2008; Erasmus and Breier, 2009; Yusuf, 2009; Aswathappa, 2010; Blanchard and Miller, 2010; Dunning, 2010; Sen, 2011; Okeyika, 2012; Pawar, 2013) points out that an exhaustion of the “six gaps" problem (that is, savings, trade, budgetary, revenue, skills, and innovation gap), will eventually lead to proffering a common solution for the SADC to break out of the vicious circle of poverty, and the trap of a low growth scenario. Also, numerous studies, such as those conducted by Chingono and Nakana (2009) and Dunning (2010) have espoused that countries could emancipate from the “six gaps” through the spillover effects of MNCs activities in the host country. To test the validity of this hypothesis, the study begins reviewing available literature on the application of this (emancipation) theory within the SADC regional bloc.
The first important contribution of South African MNCs according to Msuya (2007) is their role in filling the resource gap between targeted or desired investment and domestically mobilised savings. For example, to achieve a 7% growth rate of national output if the required rate of saving is 21% but if the savings that can be domestically mobilised is only 16% then there is a “saving gap” of 5%. If the country can fill this gap with foreign direct investments from these MNCs, it will be in a better position to achieve its target rate of economic growth.The second contribution relates to filling the foreign exchange or trade gap. An inflow of foreign capital can reduce or even remove the deficit in the balance of payments, if the MNCs can generate a net positive flow of export earnings (Blanchard and Miller, 2010; Lalnunmawia, 2010; Sen, 2011; Okeyika, 2012; Pawar, 2013).
It therefore means that while MNCs exports increase, the level of nominal imports decreases, thus allowing for a favourable balance of payment. According to the Organisation for Economic Co-operation and Development (OECD, 2013) a contributing factor to the financial crises of 2007 to 2010 was the record imbalance in elements of the Balance of Payments BoP, such as the current account, financial account, and capital account plus or minus the balancing items. Many studies reveal that a fundamental problem common within the SADC region is that despite improvements in commodity prices, the current account balances of most SADC member states remain wide. The region’s current account deficit in 2009 was 10.5 per cent and has further widened to 12.3% in 2010, from a conservative 2% deficit in 2006. This according to recent research by the SADC (2012) and the International Monetary Fund (IMF) World Economic Outlook – WEO (2012) was largely due to rising imports supported by a weak domestic economy in these countries.
International business literatures reveal that, often, primary raw materials are bought from SADC countries at low prices, then converted into finished products, and a significant amount of value is added, then exported back to these countries by foreign MNCs at higher prices. Consequently, intra-regional flows within the SADC account for about 20% cent of total trade. This according to the UNCTAD (2011) will however increase largely due to the growing presence of South African MNCs in these countries, and the success of these firms in telecommunications, retail, breweries, banking, and specialised service sector. Likewise, the third important role South African MNCs play in the SADC is filling the gap between targeted governmental tax revenues and locally raised taxes. By taxing these MNC profits, member state governments are able to mobilise public financial resources for development projects (Lalnunmawia, 2010; Okeyika, 2012; Pawar, 2013).
Similarly, the fourth major contribution of South African MNC’s is that apart from the fact that these MNCs provide financial resources to further production, they also supply a “package” of needed resources that includes management experience, entrepreneurial abilities, and technological skills. According to Erasmus and Breier (2009) the SADC's skills shortages are widely regarded as a key factor preventing the achievement of targeted growth rates. The findings of so many studies reveal that these resources can be transferred to local firms by means of training programmes and the process of “learning by doing” that only occurs through practice. However, apart from skills shortage, another factor of great value that needs attention in SADC countries is innovation which Schumpeter (2013) describes as the creative gale of destruction.
According to Anthony (2013) innovation is simply the key to long-term economic growth. Therefore, for today’s MNCs to be successful, they have to invent product offerings that exceed current expectations of consumers. Recent research findings (Moore et al., 2013; KEN, 2013) reveals that due to the significance of innovation, there is a dire need for innovation and technology agencies to renew their mandate in order to focus on innovation replication in commercially viable areas (World Investment Report, 2014; World Bank, 2016; Zhou et al., 2016), as well as to promote social entrepreneurship models because the address most of the development challenges facing the region. According to Vernon (1979), product innovation gives the innovative firm a monopolistic advantage, which it first exploits at home and then abroad. More so, Chan and Pretorius (2007) posit that countries and regions have tended to stimulate innovation as a fundamental source of competitiveness by building on locally generated intellectual property.
The SADC must not be left out of this unfolding global trend, as South African MNCs’ are well positioned to give them that advantage. Evidence from the findings of Aswathappa (2010) suggests that South African MNCs bring with them the most sophisticated technological knowledge about production processes within the SADC. Moreover, these firms transfer modern machinery and equipment to capital poor LDCs. Such transfers of knowledge, skills, and technology are assumed to be both desirable and productive for the recipient country to kick-start economic development (World Investment Report, 2012; Heritage Foundation, 2016; Zhou et al., 2016). For instance, Sasol’s proprietary Fischer-Tropsch (FT) technology was responsible for advances in the production of cleaner liquid fuels within the SADC (Sasol, 2013).
Also, it has been observed that AngloGold Ashanti’s deep mining technologies and safety standards with its low economic costs were responsible for an increase in company profits within the region (AngloGold Ashanti, 2010). Likewise, MTN’s fibre-optic backbone network helped the company to meet an increasing demand for bandwidth from its customers, skyrocketing profits that have consistently assisted the company to spread its operations all over the SADC region (SA Info, 2007). Despite all the favourable arguments for MNCs, scholars such as Rao (2008), Majeed and Ahmad (2009), Dosanjh (2010), Giuliani (2010) and Teixeira and Grande (2012) have observed potential negative impacts of MNCs in host countries.
Although the initial short-run impact of MNC investment is to improve the foreign exchange position of the recipient nation, its long-run impact may reduce foreign exchange earnings on both current and capital accounts (Wei, 2009). Existing literature suggests that the current account of host nations may deteriorate as a result of substantial importation of intermediate and capital goods, while the capital account of the country may worsen because of the repatriation of profits, interest and royalties overseas (Singh, 2012). An adept analysis of the behavioural pattern of South African MNCs reveals that these MNCs have been very instrumental in the development of host countries’ economies, with minimal observable negative effects.
South Africa-originated MNCS and the SADC economy
Many literature studies have concluded that South Africa is the economic giant of Africa, contributing nearly 40% to the continent's total GDP (Vilakazi, 2009). In the manufacturing sector, 75% of Africa-originated MNCs are from South Africa. Although South Africa accounts for only 6% of Africa's population, it acclaims about 40% of Africa's industrial output, over 45% of Africa's mineral production, 50% of Africa's purchasing power and over 50% of Africa's energy consumption (World Investment Report, 2010). Studies conducted by Martin (2008) and the World Bank (2012), has also suggested that by contrast to the rest of the continent, South Africa possesses comparatively higher industrial, commercial, infrastructural and financial power.
Ngwawi (2012) posits that since the SADC embarked on a number of short- and long-term projects to bolster its power generation capacity by more than 42,000 megawatts, many MNCs have started taking this sector serious. This has triggered new research into cheap ways to generate and transmit power. For instance, Sasol’s use of R 1.8 billion to generate 140 MW of electricity in its new gas-fired plant is about a third of estimated cost of nuclear power construction and half the cost of a coal-fired plant (Sasol, 2013). This have signaled to the stakeholders that low power generation costs ultimately revolutionises the power sector’s efficiency levels and will significantly improve productivity levels in the SADC (Ngwawi, 2006; TMSA, 2011; TMSA, 2012).
More so, many literature and empirical studies have indicated that South Africa-originated MNCs have contributed meaningfully to the transport sector of the SADC. According to Sapa (2012) Transnet’s indication that it will need 1064 locomotives in the next seven years – or 152 locomotives a year – as part of its R 300 billion market demand strategy, is expected to significantly improve the ailing transport sector in both South Africa and the SADC. This will definitely help to further integrate the SADC market by reducing transport time, distance and cost of travel for both goods and services, and lower the cost of human capital as well. Also, the actualisation of this goal is expected to lead to the development of ancillary industries such as the hotel and tourism sectors of the economy, generate new jobs, and also, lead to sustainable growth and development in the region.
Furthermore, data provided by Statistics South Africa (2012) reveal that the investment of South African companies operating in the SADC is yielding substantial benefits for Africa. This achievements have been predominantly in the areas of job creation; upgrading of existing and building of new infrastructure, including but not limited to investment in backbone services, and technology transfer through human resource development (National Planning Commission, 2011), increased tax revenues; increased consumer choice; and boosting general investor confidence in host countries (Draper et al., 2011; Landsberg and Wyk, 2012). Consequently, South African companies have directly contributed to the slow build-up of crucial productive infrastructure in the region (Draper et al., 2011).
The Famine Early Warning Systems Network - FEWSNET (2012) notes that despite the high levels of acute food insecurity in Africa, the SADC remains generally food secure. Recent empirical evidence from Statistics South Africa (2012) database shows that the vertically backward integration strategies of fast-moving consumer goods companies in South Africa such as Shoprite, Massmart, Spar and Game has sufficiently helped to build and acquire farms that meet the food deficit levels in cereals, legumes and other cash crops, largely due to the commercialised and mechanised kind of agriculture that is being practiced (FAO, 2008; Mudhara, 2010; Neves, 2014). Given the large number of portfolio inflows into South Africa from the rest of the world, recent studies by the Johannesburg Stock Exchange - JSE (2013) suggests that these inflows are recycled as FDI outflow to the region; in other words, South Africa’s sophisticated financial markets are being used to channel resources across the SADC, thereby aiding regional trade.
According to Whitfield et al. (2013, 2015) South African companies conceptualised the largest-ever foreign direct investment in Mozambique; that was used to build MOZAL aluminium smelter in Maputo. This investment has aided the on-going economic reconstruction in Mozambique. According to industry watcher’s (Jordaan and Kanda, 2011), the milestone achievement was that the capitalisation of the MOZAL project, estimated at US $1.3 billion, was about half of the estimated Mozambican GDP of US $2.8 billion in 1998 (Gqada, 2013). Consequently, this move has further increased the trust and support for South African MNCs by SADC countries that want complete integration by 2018 (Warren-Rodríguez, 2008; Stephan and Hervey, 2008; Gqada, 2013). Apart from the Mozal investment, South African MNCs have also entered the Mauritius market to explore potentials inherent in the nation’s economic sector.
New research carried out by the SADC (2012) concludes that in 2006, there was a huge increase in South Africa's outward FDI to Mauritius, accounting in that year for 33% of total FDI. Although this FDI was concentrated in the IT and Business Process Outsourcing (IT/BPO) services sector (Overseas Development Institute, 2011), there is a drive towards investment in the private non-banking sector that specifically deals in long-term capital (World Investment Report, 2012). On an aggregate level, South African MNCs have made significant investments in the banking, retailing, tourism and mining sectors of the SADC’s economy. For instance, Standard Bank and SABMiller have investments in all 14 SADC countries. Also, some of the new investments in Information and Communications Technology (ICT), particularly in the Global System for Mobile telecommunication (GSM) sector have been dominated by South African MNCs, with investments made by MTN Group of Companies, Telkom SA and Vodacom running into billions of dollars, followed by the Industrial Development Corporation (IDC’s) $600 million in Mozambique and Gencor’s $500 million in Mozambique (Carmody, 2012; Valsamakis, 2012).
It has been observed that South African retail companies such as Wimpy (fast food), Engen (service station), Kwikserve (mini-supermarket), Woolworths (food and clothing), Game (general merchandise) and the huge regional multinational food retailer, Shoprite-Checkers(food supermarket), are building on regional economies of scale to penetrate regional markets with a host of new consumer goods and services sourced primarily from South Africa (Miller, 2008; Miller, Saunders and Oloyede, 2008; SARB, 2012). According to Louw et al. (2008) agro-allied companies contribute 67% of the SADC’s GDP and 62% of the total value of SADC countries’ external trade. The perennial success of this sector have also made the country an “anchor economy” for both South African agribusinesses and international subsidiaries of foreign MNCs based in South Africa venturing into the SADC region. New studies by Miller (2008) and the South African Reserve Bank - SARB (2012) posit that retail migration into SADC region has benefited from the “pull” supporting services sectors such as property rental, banking and auditing. It has been further observed that local linkages to the supply chain are highly attractive and currently unexploited in the region, and as such portend a great incentive to invest in this sector. Studies conducted by World Investment Report (2012) reinforces earlier evidence by showing that South African MNCs have performed well in the fast food, retail and wholesale sectors of the region’s economy. Steers, Shoprite Checkers, Pick ’n Pay, Pep and Pepkor/Metro have also carried out an aggressive expansion strategy that has led to these MNCs opening branches in almost all countries within the SADC. Moreover, SABMiller (Africa’s number one brewing and bottling company) has considerably grown its business within the SADC. As a result, the company now sells about 213 million hectolitres (hl) per annum (SABMiller, 2012). In the finance sector banks such as Standard Bank, First National Bank and Nedbank have grown their balance sheet through their expansion programmes within the SADC. However, there is an expansion gap within the insurance, investment banking and asset management sub sector, which South African MNCs will soon fill. Furthermore, in the mining sector, De Beers, BHP Billiton and AngloGold Ashanti remain the dominant players within the sub-region (SABPP, 2012).
Likewise, recent studies conducted by the SARB (2012) suggest that South African banks play an important role in regional integration. This has been clearly stated in the vision, mission and strategic statement of these companies. A study carried out by the JSE (2013) observes that there is a positive link between South African multinational banks’ acquisitions in the SADC and the exchange’s growth. This has given rise to higher revenues and profit ratios by banks such as ABSA, Nedbank, Standard Bank, Investec and First National Bank despite high-level losses that are being experienced by foreign competitors. Consequently, South African banks coverage in the SADC; is now providing an avenue to finance big-ticket transactions in the region. Further analysis of the activities of South African MNCs shows that they have performed creditably well and empirical evidence have also revealed that these firms have positively contributed to the growth of the SADC zone.
After a comprehensive literature review and discussion concerning related concepts and findings of the previous studies, the study developed an integrated conceptual framework (Figure 1) for the purpose of this study. The effervescence effect of this model is that shows the relationships that exist between the construct variables. However, to formulate appropriate measures and otherwise manage the relationship, information regarding South African MNCs activities, as well as the impact of factors such as the rate of economic freedom in the SADC, the level of infrastructure development, the level of foreign direct investment (FDI) net inflows, and the employment to population ratio, in order to gain knowledge of their impact on the GDP of the SADC.
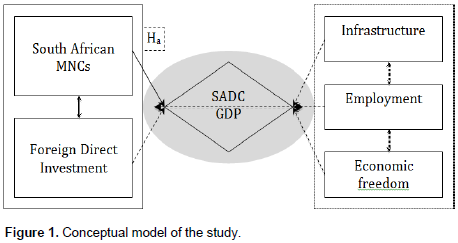
Consistent with theorists (Mthombeni, 2006; Balaam and Veseth, 2008; Chanmongkolpanich and Panthong, 2009; Tambunlertchai, 2009; Banner and Papathanakos, 2014) who emphasised the importance of South African MNCs operations in the SADC, by stating categorically that these firms have transcended from being explorativeto exploitative in this region, having utilised their location bound firm specific advantages (FSA), and overcoming the liability of foreignness (LOF) challenges, as well as recognising the disruptive effect of psychic distance, while taking advantage of the incentives that is provided by the SADC (Leonidou et al., 2014), the study suggest that South African MNCs contribute to regional economic growth and investment in the SADC.
Based on the model conceptualisation for the study, the study examine the effects of South African MNCs contribution to regional economic growth and investment in the SADC based on the relationship that exist between five variables that are important to achieving the objective of this study. Based on the literature review the following hypothesis has been formulated to examine the relationships:
Ho: South African Multinational companies do not contribute to regional economic growth and investment in the SADC.
Ha: South African Multinational companies contribute to regional economic growth and investment in the SADC.
Variable identification and deconstruction
GDPSADCt is the GDP of the SADC in year t. It is calculated based on the market value of goods and services produced within the SADC region from 1980 to 2011. The GDP data can be accessed from Statistics South Africa's and other relevant database. This econometrics variable was selected after careful consideration by the authors of this study, since it is consistent with the methodology of similar studies (Statistics South Africa, 2013; UNCTAD, 2013; World Investment Report, 2014). MNCSAvt measures the value of South African MNCs’ contribution to regional economic growth and investment in year t. The cumulative value of MNCs in South Africa was measured by the Market capitalisation of the Johannesburg Stock Exchange from 1980 to 2011 (Ritholtz, 2011). The dataset was assessed from the Johannesburg Stock Exchange (JSE, 2013).
INFRASSADCt is the level of Infrastructure development in year t. It can be defined as the basic physical systems of a business or nation. It includes investments in transportation, communication, sewage, water and electric systems. Although these systems tend to be high-cost investments, they are vital to a country's economic development and prosperity. Infrastructure projects may be funded publicly, privately or through public-private partnerships. The data for the level of infrastructure development of the SADC can be assessed from the World Bank, World Development Indicators (WDI) using aggregate datasets from 1980 to 2011 (World Bank, 2012a).
ECFREEDOMSADCt is the rate of Economic freedom in the SADC in year t. It is concerned with the level that the cornerstones of economic freedom such as personal choice, voluntary exchange, freedom to compete, and the security of privately owned property. It measures the size of government; expenditures, taxes, and enterprises, legal structure and security of property rights, access to sound money, freedom from corruption, financial and investment freedom, freedom to trade internationally, regulation of credit, labour, and business. Variables of the rate of economic freedom were collected from a number of different sources such as the World Bank, the International Monetary Fund and the Economist Intelligence Unit. The aggregate dataset for this proxy variable was assessed from the Fraser Institute portal, using data from 1980 to 2011 (Fraser Institute, 2014).
EMPtoPOPrSADCt is the Employment to Population ratio in year t. The employment to population ratio for persons aged fifteen and above was compared to the total population of the SADC. This data can be assessed under the Labour and Social Protection column of the World DataBank, World Development Indicators (WDI) issued annually by the World Bank. The time period covered is between 1980 and 2011 (World Bank, 2012b). FDInetinBOPSADCt is the Foreign Direct Investment, net inflows (Balance of Payments (BoP) at current US $) in year t. It is the net inflows of FDI into the SADC, which is estimated as the BoP, which is the difference in total value between payments into and out of the SADC over a time period. This data can be assessed under the Economic Policy & External Debt column of the World DataBank, World Development Indicators (WDI) issued annually by the World Bank. The time period covered was between 1980 and 2011 (World Bank, 2012c; World Investment Report, 2014).
This study employs secondary datasets to test the validity of the proposition that South African Multinational companies contribute to regional economic development and investment in the SADC. The MNC firm-level dataset was obtained from the McGregor BFA database, while the SADC country/aggregate dataset will be elicited from both the African Development Indicators database, and the World Enterprise Survey, which is provided by the World Bank, as well as other relevant sources to estimate the econometric models. However, firm level datasets will only be elicited for MNCs that originate from South Africa, and have an operational footing in the SADC region. The study incorporates both sources of data for the sake of validity and reliability of findings. This will promote the objectivity, accuracy, validity and reliability of the study. The datasets cover a period between 1980 and 2011 and for consistency sake; other set of data is generated for the same period.
The data collection process adopted by the original source of the datasets (that is, the databanks) attests to the reliability and accuracy of this set of data. The data is generated for various series and estimations, which have been used in previous studies (JSE, 2013; Department of Trade and Industry, 2013; Statistics South Africa, 2013). However, because of the uniqueness of this analysis (being both firm-level and policy related estimation, and also, the dynamic nature of the issue being investigated), some macroeconomic variables (like the rate of Economic freedom in the SADC) will be collected from a number of different sources such as the World Bank, the International Monetary Fund and the Economist Intelligence Unit. The data will be assessed from the Fraser Institute from 1980 to 2011. As indicated in the introduction section, this study focuses on the impact of South African MNCs contribution to regional economic development and investment.
In other to achieve this objective, the study adopts a series of regression techniques using the best regression model. Apart from the test for robustness, various diagnostic measures were undertaken. Some of the diagnostics techniques are not reported, but their statistical implications are mentioned. The author chooses to report the results for robust estimations only. In addition, Granger causality tests will be conducted since the ordinary least square (OLS) model employed only measures correlation. In order to measure precedence, and determine whether adding lagged values of a variable will help in the prediction of another variable, thereby causing it to change. The model specification for this study is depicted in the equation below:
Where: GDPSADCt is the dependent variable; it stands for the GDPof the SADC in year t;
MNCSAvt measures the value of South African MNCs contribution to regional economic development and investment in year t; Similarly,
INFRASSADCt is the level of Infrastructure development
in year t;
ECFREEDOMSADCt stands for the rate of Economic freedom in the SADC in year t;
EMPtoPOPrSADCt is the Employment to Population ratio in year t;
FDInetinBOPSADCt stands for the Foreign Direct Investment, net inflows (BoP at current US $) in year t;
While:
The data generated for this study is analysed using EViews statistical package (EViews 7.2). This statistical package is generally used in studies for regression analysis and diagnostics. It predicted current values of the dependent variable based on the current values of an explanatory variable and the lagged values of this explanatory variable. The parameters were estimated by ordinary least squares (OLS); nevertheless, such estimation was anticipated to give very imprecise results due to extreme multicollinearity among the various lagged values of the independent variable. Therefore, various tests were carried out to ensure that both the coefficients and residuals were stable using data diagnostics testing procedures such as the Breusch-Godfrey Serial Correlation LM Test, Heteroskedasticity Test (Breusch-Pagan-Godfrey), and Histogram Normality Test (can be assessed from the author). Granger Causality tests using bivariate regression form was conducted in order to determine whether correlation imply causation. This ensured that all spurious correlations that eventually become meaningless during real life analysis are eliminated.
In this analysis, after testing for regression analysis, the Breusch–Godfrey (BG) serial correlation LM test is then conducted afterwards. The test is used to measure autocorrelation in the errors in the regression model. It makes use of the residuals from the model being considered in a regression analysis, and a test statistic is derived from these (Godfrey, 1996). The null hypothesis is that there is no serial correlation of any order up to p. It is widely accepted in modern statistics that the test is more general than the Durbin–Watson statistic, which is only valid for nonstochastic regressors and for testing the possibility of a first-order autoregressive model (for example, AR(1)) for the regression errors. The BG testhas none of these restrictions, and is statistically more powerful than Durbin's h statistic (Godfrey, 1978).Under the classical assumptions, including homoscedasticity,ordinary least square is the best linear unbiased estimator (BLUE), that is, it is unbiased and efficient.
It has been observed that the efficiency is lost, however, in the presence of heteroscedastic disturbances. The author therefore decided to conduct the Breusch–Pagan-Godfrey test to examine the presence of heteroscedasticity. In order to test whether the estimated variance of the residuals from a regression are dependent on the values of the independent variables. After the Breusch–Pagan-Godfrey test is conducted, the Jarque–Bera (JB) test is used to test goodness-of-fit by ascertaining whether the sample data have the skewness and kurtosis matching a normal distribution. If the data comes from a normal distribution, the JB statistic asymptotically has a chi-squared distribution with two degrees of freedom, so the statistic can be used to test the hypothesis that the data are from a normal distribution. For small samples, the chi-squared approximation is overly sensitive, often rejecting the null hypothesis when it is in fact true. This leads to a large Type I error rate.
According to Jarque and Bera (1981, 1987), the JB test is a more advanced case of simultaneously testing the normality, homoscedasticity and absence of autocorrelation in the residuals from the linear regression model. Therefore, this makes this test an indispensable aspect of the data analysis for this study. Statistical measures of accuracy tests were performed on all econometrics variables for this study, in order to examine the reliability and internal consistency of the dataset. The Cronbach alpha (a) values for each of the variables were computed. All the econometrics variables Cronbach a were above the recommended threshold of 0.70 for Cronbach alpha (Nunnally, 1978). The minimum value of the item-total correlation among all the constructs surpassed the minimum (£0.3) level recommended by Dunn et al. (1994).
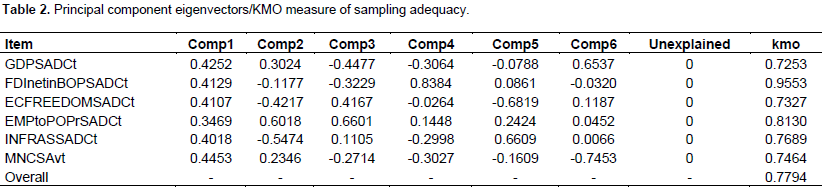
Table 1 provides evidence that each of the econometric variables exhibit satisfactory reliability with values ranging from 0.9056 to 0.9399 (Henseler et al., 2009; Hair et al., 2011). Furthermore, principal component analysis (PCA) was carried out to ensure robustness of the econometric variables (Jackson, 2003). The PCA process takes cognisance of the leading eigenvectors from the eigen decomposition of the correlation of the variables, and also describe a series of uncorrelated linear combinations of the variables that contain most of the variance. From this data eigenvectors from the PCA are inspected to learn more about the underlying structure of the data (Anderson, 1963; Tyler, 1981).
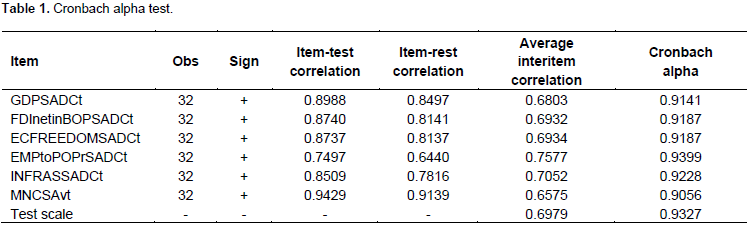
Table 2 shows that the loadings of the principal components indicate a very good distribution of the correlated data, and since the unexplained variables is equal to zero, it then means that the model accurately predicted the PCA. More so, the Kaiser-Meyer-Olkin (KMO) measure of sampling adequacy has a range value that is between 0 and 1, with small values indicating that overall the variables have too little in common to warrant a PCA analysis. According to Kaiser (1974), KMO value of 0.00 to 0.49 is unacceptable, 0.50 to 0.59 is miserable, 0.60 to 0.69 is mediocre, 0.70 to 0.79 is middling, 0.80 to 0.89 is meritorious, and 0.90 to 1.00 is marvellous. This implies that the KMO value of FDInetinBOPSADCt (that is, the level of FDI, net inflows (BoP at current US $)) is marvellous, while the KMO value of EMPtoPOPrSADCt (that is, the level of employment to the population ratio of the SADC) is meritorious, whereas, KMO of the remaining variables is middling or average.
Furthermore, the test for Unit Root was conducted using Augmented Dickey-Fuller (ADF) technique, and Difference-Stationary Process (DSP) was used to transform the time series data into a stationary trend (Woodward et al., 2012). The results of the Unit Root tests, suggest that the series did not exhibit any statistical indication of the presence of Unit Root, as all the variables tested were stationary at both the first and second difference. Likewise, the ritical values of the variables at their respective significance levels were at either 1% and/or 5% levels. Similarly, Johansen Cointegration test indicated that there is a long run relationship or associationship between the econometric variables in this study (Kaya et al., 2010; Saka and Lowe, 2010; Bayar et al., 2014), and that the variables of this study move together (therefore, all the six variables are cointegrated). While, further establishing the usefulness of this study’s hypothesis group statistic equation over a long period of time (Hatemi, 2008). These rules out any possibilities of a spurious relationship between them and also suggests that a causal relationship must exist in at least one direction (Johansen and Juselius, 1990).
Table 3 shows that the factor analysis/correlation, factor loadings (pattern matrix) and unique variance values reflect a fair distribution in the data. Likewise, Table 4 presents the descriptive statistics including mean, standard deviation, minimum and maximum values, as well as correlations for all the variables in this study. From Table 5, the regression model F-statistics of 29.19 indicates that the variables in this model exhibits high predictive ability, and the probability of the statistic; Prob. F-statistic (that is, 0.0000) represents the probability that the equation or model employed is statistically significant at 1% level of error. The p-value ofthe model (0.0000) indicates that the explanatory variables used are collectively significant in explaining the variations expressed by the dependent variable, and this asseveration is buttressed by the strong value of the Adjusted R-Squared (0.88).
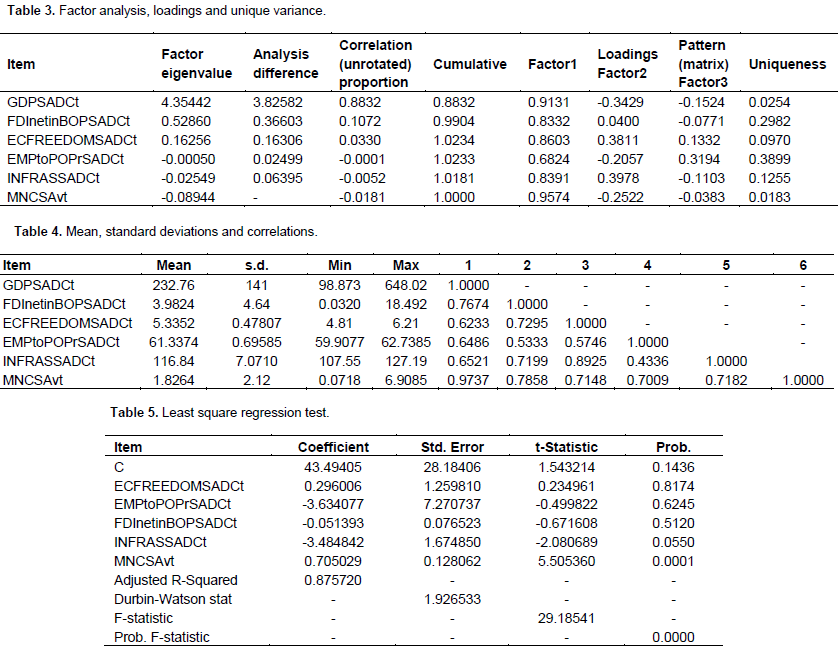
It therefore, suggests that 88% of the total change in the dependent variables can be attributed to the independent variables. We therefore accept the alternate hypothesis that South African multinational companies contribute to regional economic growth and investment in the SADC. In order to find out whether residuals are serially correlated, residual diagnostics was performed on the residuals through a Breusch-Godfrey Serial Correlation LM Test (with 2 lags). The OBs*R-Squared corresponding P-value (Prob. Chi-Square (2)) of 0.1219 indicates that since the P-value is more than 5% means that the null hypothesis cannot be rejected, rather the study accept the null hypothesis which states that residuals are not serially correlated. This indicates that our model exhibits the feature of the best regression model, which is good. This fact is supported by the Durbin-Watson statistic figure of 1.926533 (approximately 2), which indicates that there is no serial correlation in the residuals.
The Breusch-Pagan-Godfrey Heteroskedasticity test was used to check whether the residual value is either efficient or unbaised. It was observed that the Obs*R-squared corresponding P-value Prob. Chi Square (5) value of 0.7186 is more than 5%. This means that the study cannot reject null the hypothesis; that the residualsare homoskedastic, rather the study accept null hypothesis; as residuals are not heteroskedastic, which is desirable.Since this study is prompted by the need to find out whether South African MNCs contribute to regional economic development and investment, the statistical evidence analysed so far suggests that their presence in the SADC compensates significantly, where member states have failed, especially as it concerns capital, innovation and strategic intent (Mthombeni, 2006; Pradhan, 2010; Hunya, 2012; Acquaah et al., 2013).
Although various theories have been expatiated, in order to cope with the international business (IB) literature concerns such as location bound firm specific advantages (FSA), the liability of foreignness (LOF) or outsidership, as well as psychic distance (Rugman et al., 2011; Zhou et al., 2016), however, it is not well understood how MNCs in less developed countries (like the SADC) internationalise regionally (considering the enormous challenges faced by MNCs that operate in such markets), thus the study analysed the relationships that exist between the various econometric estimates for this study. Additionally, in the Appendix section of this study, Appendix A specifies that the First difference line for the hypothesis mean value hovered around zero, which is desirable. While Appendix B revealed that the Pie graph for the hypothesis is fairly distributed amongst all econometric variables.
Relationship testing for the hypothesis
The relationship between the value of South African MNCs and the cumulative GDP of the SADC
The t-statistic p value of 0.0001 (00.01%) indicates that the value of South African MNCs contribution to regional economic development and investment; MNCSAv
t is statistically significant to influence the value of the dependent variable (since sig f < 0.0500 is statistically significant). This means that the value of South African MNCs contribution to regional economic development and investment can individually cause a variation in the dependent variable Y, which is the cumulative GDP the SADC (GDPSADC
t). Furthermore, the coefficient of the regression equation (

) has a non-random known constant value of 0.705029. This means the coefficient of the regression equation (
) has a direct positive relationship with the dependent variable (GDPSADC
t).
Since MNCSAv
t is a continuous variable,
represents the difference in the predicted value of GDPSADC
t for each one-unit difference in MNCSAv
t, if other independent (predictor) variables remain constant. However, the value of South African MNCs’ contribution to regional economic development and investment can also individually cause a variation in the dependent variable GDPSADC
t. The relationship that exist between the two variable estimates indicate that the expansion in South African MNCs activities in the SADC was large enough to more than offset for the countervailing measures caused by the negative impacts of the low level of infrastructural development in the SADC (Chingono and Nakana, 2009; Carmody, 2012; SADC, 2012), as well as the low level of skills and balance of payment (SADC, 2015) that is experienced in the region.
This ultimately led to an increase in the cumulative GDP of the SADC. The results show that strengthening MNCs in SADC countries increases the production and exports of new products, without affecting existing exports (World Investment Report, 2010, 2014). This can be attributed to the incentive structure that is provided by the SADC to member nation MNCs (Department of Trade and Industry, 2013). It may also be (as our data suggest) due to South Africa MNCs exploiting their core competencies and location bound FSAs, which compensates for the negative impact of LOF, outsidership and psychic distance as elucidated by several IB scholars (Rugman et al., 2011; Zhou et al., 2016).
The relationship between the value of South African MNCs and the level of regional economic development (infrastructure)
The t-statistic p value of 0.0550 (05.50 per cent) indicates that the level of regional economic development (infrastructure); INFRASSADC
t is statistically insignificant to influence the value of the dependent variable (since sig f < 0.0500 is statistically significant). This means that the level of regional economic development (infrastructure) cannot individually cause a variation in the independent variable Y, which is the cumulative GDP the SADC (GDPSADC
t).Similarly, the coefficient of the regression equation (

) has a non-random known constant value of -2.080689. This means the coefficient of the regression equation (
)has a direct negative relationship with the dependent variable (GDPSADC
t). Since INFRASSADC
t is a continuous variable,
represents the difference in the predicted value of GDPSADC
t for each one-unit difference in INFRASSADC
t, if other independent (predictor) variables remain constant. More so, the level of regional economic development (infrastructure) cannot individually cause a variation in the dependent variable GDPSADC
t. The computed statistical evidence suggests that a high level of regional economic development can be attributed to standard infrastructural facilities, since it aids the trade formation process (World Bank, 2012a).
The relationship between the value of South African MNCs and the rate of economic freedom in the SADC
The t-statistic p value of 0.8174 (81.74 per cent) indicates that the rate of Economic freedom in the SADC; ECFREEDOMSADC
t statistically insignificantly influences the value of the dependent variable (since sig f < 0.0500 is statistically significant). This means that the rate of Economic freedom in the SADC cannot individually cause a variation in the independent variable Y, which is the cumulative GDP the SADC (GDPSADC
t). Likewise, the coefficient of the regression equation (

) has a non-random known constant value of 0.234961. This means the coefficient of the regression equation (
) has a direct positive relationship with the dependent variable (GDPSADC
t).
Since ECFREEDOMSADC
t is a continuous variable,
represents the difference in the predicted value of GDPSADC
t for each one-unit difference in ECFREEDOMSADC
t, if other independent (predictor) variables remain constant. However, the rate of Economic freedom in the SADC cannot individually cause a variation in the dependent variable GDPSADC
t. Our findings demonstrate that the degree of economic freedom affects the scale of MNC activity in the SADC, and inform the argument of whether obtaining extensive information regarding the rent seeking activities of government, as well as the rate of corruption in the region results in an effective or ineffective policy (Fraser Institute, 2014; World Investment Report, 2014).
The relationship between the value of South African MNCs and the level of employment of the SADC population
The t-statistic p value of 0.6245 (62.45 per cent) indicates that the level of employment to the population ratio of the SADC; EMPtoPOPrSADC
t statistically insignificantly influences the value of the dependent variable (since sig f < 0.0500 is statistically significant). This means that the value of employment to the population ratio in the SADC cannot individually cause a variation in the independent variable Y, which is the cumulative GDP the SADC (GDPSADC
t). Relatedly, the coefficient of the regression equation (

) has a non-random known constant value of – 0.499822. This means the coefficient of the regression equation (
) has a direct negative relationship with the dependent variable (GDPSADC
t).
Since EMPtoPOPrSADC
t is a continuous variable,
represents the difference in the predicted value of GDPSADC
t for each one-unit difference in EMPtoPOPrSADC
t, if other independent (predictor) variables remain constant. However, the level of employment of the SADC population cannot individually cause a variation in the dependent variable GDPSADC
t. The estimate for this econometric variable implies that the employment to population ratio matters (SADC 2012; 2015), as it affects the level of productivity, and the mode of operation that most MNCs utilises in achieving their objectives (that is, either through capital or labour intensive system of manufacturing). Due to the non-availability of a highly skilled workforce in the region, critical skills visa issuance has been used to remedy the situation, although this short term measure negatively impacts on the rate of employment, over time, locals can be trained to take over from expatriates when necessary (Erasmus and Breier, 2009; SABPP, 2012; Valsamakis, 2012; Gqada, 2013; KEN, 2013).
The relationship between the value of South African MNCs and the level of FDI, net inflows (BoP at current US $)
The t-statistic p value of 0.5120 (51.20 per cent) indicates that the level of FDI, net inflows (BoP at current US $) in the SADC; FDInetinBOPSADC
t statistically insignificantly influences the value of the dependent variable (since sig f < 0.0500 is statistically significant). This means that the level of FDI, net inflows (BoP at current US $) in the SADC cannot individually cause a variation in the independent variable Y, which is the cumulative GDP the SADC (GDPSADC
t).Comparably, the coefficient of the regression equation (

) has a non-random known constant value of -0.671608. This means the coefficient of the regression equation (
) has a direct negative relationship with the dependent variable (GDPSADC
t).
Since FDInetinBOPSADC
t is a continuous variable,
represents the difference in the predicted value of GDPSADC
t for each one-unit difference in FDInetinBOPSADC
t, if other independent (predictor) variables remain constant. However, the level of FDI, net inflows (BoP at current US $) cannot individually cause a variation in the dependent variable GDPSADC
t. Our data suggest that although inward FDI can be considered beneficial to the region, outward FDI is usually associated with profit repatriation, as well as its negative impact on the BOP, which ultimately leads to budget deficits that compels most of the SADC member nations to borrow (due to worsening capital and current accounts) in order to balance the budget, and carry out public expenditure
projects (Mthombeni, 2006; IMF World Economic Outlook, 2012; Economic Commission for Africa, 2013; World Investment Report, 2014).
Although regression and diagnostic tests were conducted in Table 5, it is considered important to investigate the Jarque-Bera Histogram Normality test. This is carried out to test if the study residuals are normally distributed (in this study, the results are only presented). The Jarque-Bera P-value of 43.55% means that the study cannot reject the null hypothesis, as it has more than five per cent significance level, rather the study accept null hypothesis, that is, residuals are normally distributed, which is desirable. Granger Causality tests are generally used in estimations to examine whether there exists a long-run relationship between the macroeconomic variables under study (Baltagi, 2008). It is a known fact that the OLS model measures correlation; however, correlation does not imply causation. This necessitates the computation of Pairwise Granger Causality test (Table 6), in order to avoid spurious relationships in the regression estimate. The pairwise Granger causality for all combinations of the dependent and independent variables shows that each variable does not Granger cause the other (except in three instances). Therefore, the study accept the null hypothesis in all cases, as the F-Statistic corresponding P-value is not significant enough to be rejected over 2 lag periods.
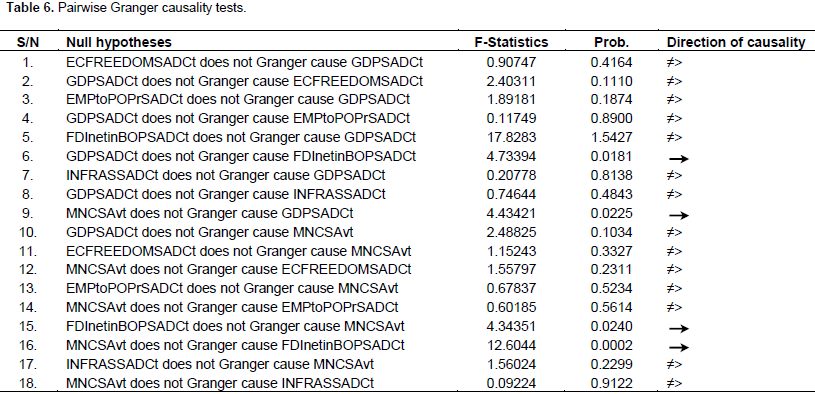
The data shows that: Granger Causes MNCSAvt as its P-value of 0.0240 is significant, and MNCSAvt Granger Causes FDInetinBOPSADCt as its P-value of 0.0002 is also significant. Therefore, both null hypotheses are rejected, while the alternate hypotheses are accepted. This means that the level of FDI, net inflows (BoP at current US $) causes the value of South African MNCs’ contribution to regional economic development and investment in the SADC to either rise or fall over a lag length of 2, just as the value of South African MNCs contribution to regional economic development and investment in the SADC causes the level of FDI, net inflows (BoP at current US $) to either rise or fall over a lag length of 2. There is therefore, a bi-directional causality between MNCSAvt and FDInetinBOPSADCt. However, it was observed that there is a correlation between the value of South African MNCs’ contribution to regional economic development and investment in the SADC, and the cumulative GDP of the SADC.
More so, it was observed that MNCSAvt does Granger cause GDPSADCt as its P-value of 0.0225 is significant, but GDPSADCt does not Granger cause MNCSAvt. There is therefore, a uni-directional causality between the value of South African MNCs contribution to regional economic development and investment in the SADC (MNCSAvt) and the cumulative GDP of the SADC (GDPSADCt). Similarly, it was observed that there is a correlation between the cumulative GDP of the SADC and the level of FDI, net inflows (BoP at current US $). More so, it was observed that GDPSADCt does Granger cause FDInetinBOPSADCt as its P-value of 0.0181 is significant, but FDInetinBOPSADCt does not Granger cause GDPSADCt. There is therefore, a uni-directional causality between the cumulative GDP of the SADC (GDPSADCt) and the level of FDI, net inflows (BoP at current US $) (FDInetinBOPSADCt).