Full Length Research Paper

ABSTRACT
The paper aims to provide an insight into underlying factors which a given mix of owners’ funds and outside funds have on the payout of KSE 30 Index. Capital structure comprises equity and borrowed funds (debt) that listed companies need to carry out their business operations. We have applied panel data methodology on twenty-one KSE-30 companies for the period of 2001-2011. Our results show that high proportion of owners’ capital in capital structure of the firm and Return on Equity results in higher payout. Companies, depending on where they stand on the growth curve, likely use funds firstly for opportunities of capital investment required for growth and thereafter if sufficient funds permit make decision for a payout. As a result, payout can only emerge if out of the residual leftover there is a sufficient cash-flow to distribute as dividend.
Key words: Capital Structure, Gearing, Tax shield, Debt financing, Equity Financing, Dividend payout, Investment, Long-term finance, Internal funds, KSE-30
INTRODUCTION
This paper gives an insight as to whether capital structure has influence over dividend payment for the companies that fall within the purview of KSE-30 index. In other words does capital structure of the company play any role in the payout by a company? The firms, by and large, depend on the combination of equity and debt financing to run operations. The paper seeks to draw conclusion: Of any influence of capital structure on payout of KSE-30 index companies.
We begin with the conjecture that shareholders invest and retain their investment in firms and while they do so their objective is to get a reward on their investment through dividend payment. If they do not get any dividend on their investment or the dividend given by the company is poor compared to comparable investment opportunities they look for other investments avenues. Firms therefore need to reward shareholders if they seek to have shareholders investment in their firm, in other words equity financing.
On the other hand, firms need outside capital (debt) also to finance their business expansion and other capital requirement needs. Firms seek outside capital as in most regimes it gives a tax-shield. Interest payments are tax deductible as such leveraging gives this advantage. So as a business decision the firm can lever to the extent that it does not run risk that might hit its ability in meeting its debt obligation.
A firm capital structure need to be calibrated: a highly leveraged firm may find it difficult to pay its obligations in recession. As borrowings mostly require fix payment, periodically, on count of interest payment, on the amount of borrowing, downturn in the business may bring a heavy toll (for highly leveraged firms) and as such a firm might have to stretch beyond capacity. Firms may likely seek outside funds for example when borrowing rates are attractive and when they are in high tax corporate tax bracket to secure a tax-shield. This helps improve the liquidity position of the firm, reducing cash outflow on account of tax payment.
It therefore follows that each firm needs to set a capital structure, perhaps an optimal structure, so as not to lose on tax advantages and in the process also not over- lever to the extent of defaulting on its fixed commitments. Hence financial managers should plan to get maximum out of the capital resources that need sustainability and result in market capitalization growth.
Capital structure of cross-section of corporate depicts that firms cannot be only equity financed (a rare feat). As such firms have to look also for outside funds to propel growth, and support its operational activities. Firms with higher component of equity in the capital structure cannot be oblivious of the right of shareholders to receive dividends. Though dividends are not contractual obligation like payment on debts in order to retain the interest and hence investment of the shareholders, mangers have to provide a return to shareholders. This is crucial while deciding on retention vs payout. As such right mix of debt and equity is tactical decision and an important part of financial planning.
Market capitalization of the firms is low that have poor record on payout. Gradually shareholders lose interest in continuing investment with such firm. This can also impact their entity rating, and eventually cast doubt on the managerial ability to increase shareholders’ value. Similarly a firm that fails to keep its owners happy may not be the first choice of lenders.
For examples if firm goes for bond financing, the instrument rating might be greatly impacted due to past performance with regard to past commitment (payment of debt and payment of dividends). Hence the firm may not get the desired funds, or may get it at a comparatively high cost. Thus payment of dividend is a critical factor in all decisions by the firm.
“Once a company starts paying a cash dividend, it is a precedent,” says Chichester (2012). And declaring a dividend can put a company on the “treadmill” of wanting to increase the dividend year after year. “Once you start, it is painful to stop,” The Power of Paying Dividends Capital Markets | March 07, 2012 | CFO.com | US.
Firms of big size can borrow at good rates compared to those that are smaller. This is for the reasons that lenders, particularly bankers, are comfortable on the asset size of the company that serves as security against borrowing. In this respect smaller companies may be constrained to raise debt.
On the equity side firms need to make a critical decision when to pay dividends, a regular low payout, an infrequent high payout or any other form of dividend payout, to retain and keep the interest of equity holders alive. Firms may not pay dividends if they find good opportunities to invest their earnings for further expansion of business or even to acquire some other businesses. Mangers have to work out priorities, so as to reward shareholders and keep the growth momentum.
Free cash-flow also influences payouts; a firm with large cash-flow and limited investment opportunities may pay higher dividends or may take decision of buy-back of shares. Hence cash-flow has more influence on payout than only profitability.
Debt covenants on borrowing do restrict and influence payment of dividends according to the studies by Smith and Warner (1979) and Kalay (1982). Although cash-flow may permit a firm to pay dividends, conditions related to borrowing need compliance. This is the case in Pakistan for bank borrowings and TFCs (similar to bonds, internationally), whereby cash availability may restrict payout owing to restrictive covenants.
Market expectations of improved dividends may run high in future for firms retaining earnings and passing over payouts at present. This decision is based on opportunities not necessarily on the composition of debt and equity. As earnings are determined after payment of borrowing cost, in all fairness net earnings are for shareholders. If dividends are deferred, shareholders give a sacrifice. They in turn expect more in the form of improved dividends not for their sacrifice but for expected improved earnings, while managers capitalize on growth and investment opportunities.
Shareholders might not prefer regular dividend payout if there is visible gap between tax on payout and capital gains. Usually investors prefer lower tax on capital gains as opposed to higher tax on dividend payment. As such firms have to see the clientele effect while deciding on policy of payout. Corporate taxes have also impact on dividend payout as countries tax regime differs. Studies have shown that countries provide tax concession due to nature of their ownership and places where they establish businesses.
In regimes where shareholders have more protection there is high probability of firms paying dividends as opposed to regime where protection of shareholders appears frail and insider ownership dominates the firm capital structure.
Our study is confined to impact of internal factors on the performance of the companies. As such we have excluded, in our study, the impact of GDP, interest rates, currency parity and other macro-economic variables.
In the light of the above discussion we postulate that capital structure influences payout. In this realm we have undertaken a study of KSE-30 to find if the postulate stands true for companies under study. The study is constructed thus: section 2 provides the literature review of the selected studies. In section 3, we present data, their source and construction. The methodology discussed in section 4. Section 5 presents the detailed empirical results. The last section 6, underlines the limitation of the paper.
LITERATURE REVIEW
While stating that dividend payout kind of remains a puzzle, Black (1976) is of the view that a high portion of companies earnings are paid in the form of dividends. Studies have shown that firm capital structure impacts dividends and cost of borrowing does influence dividend payout. Jalillv and Harris (1984)’s studies reveal inter-dependence between financing decisions, mobilization of outside funds (categorized as current liabilities and long-term sources of funds) liquidity level, and additional issue of equity and dividend payout.
Mix of debt and equity impacts the cost of capital and hence value of a firm, according to Pagano (1993), Boyd and Smith (1998) and Hovakimian et al.(2001). As a corollary of this, firms need to strategize on the omix owners funds and outside funds while they build up their capital structure.
Aivazian et al. (2003) have found out that firms in the emerging markets and in the USA portray same dividend trend. However, emerging market firms rely more on external financing. Big firms in Korean corporate sector rely on debt financing as Gul and Kealey (1999)’s study of 411 giant firms reveals. Further their conclusion is that Korean Corporate sector growth options of firms depict sort of negative relation vis a vis payout and reliance on outside funds is negatively related to leverage and dividend. As such their conclusion reveals that Korean corporate sector behaves differently from those in the U. S., in matter of dividend payments.
Other studies by Li and Zhao (2008), Amidu (2007) and Al-Kuwari (2010) reveal that leverage is negatively related to dividends. Zhang (2007)’s study of S&P 500 study depicts that family firms have lower payout than non-family firms. Firms change, in consonance with stock price, their capital structure as study of Welch (2004) reveals and not countering mechanical impact of stock returns on capital profile, by issuing new securities.
Debt policy and the relation between agency-principal problems have been tested by Kim and Sorensen (1986). They conclude and provide insight that firms having concentration of ownership go for more leverage. Conversely firms with spread ownership have low leverage.
Marsh (1982)’s study reveals that smaller firm choose short-term financing while it is opposite in the case of large firms. Further his study depicts that cost of issuing debt and equity is negatively related to firm’s size. According to Mahadwartha (2003), not all Indonesian quoted companies are in a position to keep a consistency in their payouts. Studies have shown that firms with more equity in their capital structure pay more dividends.
In the matter of capital structure there are marked differences between developing and developed countries. Study by Atkin and Glen (1992) depicts that G7 countries’ firms substantially rely more on internally generated funds. While in developing countries, there is mix of debt and equity, from an important part of the capital structure of the firms. Firms that are geared comparatively give more payout as others studies show positive relationship between payout and debt.
Azhagaiah and Priya (2008)’s study shows that shareholder’s wealth is a factor of increase in sales, a healthy bottom line, capital decisions; both the structure and investment. Increase in shareholder value comes through payouts and improvement in market capitalization. Pandey (2005) expresses that the company’s major objective is to create shareholders’ wealth.
According to Grullon et al. (2002)’s study, firms increase dividends when they anticipate less desirable investment options. On the other hand, Lie (2000)’s findings reveal that firms increase dividends when their cash coffers are fuller than those compared to other firms in the same sector.
Mizuno (2007) concurs, that firms need to give a payout else they have to justify investments in suitable projects that bring higher returns than expected by the firm shareholders. Ramamurti and Vernon (1991)’s study finds quite a significant distinction in debt and equity composition of listed companies. Owners’ funds are higher in comparison to outside funds in case of Brazil (75% equity) and Malaysia, but low in India and Pakistan (with around 30% equity). Studies have shown that there is significant relationship between debt and payout.
Future earnings and dividends and impact on cost of capital, according to Foong et al. (2007), are dependent upon firm’s investment. East Asian firms pay less dividends, according to Faccio et al. (2001); compared to Western Europe firms, that have better shareholders’ protection.
Managers focus and carve dividend policy on the basis of stock prices, as Baker and Wurgler (2004)’s study shows that managers prefer no dividends when investors are for non-dividend paying stock. On the other hand dividends are paid when investors have more confidence in the company’s performance. In case where the share-holding pattern shows more of shareholders preferring capital gains as opposed to dividends, the action of no dividends augurs well.
Graham and Harvey (2001)’s paper suggests that dividend payouts and a given composition of debt and equity are correlated. Kasim and Rasheed (2014)’s study shows sales, liquidity and profitability influence dividends payment in the power and cement sector (listed companies in Pakistan). The power sector has a positive relationship with efficiency and profitability and payout. The study concludes that payout decision by a company is not based only on capital structure but also revenue, cash-flows and net profit influence decision for a payout.
In the study of six countries (USA,UK, Canada, Germany, France, Japan) Denis and Osobov (2008) found that size, profitability, and firm maturity influence the propensity to pay dividends. This corroborates with Kasim and Rasheed (2014)’s study.
Higher equity/ownership in a firm by insider, institutions and foreigners has positive relationship with the dividend policy on KSE-100 index (Hamid ullah, 2012). The thrust of this study is in the context of agency theory. According to findings ownership structure plays important role in corporate dividend policy resulting in minimizing the agency cost related to the agency issue. Reflecting managerial share ownership has negative relationship with payout.
Studies have shown that big firms that demonstrate stable business and steady cash flow tend to pay high dividends. Li and Lie (2006)’s, Denis and Obsbove (2008)’s, DeAngelo et al. (2006)’s, Al-Kuwari (2010)’s studies corroborate that steady cash flows results in higher payout. Companies in the growth stage do use more cash-flow to support their expansion and as such there is a negative relationship between growth and dividends. This is also conclusion of the study by Anil and Kapoor (2008) and Lia et al. (2010).
There is a significant positive impact on market value of KSE -30 index due to payout (Arsalan 2014). This study examines variables like earning per share, profitability ratio, return on equity, retention ratio and price earnings ratio.
Profit Margin and Return on Equity have positive significant relationship (Qaier et.al 2011) on KSE -30 index, due to good governance practices of firms.
Research also indicates a positive correlation between debt and dividends. Tong and Green (2005) in their stu-dy of a cross-section of big Chinese (listed companies) have concluded that there exists a significant positive correlation between current debt financing and past dividends.
Data and variables used
We have taken companies that are part of KSE 30 index as on June 2013. KSE-30 Index comprises firms from a cross section of the economy. Hence firms will differ in their capital structure and payout. The selection of the companies is not based only on asset size and capital structure but predominately on the free float of their share, and as such firms getting into the list of KSE-30 index need to demonstrate a sizeable activity in their share transaction at the Karachi Stock Exchange.
KSE-30 Index: Serves as a yardstick against which the market prices of firms can be compared over a period of time. As a result KSE-30 index underlines a mechanism by which investors can gauge equity market behavior and outlook. In the matter of eligibility, the listed company must have an operational track record of at least one financial year; should also have minimum free-float shares of 5% of the paid-up capital and securities are traded for 75% of the total KSE trading days. The index is re-composed on semi-annual basis.
All the data used in this research is taken from the publication “Financial Statements Analysis of Companies (Non-Financial) Listed in Karachi Stock Exchange” published by State Bank of Pakistan (SBP) for the period of 2006-2011. An earlier version of this publication, reported the data for the period of 2001-2005. The publication contains analysis of financial statements of non-financial institutions. Further, we have excluded financial and insurance companies from the KSE-30 companies due to the fact that SBP publication does not provide data on these companies. We have consistently relied on this single source for the purpose of consistency of data and definition. Although the data was available in Annual Reports of the respective companies, we consider data published by State Bank of Pakistan (SBP) for the period of 2001-2011 as more appropriate as part of our research. Our sample consists of 21 companies and covering the period 2001-2011. Below is the description of the variables used in this report.
Dividend per share is calculated as dividend paid for a given financial year divided by shares outstanding.
Capital Structure
Capital structure describes how a corporation finances its assets. The composition of debt is arrived by dividing Total Debt by Total Assets and composition of Equity by dividing Total Equity by Total Assets.
Asset turnover (Efficiency)
Efficiency is measure as the asset turnover of a firm, how much a firm uses its total assets in generating sales revenue or sales as a percentage of total assets.
Profitability
Profitability refers to net profit after tax as a percentage of total sales/revenue.
Return on equity
It is measured to ascertain the return on owners’ fund. ROE is obtained by dividing net profit after taxes with the total equity. We have taken net income before tax as well as net income after tax as a percentage of shareholders’ equity.
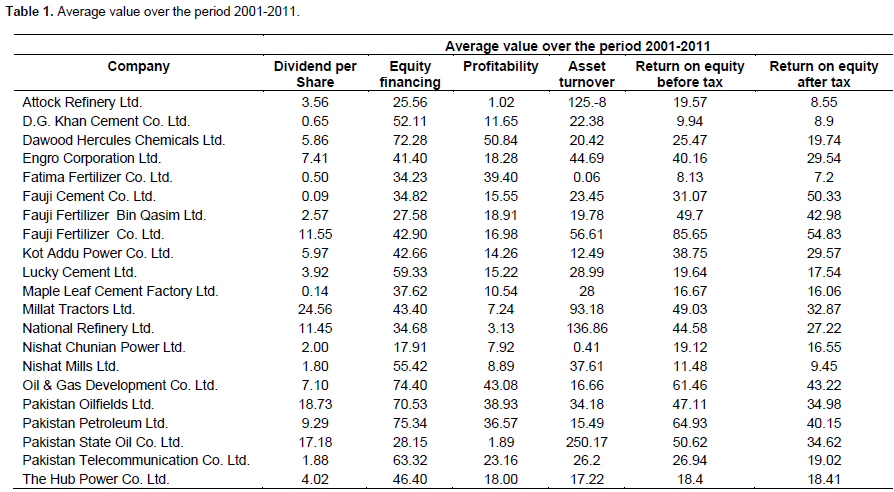
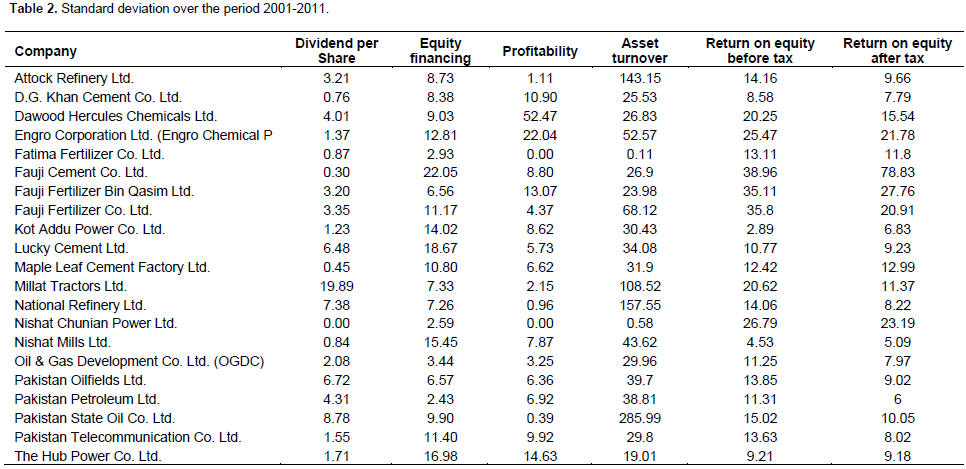
KSE 30 Index comprises listed companies from various sectors, a case of heterogeneity; the results therefore should be read with this in mind. Certain companies require substantial funds to keep up with their expansion plans and as such need to plough back their earnings. Whilst other in the index comparatively do not require such magnitude of funds and have more free-cash availability. However the inventors’ interest in KSE 30 Index is higher compared to other listed companies on the Karachi Stock Exchange. Their turnover of shares is vibrant and important factor, to retain place in the index. In the process, KSE-30 turnover bench mark and market capitalization are attained (Tables 1 and 2).
METHODOLOGY
We postulate that capital structure influences the payouts in KSE-30 index. The composition of companies in KSE-30 index represents cross-section nature of data. The data gathered for research comes from the publication of State Bank of Pakistan (SBP) for the period of 2001-2011 represent time-series properties (Table 1); therefore, we applied panel data analysis. Panel data models examine individual (company-specific) effects, time effects, or both in order to deal with heterogeneity or individual effect that may or may not be observed. We focus on panel regression models. In particular, we are interested in examining the impact of equity financing, profitability, asset turnover, etc. on dividend per share (Table 2). While using the assumption that all co-efficients are constant across time and individual companies, we assume that there is neither significant company nor significant temporal effects. The panel regression model is used in the following form:
In the above formulation i stands for the ith cross-sectional individual (i.e. company) and t for the tth time period. The dependent variable is the dividend per share. Our hypothesis is the dividend per share is a function of equity finance, key company-specific variables like profitability, efficiency and Zit other company specific variables, while εit is a stochastic error term. If individual company’s effect α1i (cross-sectional or time specific effect) does not exist, ordinary least square (OLS) produces efficient and consistent parameter estimates. OLS consists of five core assumptions (Greene, 2008), i.e. linearity, exogeniety, homoscedasticity, observations on the independent variable should be fixed over repeated sampling and full rank assumption. If company’s effect is not constant in longitudinal data, heterogeneity (company specific characteristics like (i.e. company size, etc...) may influence assumptions of exogeniety and homoscedasticity. The violation of assumptions produces biased estimators. Hence, the OLS estimator is no longer best unbiased linear estimator. Then panel data models provide a way to deal with these problems. The Fixed Effect model (FE), also referred to as the “Least-Squares Dummy Variable (LSDV) model” estimates the intercept as coefficient of dummy variables. This model allows intercept to vary for each cross-section and thus accounts for the individual effect. FE estimation controls for company-specific heterogeneity by eliminating (demeaning) all time-constant information for each company i from the data. It is termed the within estimator, since it depends on the variation within the individual (company). It does not matter if some individual (company) hase.g. very high y values and very high x values because it is only the within variation that will show up as explanatory power. If the assumption that unobserved hetero-geneity is uncorrelated with the variables in the model a Random Effects (RE) estimation is used to assess the effects of the explanatory variables in the model. If the unobserved heterogeneity is correlated with the explanatory variables then the random effects model cannot be estimated consistently (Hsiao, 1986; Mundlak, 1978).The orthogonality test for the RE and the independent variables is also examined. For this reason, a Hausman test is used in order to test for inconsistency in the RE estimate. The general idea of the Hausman test is the following: If two estimators are consistent under a given set of assumptions, their estimates should not differ significantly. Let us call this set of assumptions A. Under a different set of assumptions, say B, this may not be true. If, in this case, only one of the two estimators provides consistent estimates, then the estimates from both estimators should differ significantly. Hausman showed that the standard error of these differences is a simple function of the variance-covariance matrices of each estimator. In our case, A equals a panel model, in which unobserved hetero-geneity is uncorrelated with the independent variables in the model. In this situation, both RE and FE estimates are consistent, with RE estimates being more efficient than FE estimates. B pertains to a model with correlated unobserved heterogeneity, in which RE estimation provides biased results, while FE estimation is still consistent. If there are no other statistical problems the FE model can be estimated consistently although the estimated parameters are conditional on the time effects in the selected sample of data (Hsiao, 1986).
EMPIRICAL RESULTS AND DISCUSSION
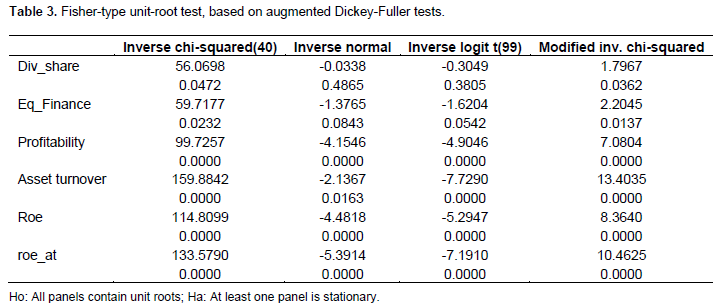
Our analysis starts with examination of panel unit root tests for the variables considered in the model formulation. A graphical examination suggested that a constant term were to be included in the model formulation with the number of lags consider as zero, because data were collected for smaller time periods. Further, the data were unbalanced panel; the appropriate unit root test was Fisher-type test. The results of the tests applied to the variables involved are presented in Table 3. We can conclude from this table that neither all panels are stationary nor contain unit root. The period T of each company in this study is only 10 years (yearly observation); this is considerably short for many econometric studies, so it is not appropriate to get conclusive results for unit root tests (Baltagi, 2008). The unit root test is generally available for large N and large T. We have applied Panel Data Heteroscedasticity Wald Test using STATA. The null hypothesis Ho: Panel Homoscedasticity, and the alternate hypothesis Ha: Panel Heteroscedastic. The P- Value, 0.0071 (see Appendix 1) significantly rejects the null hypothesis of Panel Homoscedasticity.
Since our data contain unobserved heteroscedasticity, we should use fixed effect or random effect model of panel data analysis.
Table 4 shows the results of four different variants of equation (1) above. The first variant of equation (1) does not have any Z variables (company characteristic). This shows the dependent variables is dividend per share, and
the independent variables used in this variant are equity financing, profitability and asset turnover (efficiency), labeled as FE1. The second variant includes return on equity before tax (roe) labeled as FE2. The third variant includes return on equity after tax (roe_at) labeled as FE3. The fourth variant is roe_at and its square (roe_at2). All these four variants are also estimated as random effects model.
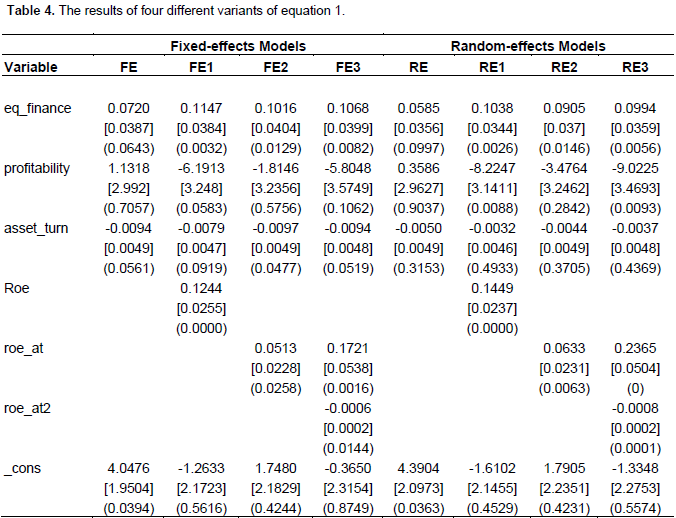
The first line shows co-efficient, second line standard error and third line is p-value. For detailed results please see appendix 2.
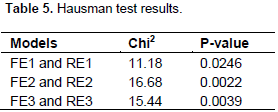
To decide between fixed or random effects we run a Hausman test where the null hypothesis is that the preferred model is random effects vs. the alternative fixed effects (Green, 2008, chapter 9). The null hypothesis is that the preferred model is a random effects model and the alternative is the fixed effects model is preferred. We have applied Hausman test with sigmamore option, Hausman test base on both (co)variance matrices on disturbance variance estimate from efficient estimator. The result is shown in Table 5. Under the current specification, our initial hypothesis that the company-level effects are adequately modeled by a random-effects model is significantly rejected. We may conclude that Fixed-effects model is consistent and efficient.
Further, we proceed with the estimation of FE with Driscoll-Kraay standard errors calculated using the formula by the Driscoll-Kraay (1998), which corrects the variance-covariance matrix for the presence of serial[1] as well as spatial correlation (Camarero et al., 2010). Appendix 3 shows the adjusted result for fixed-effects model.
Equity as a percentage of total assets (equity financing) is statistically significant at 5% significance level and directly related to dividend per share in all four variants of the fixed-effects models. The random effects model also gives the same results. A one-percentage increase in equity financing results in a corresponding increase in dividend per share by rupee 0.09-0.11. This shows that the companies having larger share of equity in their total assets have the propensity to pay dividend more. This is what we have hypothe-sized above.
Firms with comparatively higher portion of equity in the capital structure have likelihood of paying more dividends. This is owing to the fact (ceteris paribus) that their lower financing cost will leave them with more free cash for payout. But this may not stand true if high equity funds are not efficient in their overall operations and suffer to generate funds to make a payout.
Studies by Li and Zhao (2008), Amidu (2007) and Al-Kuwari 2010 reveal that leverage is negatively related to dividends. According to Agrawal and Jayaraman (1994) dividend yields and payout ratios are comparatively higher in all-equity firms, as opposed to companies having more composition of debt in the capital structure.
Profitability of the firm and a better ROE do not automatically justify payout. This is due to the fact profits are retained for supporting growth through internally generated funds; as such this may leave little or nothing for distribution.
Companies may resort to the residual dividend policy and therefore choose to rely on internally generated funds to finance any need for new projects or similar capital expenditure. As a result, payout can only emerge if out of the residual leftover there is a sufficient cash-flow to give a payout. Companies calibrate debt and equity proportions before deciding on payout. As a corollary, firms decide on dividends only if there is enough cash-flow available after attaining expansion and capital expenditure need of the firm. The need to support growth from internally generate funds will take precedence over payout.
Firms having a good ROE may not show good payout track record. This again reflects on The Pecking Order theory which underlines that equity is a less preferred means of raising new capital. When the decision is regarding utilization of funds for growth is concerned, companies will prefer internal financing, debt and then issuing new equity. As such with good ROE, firms resort to internal financing and defer payouts in order to avoid cost of new debt. Firms relatively and comparatively with lower profitability may give a payout as there might be no expansion project and need for plough back and therefore firms can use such free cash-flow for payout.
Firms usually prefer a stable payout as compared to volatile payout. This may be due to clientele theory postulated. Shareholders many a times prefer stable and regular dividends as opposed to volatile payouts. As such an increase in equity will not result in increased payout because firms based on their clientele need to maintain a fixed rupee amount or fixed percentage of profit as a payout. Raghunathan and Dass (1999)’s study shows that top-100 companies in India with over-whelmingly equity base (high net-worth companies) have a stable payout policy. Payout trends as some studies show are industry specific. A study by Michel (1979) and Baker (1988) depicts what they call industry classification and dividend policy. Rozeff (1982) concludes in a study that payout is not industry specific; his study excluded regulated companies like utilities.
All equity firms’, according to Agrawal and Jayaraman (1994), dividend yields and payout ratios are comparatively higher as opposed to companies having more composition of debt in the capital structure.
Bhat and Pandey (1994) are of the view that firms do not necessarily have targeted dividend ratio as their survey finds that management of the firms believes dividend changes are due to increased level of earnings by firm. Also Mohanty (1999)’s paper shows that Indian companies’ payout reflects that companies do maintain constant payout but have fluctuating payout ratio as a result of level of profits.
Profitability (the percentage of sales realized as net income after taxes) in all the variants of the model is statistically insignificant. Also when we added more explanatory variables its impact on dividend per share alters their signs. It seems that managers do not consider this as an important indicator when paying dividend. Payout depends not only on the profitability but also on the need to redeploy profitability for growth of firm and also firm requires free-cash-flow to make a payout. Managers are also aware of signaling impact while they decide to pay higher payouts.
Asset turnover (gross sales as a percentage of total assets) in all the variants of the model is statistically significant at varying range of significance (5-10%). A higher asset turnover (efficiency) does not result in higher payout. Kasim and Rasheed (2014)’s study indicates that Cement and in Power sector payout is influenced by sales, liquidity and profitability.
Firms are very considerate when increasing payout. As this signals to the market that firm growth is discernible and hence the promise of better payout. Koch and Shenoy (1999)’s study demonstrate that there is considerable interaction of capital structure and firm’s dividend policy that lead to provide significant signaling as regard to future free cash-flow of the firm.
A linear relationship of Return on Equity has direct impact on dividend per share in all four variants of the model. Higher return on equity whether taken as before tax or after tax has increased the dividend per share. When the firms have free cash-flow they are likely to reward the shareholder in the form of dividend payout. Hence ROE coupled with adequate cash-flow, with no investment opportunity for deployment of cash-flow should naturally result in payout.
According to Michaely and Swaminathan (2002)’s study, firms increase dividends when they anticipate less desirable investment options. On the other hand Lie (2000)’s findings reveal that firms increase dividends when their cash coffers are fuller than those compared to other firms in the same sector. As such dividend is influenced by free cash-flow of the firm. Profitability has positive impact on cash-flow. In the study of six countries (USA, UK, Canada, Germany, France, Japan) Denis and Osobov (2008) found that size, profitability, and firm maturity, influence the propensity to pay dividends. This is also supported by the studies in case of UK by Benito and Young (2001). Von et al (2008) report similar findings for firms with European Union.
A non-linear relationship (quadratic term) of return on equity is also statistically significant at 5% level of significance. This indicates the increase in return on equity does not have a linear impact on dividend per share at every level. However, the impact on dividend per share diminishes as “return on equity’’ increases.
[1] Due to insufficient number of observations serial correlations and cross-sectional dependence in panel data models were not tested.
CONCLUSION AND LIMITATIONS
Our results show that KSE-30 index firms that have significant portion of financing through equity and those generating effective Return on Equity have high propensity for payout. KSE-30 Index firms, being in the limelight maintiain dividiend payouts to gain investors’ confidence and in the process improve over their market capitlization. Hence they focus on effective utlilization of resources in order to sustain a payout. Companies depending on their growth curve may resort to the residual dividend policy and therefore choose to rely on internally generated funds to finance capital expansion or new projects. As a result, payout can be the residue after meeting the capital need for growth and expansion.
Firms that have surplus operating cash-flow, with no opportunity for use of cash-flow, decide to distribute in the shape of payout.They also consider buy-back of shares, when they have free cash-flow. The buyback of shares results in relatively lower equity and thus earning per share improves and hence as a result also the market capitalization.
Studies have indicated that free-cash flow also impact firm’s ability for a payout. We have not meausred the impact of free-cash flow on payout, due to the reason that State Bank of Pakistan has changed its definition of cash-flow components from the year 2009 and onwards. Our study covers period 2001-2011, as such this change in the components of cash-flow was not taken.
This paper provides an independent study of Pakistan Market (Pakistan is developing economy). We have no found any significant studies in line with the conclusion drawn in this paper. Our study is an extension of work done on impact of capital structure on payout. We have selected KSE-30 index, it underlines a mechanism by which investors can gauge equity market behaviour and outlook; in turn finding out as to how these companies strategize on capital structure, and use their asset efficiently, earn profit, and able to make payouts. Based on SBP as source of data we deemed appropriate to include: Asset turnover (efficiency), profitability, Return on equity and dividend per share as variables.
CONFLICT OF INTERESTS
The authors have not declared any conflict of interests.
REFERENCES
|
Agrawal A, Jayaraman N (1994). "The Dividend Policies of all Equity Firms: A Direct test of Free Cash Flow Theory," Managerial Decision Economics, 15:139-148 |
|
|
|
|
|
Aivazian V, Booth L, Cleary S (2003). Do Emerging Market Firms follow Different Dividend Policies from U.S. Firms? J. Financial Res. 26(3):371-387 |
|
|
|
|
|
Al-Kuwari, D. (2010). To Pay or Not to Pay: Using Emerging Panel Data to Identify Factors Influencing Corporate Dividend Payout Decisions. Intl. Res. J. Fin. Eco. 42:36-54. |
|
|
|
|
|
Amidu M (2007). How Does Dividend Policy Affect Performance of The Firm on Ghana Stock Exchange?. Investment Management and Financial Innovations 4(2):103-112 |
|
|
|
|
|
Anil K, Kapoor S (2008). Determinants of dividend payout ratios: A study of Indian information technology sector. Intl. Res. J. Fin. Eco. 15: 63–71. |
|
|
|
|
|
Atkin M, Glen J (1992). Comparing capital structures around the globe. The International Executive. |
|
|
|
|
|
Azhagaiah R, Priya SN (2008). The impact of dividend policy on shareholders' wealth. Intl. Res. J Fin. Eco. 20:180 – 187. |
|
|
|
|
|
Azhagaiah R, Sabri PN (2008). "The Impact of Dividend Policy on Shareholders Wealth", Intl Res. J. Fin. Eco. 20:180-187 |
|
|
|
|
|
Baker HK (1988). "The Relationship Between Industry Classification and Dividend Policy." Southern Business Review 14: 1-8 |
|
|
|
|
|
Baker HK, Farrelly GE, Edelman RB (1985). A survey of management views on dividend policy. Fin. Managet, 14(3):78-84. |
|
|
|
|
|
Baker M, Jeffrey W (2004). Appearing and disappearing dividends: The link to catering incentives, J. Fin. Eco. 73: 271–288 |
|
|
|
|
|
Baltagi BH (2008). Econometric Analysis of Panel Data, 4th Edition, Wiley |
|
|
|
|
|
Benito A, Young G (2001). 'Hard Times or Great Expectations? Dividend omissions and dividend cuts by UK firms' Bank of England Working Pp.147. |
|
|
|
|
|
Bhat R, Pandey IM (1994). "Dividend Decisions: A Study of Managers' Perception," Decision, 21:1-2. |
|
|
|
|
|
Black F (1976). The Dividend Puzzle. J. Portfolio Management. 2(2):5-8. |
|
|
|
|
|
Boyd J, Smith B (1996). The co-evolution of the real and financial sectors in the growth process, World Bank Eco. Rev. 10:371-396. |
|
|
|
|
|
Boyd JH, Smith BD (1998). The evolution of debt and equity markets in economic development. Economic Theory 12: 519-560. |
|
|
|
|
|
DeAngelo H, DeAngelo L, Stulz R (2006). "Dividend Policy and the Earned/Contributed Capital Mix: A Test of the Lifecycle Theory", J. Fin. Eco. 81:227-254. |
|
|
|
|
|
Denis DJ, Igor O (2008). "Why Do Firms Pay Dividends? International Evidence on the Determinants of Dividend Policy" J. Fin. Eco. 89(1):68-82. |
|
|
|
|
|
Faccio M, Lang L, Young L (2001). Dividend and Expropriation. Ame. Eco. Rev. 91(1):54-78. |
|
|
|
|
|
Foong SS, Zakaria NB, Tan HB. (2007). Firm Performance and Dividend-Related Factors: The Case of Malaysia, Labuan Bulletin of International Business & Finance. 5:97-111 |
|
|
|
|
|
Graham JR, Harvey CR, (2001). The theory and practice of corporate finance: evidence from the field. J. Fin. Eco. 60:187–243. |
|
|
|
|
|
Green W (2008). Econometric Analysis. Prentice Hall. Sixth edition. |
|
|
|
|
|
Grullon GR, Michaely B, Swaminathan (2002). "Are Dividend Changes a Sign of Firm Maturity?" J. Bus. 75: 387-424. |
|
|
|
|
|
Grullon G, Michaely R, Swaminathan B (2002). Are dividend changes a sign of firm maturity? J. Bus. 75: 387–424 |
|
|
|
|
|
Gul PA, Kealey BT (1999). Chaebol, Investment Opportunity Set and Corporate Debt and Dividend Policies of Korean Companies. Review of Quantitative Finance and Accounting, 13(4):401-416. |
|
|
|
|
|
Gul PA, Kealey BT (1999). Chaebol, Investment Opportunity Set and Corporate Debt and Dividend Policies of Korean Companies. Rev. Quantitative Fin. Acc. 13(4):401-416. |
|
|
|
|
|
Hamidullah FA (2012). The Impact of Ownership Structure on Dividend Policy Evidence from Emerging Markets KSE-100 Index Pak. Int. J. Bus. Soc. Sci. 3 (9):298. |
|
|
|
|
|
Hovakimian AT, Opler S, Titman S (2001).The debt-equity choice, J. of Fin. Quantitative Analysis 36:1-24. |
|
|
|
|
|
Hu Y, Wang D, Zhang S (2007). Founding Family Ownership, Management, and Payout Policy. Intl. Rev. Bus. Res. 3(2):49 -98. |
|
|
|
|
|
Jalillv A, Harris RS (1984). Corporate Behavior in Adjusting to Capital Structure and Dividend Targets: An Econometric Study. J. Fin. 39(1):127-145. |
|
|
|
|
|
Kalay A (1982). "Stockholder-Bondholder Conflict and Dividend Constraint. J. Fin. Eco. 10(2): 211-233. |
|
|
|
|
|
Kasim AJ, Rasheed MA (2014). Determinants of Dividend Payout in Power and Cement Sectors, Pakistan Bus. Rev. 15(4):640-668. |
|
|
|
|
|
Kim W, Sorensen E (1986). Evidence on the Impact of Agency Costs of Debt on Corporate Debt Policy. J. Fin. Quantitative Anal. 21(2):131-144. |
|
|
|
|
|
Koch PD, Catherine S (1999). "The Information Content of Dividend and Capital Structure Policies," Finan. Manage. 28(4):16-35. |
|
|
|
|
|
Li K, Xinlei Z (2008). Asymmetric Information and Dividend Policy, Financial Management, 37(4): 673-694. |
|
|
|
|
|
Lie E (2000). "Excess Funds and Agency Problems: An Empirical Study of Incremental Cash Disbursements," Rev. Financial Stud. 13:219-248. |
|
|
|
|
|
Mahadwartha PA (2003). Predictability Power of Dividend Policy and Leverage Policy to Managerial Ownership in Indonesia: an Agency Theory Perspective. Jurnal Ekonomi dan Bisnis Indonesia 18(3):1-20. |
|
|
|
|
|
Marsh P (1982). "The Choice Between Equity and Debt: An Empirical Study", J. Finance 37:121-144. |
|
|
|
|
|
Michel A (1979). "Industry Influence on Dividend Policy." Financial Management 8: 22-26. |
|
|
|
|
|
Mizuno M (2007). Payout policy of Japanese firms: analysis on the survey of four industries listed on the Tokyo Stock Exchange. Pacific Eco. Rev. 12(5):631 – 650 |
|
|
|
|
|
Mohanty P (1999). "Dividend and Bonus Policies of Indian companies: An Analysis," Vikalpa, 24(4): 35-42. |
|
|
|
|
|
Mundlak Y (1978). On the pooling of time series and cross-section data, Econometrica 46:69-85. |
|
|
|
|
|
Pagano M (1993). The flotation of companies on the stock market: A coordination failure model, Eur. Eco. Rev. 37:1101-1125. |
|
|
|
|
|
Pandey IM (2005). "Financial Management" 9th Edition, Vikas Publishing House Pvt. Ltd |
|
|
|
|
|
Raghunathan V, Prabina D (1999). "Corporate Performance: Post Liberalization," ICFAI J. Appl. Fin. 5(2): 6-31. |
|
|
|
|
|
Ramamurti R, Vernon R (1991). Privatization and control of state-owned enterprises, Economic Development Institute of The World Bank. (Washington D.C.) |
|
|
|
|
|
Rozeff M (1982). "Growth, Beta and agency Costa as Determinants of Dividend Payout Rations", J. Fin. Res. 5:249-259. |
|
|
|
|
|
Smith CW, Jerold BW (1979). "On Financial Contracting: An Analysis of Bond Covenants. "J. Fin. Eco. 7(2):117-161 |
|
|
|
|
|
Tong G, Green CJ (2005). Pecking Order or Trade-off Hypothesis? Evidence on the Capital Structure of Chinese Companies. Appl. Eco. 37(19):2179-2189 |
|
|
|
|
|
Von E, Henk J, William LM (2008). "Dividends and Share Repurchases in the European Union. "J. Fin. Eco. 89(2):347-374 |
|
|
|
|
|
Welch I (2004). "Capital Structure and Stock Returns," J. Pol. Eco. 112:106-131. |
|
|
|
|
|
Yasser QR, Entebang H, Mansoor SA (2011). Corporate governance and firm performance in Pakistan: The case of Karachi Stock Exchange (KSE)-30, J. Eco. Intl. Fin. 3(8):482-491. |
|
Copyright © 2024 Author(s) retain the copyright of this article.
This article is published under the terms of the Creative Commons Attribution License 4.0


