Maintaining the good quality of current products or services cannot anymore guarantee companies’ survival in today’s super competitive global market in which the competition gets only tougher and more challenging day in, day out. In fact, firms’ prosperity is highly dependent on the successful and timely introduction of new products and services that go beyond customers’ expectations in many aspects including quality and features. Even though the literature has highlighted the importance of new product development (NPD), the failure rate of successful completion of NPD projects suggests further exploration on the subject. This study, reviews what is already unearthed by the literature, and aims to find what is lacking for which further steps should be taken. In particular, the study tries to classify factors and aspects that are needed to be considered when assessing an NPD project. It also reveals that universal approaches deemed to be helpful in the successful implementation of NPD projects which have not statistically shown improvement in the success rate of NPD projects.
New product development process takes an already existing need or a conceptual need that can be arisen in the future and transforms it into a presentable product or service which is perceived to satisfy that need (Johnson and Kirchain, 2011).
In many instances, the need is created by marketing efforts. For instance, no one would even perceive a smart watch as a need even just a few years before it was introduced into the market. In some other instances, the need will arise in the future due to regulatory changes. For instance, regulations regarding the air pollutants get tighter and tighter as time goes which urges auto manufacturers to come up with new products that comply with the air pollutant regulations.
New Product Development (NPD) activities involve various functions of the company, including product definition all the way through pre-series and series production (Suss et al., 2011). Proper NPD can go a
long way, and significantly contribute to organizations' survival and growth in the rapidly changing market. According to Wolfe (2013, 2014), manufacturing firms spend billions of dollars each year to keep their research and development (R&D) activities going forward.
Several research studies performed by the Product Development Management Association (PDMA) have shown that new products have noticeable share in sales and profits of companies (28% for sales and 33% for profit) (Barczak et al., 2009). Other sets of study conducted by PDMA show that NPD activities have an average failure rate of 40% (Markham and Lee, 2013). The majority of the companies participated in the studies were PDMA practitioner members were categorized as manufacturers of large products (more than 50%). The results are comparable with other studies conducted by other institutions such as American Productivity and Quality Center (APAQ) and Product Development Institute (Cooper and Edgett, 2012).
Results from those studies which are aligned with data coming from economic studies would emphasize the necessity and importance of successful NPD for businesses. However, the high NPD failure rate as presented in PMDA, APQC, and PDI studies shows how difficult it is for companies to complete an NPD journey successfully (Barczak et al., 2009; Cooper and Edgett, 2012; Markham and Lee, 2013).
Closer look at the subject reveals that while there is an abundance of material in the literature suggesting what to do, there is a lack of an evaluation tool to identify whether or not a given NPD project is on the right track. Using best practices mentioned in the literature, this study attempts to put together pieces required for such an evaluation tool that can help NPD project managers improve the performance of their NPD process.
According to Atilgan-Inan et al. (2010) even though an NPD is recognized asa risk-reward effort, and an unsuccessful NPD can lead to a significant adverse impact on firms' future profitability, the potential for a new and large profit stream generated by launching a new product or offering a new service makes it necessary to conduct more research and deeper explorations to learn how to further improve the NPD process.
The considerable amount of academic work on NPD practices were analyze according to the studies of Balaban et al. (2011), Barczak et al. (2009), Barczak and Kahn (2012), Carter (2015), Cooper and Edgett (2012), Cooper et al. (2004), Cooper and Kleinschmidt (2007), Kahn et al. (2012) and Kahn et al. (2006), and the significant negative effect of a failed or poorly delivered NPD augment the NPD's value as a business process. Many elements throughout the NPD process may contribute to failure or success of it. Due to challenges happening along the way, NPD completion date might get postponed, more resources might be consumed than what originally was planned and more money might be spent than budget. According to Afonso et al. (2008) and Lee and Wong (2010), when it comes to a successful NPD process, efficiency, time-to-market, and the overall cost of marketed product are considered as key competitive advantages.
One of the notable challenges companies experience during their NPD is time-to-launch pressure (Carter 2015). Attention is drawn to finding ways to accelerate developing new products with no compromise in specifications and budget (Langerak et al., 2008). NPD early delivery time has a favorable effect on the overall completion cost. Thus, according to Suss et al. (2011) it should be regarded as a measure of success when assessing an NPD process.
They also mention that about 70% of product's cost during its lifecycle can be attributed to the development phase. Langerak et al. (2008) conducted research to explore the relationship between product cycle time, market entry timing, and the effect of these factors on the profitability of the new product. They used a survey containing info of 72 manufacturing companies from the Netherlands. They concluded that there may be an “optimum cycle time that maximizes new product profitability” (Langerak et al., 2008).
Another research was conducted by Rodriguez-Pinto et al. (2008). The concentration was on understanding the dynamics between market entry timing and management implications for resourcing. They conclude that early market entry “does not automatically ensure a strong market position or high profitability, but it may influence performance through positioning, scope and satisfaction” (Rodriguez-Pinto et al. 2008). There seems to be some similarities between these conclusions with Langerak et al. (2008) saying that entering too early or too late in the market might not be favorable while a specific timing for market entry may be ideal. Even though there is no unique answer to identify if it is better to enter the market earlier or later, the market entry timing has a definite effect on the profitability thus is a practical success measure when assessing an NPD process.
The significance of NPD as a contributing factor to organizational success is supported by other literatures (Carter, 2015; Cooper et al., 2004; Kahn et al. 2012; Kahn et al., 2006). Research also shows that maintaining a successful record of project delivery for long- term business prosperity is hard to achieve (Driva et al., 2000; Rodriguez-Pinto et al., 2008).
According to Wolfe (2013, 2014) billions of dollars in the US are spent by manufacturing companies to support their research and development (R&D) activities. Therefore, failure in such activities would incur a lot of cost.
Even though best practices on this subject are provided in the literature, the average success rate for NPD performance is still far too low (Carter, 2015). Best performers tend to apply best practices during their NPD process which have resulted in near 82% of success rate in NPD whereas average performers have a record of close to 61% when it comes to a successful NPD outcome (Barczak et al., 2009; Cooper and Edgett, 2012; Markham and Lee, 2013). Companies can adopt and effectively use NPD best practices to achieve higher NPD process success rate. However, there should be an assessment activity to identify issues as well as improvement opportunities to ensure companies are not going through the same cycle of low NPD process performance (Carter, 2015).
Due to differences in the nature of companies when it comes to operations and orientations, using a unique set of NPD best practices will not consistently result in higher success rates (Panizzolo et al., 2010).
Thus, in order to get better results, it is inevitable to regard those differences and specialties while applying best practices. The argument put forth by Panizzolo et al. (2010) points out to the reason why companies still continue with low NPD success rates while studying of the best practices have been the area of focus for quite a while, and have been shown to increase NPD performance. Possibly, companies should consider and apply best practices to improve their NPD process. However, while adopting those practices they ought to internalize them in a way that takes into account their specific orientations and differences (Barczak et al., 2009; Cooper and Edgett, 2012; Markham and Lee, 2013).
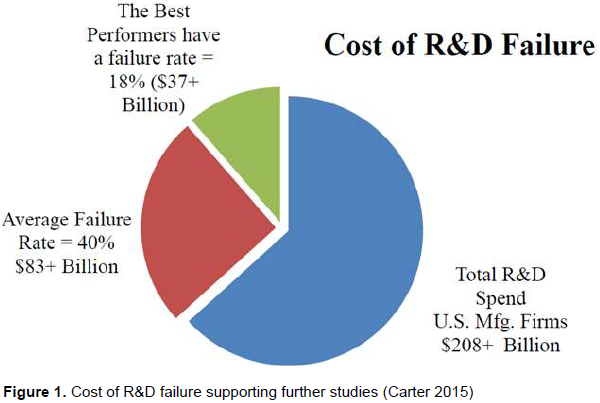
According to Barczak et al. (2009) and Markham and Lee (2013), there is a direct relationship between enhanced NPD performance and increased use of NPD practices. Company economics and NPD performance are linked. Figure 1 provides a pie chart supporting a best practice approach to NPD from an economic standpoint (Carter 2015).
According to Wolfe (2013) and (2014) companies have spent billions of dollars during 2008 and 2011 on their R&D activities. It is estimated that the best performers have NPD processes failure rate of 18% which makes a total of around $37 billion. It is also estimated that the average failure rate is 40% which translates to about $83 billion.
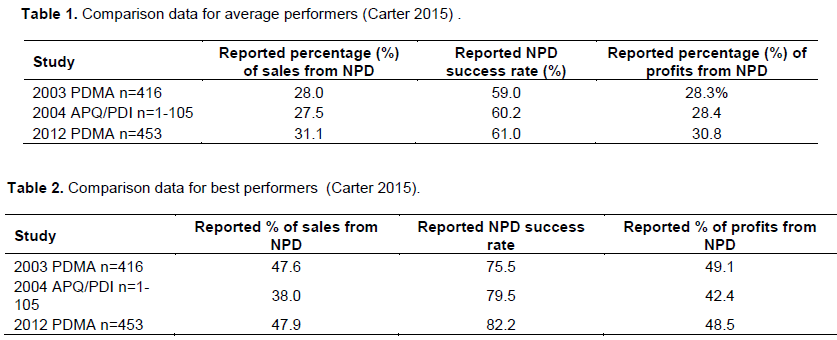
Conclusions from several studies give us the approximate average number of 29% as the share of new products in companies sales revenue, and approximately same number as the profit generated from new products (Barczak et al., 2009; Cooper and Edgett, 2012). A simple comparison between mediocre performers versus top performers depicts the significant effect of NPD process performance on companies’ financials and overall performance (Figure 1 and Tables 1, 2).

Data in Tables 1 and 2 provides comparison between best performers and average performers over a time period. Data comes from three different studies two of which were conducted by PDMA, and one was conducted by APQC/PDI. Data from all three studies provides consistent and rather similar insight regarding average versus best performers over time (Carter, 2015).
As shown in Tables 1 and 2, numbers for best performers are much better than those for average performers. Sales revenue generated by new products makes about 47% of total sale for best performers. Also, as high as 49% of best performers' profit comes from new products (Barczak et al., 2009; Cooper and Edgett, 2012) (Table2).
As shown in Figure 1 there is an approximate difference of $46 billion in NPD costs between best performers and average performers. The financial burdens of failing in NPD projects justifies why the NPD process has been vastly the subject of research. According to Cooper and Edgett (2012), Cooper et al. (2004) and Markham and Lee, 2013), 50% or more of the best NPD performers use NPD best practices.
Studies have been conducted to classify NPD practices to determine the effectiveness of each class, identifying best versus poor practices, and creating an assessment template based on the best practices (Barczak and Kahn, 2012; Cooper and Edgett, 2012; Kahn Barczak, & Moss, 2006; Kahn Barczak, Nicholas, Ledwith, & Perks 2012; Markham and Lee, 2013; Nicholas Ledwith, & Perks, 2011).
Providing the opportunity to transform literature content on NPD into a useful assessment tool for industrial practitioners is the essence and the main purpose of this study. Even though a noticeable amount of studies have been conducted on the subject, the undesirable failure rate implies that there is much more to be investigated hence more opportunities to enhance NPD performance still exist.
Since an organization as a system is a combination of interdependent subsystems, slight changes on one subsystem can affect other subsystems. Therefore, process change for improvement must consider the interaction between subsystems. Based on
Rummler and Brache (1995) organizational performance improvement theory, there are three performance levels in every system: organizational, process, and job level performances. Focus of the organizational level is on the dynamics of the organization, and its market. It has a top-down impact on performance via strategies, goals, and structures associated with the whole organization.
Organizational level is considered as the skeleton for the major functions that exist within an organization (Rummler and Brache, 1995). The process view gives a perspective of how and why tasks get done within different functions of the organization. Focus of the process level is on the functional work processes. According to Rummler (1995) organizational performance improvement theory, the key element of this study is the process level as it provides the most impactful leverage and the best opportunity for effective change within the organization.
It is worth noting that according to Barczak et al. (2009) "no one best way" can be used to get the most effective results out of reorganized NPD activities. However, there are poor practices that companies should avoid. Besides, there should be an audit for identifying improvement directions in order to achieve best practice.
According to Panizzolo et al. (2010), sticking to one best practice as a universal approach does not work as it does not take into account unique orientations each company might have. All companies are not 100% analogous in their structure and direction, etc. Thus, it is not a realistic expectation to have one universal model that leads all companies to get the desired results. Panizzolo et al. (2010) worked on developing a prototype assessment tool for the NPD process. The tool includes a normative-contingency approach which considers the orientation of companies based on logic of coherence. Nevertheless, the authors admit about some limiting factors of the model related to the "number of organizational resources required to be involved, and the number of interactions dependent upon size and complexity of the firm (Carter, 2015).
During the implementation phase, struggles were experienced as management did not have enough motivation to regard interaction related conflicts. Based on the model provided by the Malcolm Baldrige National Quality Award (MBNQA) “leadership drives the system that causes results” (Wilson and Collier 2000),
same model claims that system development is also driven by leadership. Since one of the topics that are
identified in the MBNQA model is process management, it is believed that this study can potentially contribute to this topic. The reason for it is that the study provides tools and guidance for companies to make improvement in their NPD process which is one of their crucial processes.
In short, successful NPD process improves financial measures of success for manufacturing companies. Large amount of studies have been conducted on NPD best practices topic (Carter, 2015; Cooper and Edgett, 2012; Cooper et al., 2004; Edgett 2011; Markham and Lee 2013; Wolfe 2014). Results of those studies confirm the positive correlation between using best practices and improved success rate of NPD projects (Carter 2015)
. Best practices are utilized more frequently by top performers, and their success rates are better than those that do not utilize them in their NPD process. Another factor that is identified to be linked to improved NPD performance is using appropriate techniques and tools (Carter 2015)
.
However, ineffective utilization of tools and techniques continues to result in average NPD success rates which are too low to be desirable. Assessing the NPD process is helpful in pinpointing areas of weakness thus provides opportunities for improvements. Assessing the NPD process enables practitioners to identify those best practices, techniques, and tools that have not been utilized yet. The idea is that companies who perform assessment on their current NPD process and use best practices from academic literature to identify the gaps are able to utilize the acquired insight to make improvements in their NPD process performance.
Even though there might not be a "one unique approach" to adopt and implement best practices that is applicable by all companies, practitioners may be able to utilize proper best practices, techniques, and tools while considering company's specific orientations to achieve improved NPD project success rate. In order to actualize such improvement, a best practice-based tool to assess the NPD process is needed. The tool not only should encompass useful tools, techniques, and concepts from best practices, it also should provide guidance on how to implement it while taking into account companies' specific orientations.
Based on assessment results, guidance should provide clear answer on what best practices, tools, and techniques that are recommended to be used, and also how to effectively incorporate them into NPD processes to improve the current performance and get higher NPD success rate. Hence, as the basis to develop a new NPD assessment tools a pro-best practice approach was taken.
Theoretical framework
This study uses best practices found in the literature to identify, categorize, and rank the areas, and factors
that have effect on the successful implementation of an NPD projects. An NPD process assessment tool can then be developed based upon such identification, categorization, and ranking.
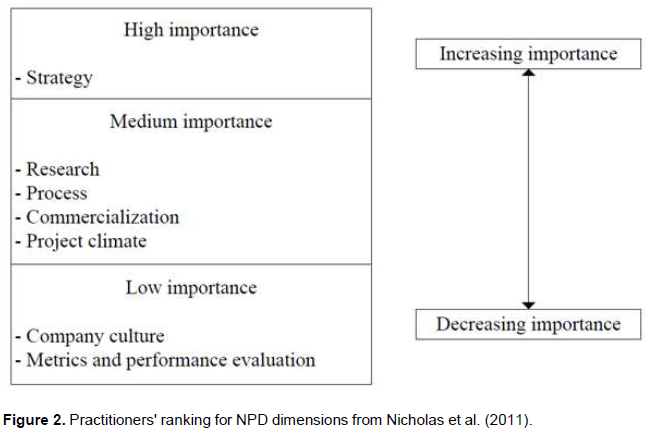
NPD best practices are grouped based on the different areas of the NPD process that they can be effectively utilized. According to the literature seven areas, also known as dimensions, can be attributed to the NPD process (Carter, 2015). Nicholas et al. (2011) conducted a study to evaluate the importance if each dimension. They collected data from surveys completed by students from the University of Limerick in a Master of Technology program. Those students were sponsored by PDMA member companies in the United Kingdom and Ireland. The study concludes that out of the seven NPD dimensions, strategy has the highest perceived importance. The medium importance category includes research, process, commercialization and project climate. The low importance category encompasses company culture, metrics and performance evaluation. Such classification might be helpful when prioritizing NPD improvement activities given the limited resources. Figure 2 provides the summary of the seven NPD dimensions in terms of importance.

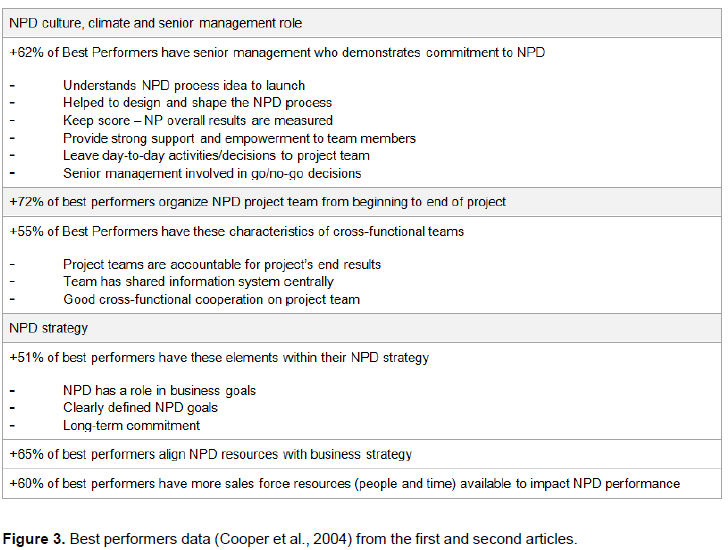
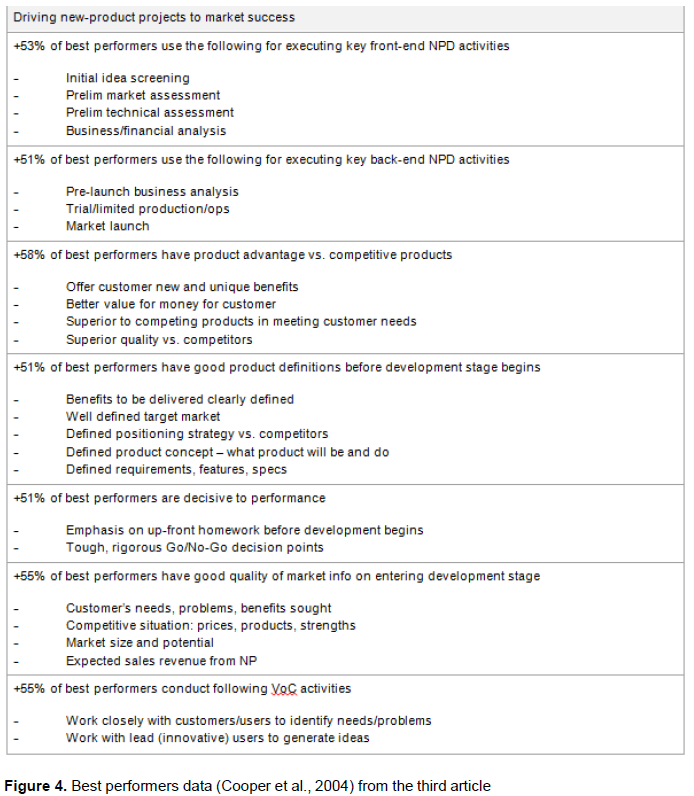
Another focus in the NPD process literature has been best practices benchmarking. Cooper et al. (2004) study results were published in a sequence of three articles. While not being a current reference, their study is considered as one the studies that strongly support the idea of using comprehensive best practice approach for NPD projects (Carter, 2015).
Their first article addresses topics of culture, teams, and senior management as related to NPD process. Their second article concentrates on the topics of strategy, resource allocation and portfolio management. The last article in the series focuses on the NPD process elements to and how they help drive projects into the market. Authors explored measures of performance and emphasized applying and consistently implementing the NPD process as a crucial effort to achieve success in NPD process. The collected data is a combination of quantitative data from 105 companies that were member of APQC along with qualitative site visits of five companies. Figure 3 and 4 provides a summary of the best practices, and categories that the majority of best performers have utilized while the minorities of others (average and worst performers) have not been utilized (Cooper et al., 2004).


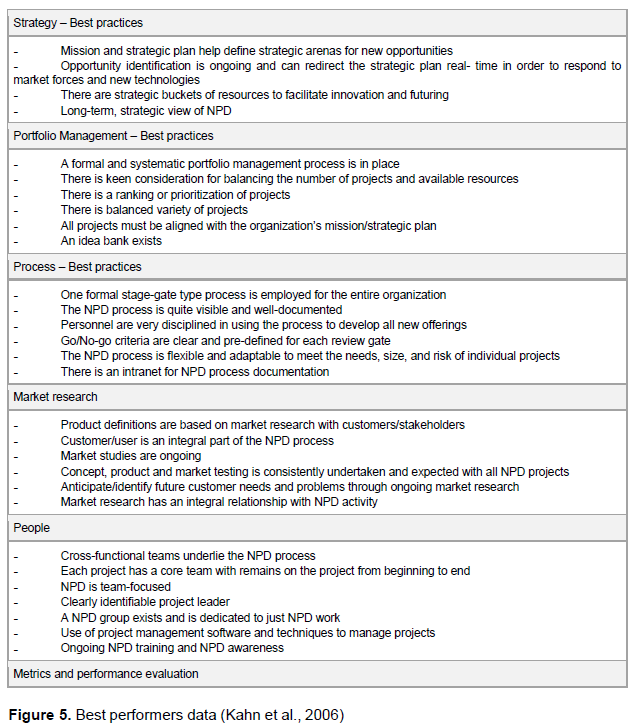
Kahn et al. (2006) developed a framework for NPD best practices based on benchmarking studies. Their proposed framework consists of 4 levels and six aspects. The four levels are defined as:
1. Poor practice
2. Was better practice
3. Was good practice
4. Best practice.
A list of characteristics is attributed to each level to identify the performance level. The six aspects are explained as
1. Strategy
2. Portfolio management
3. Process
4. Market research
5. People
6. Metrics and performance evaluation.
Based upon these six aspects, they also proposed six themes for NPD best practices as
1. Instill a strategic, long-term orientation toward NPD2. Have a formal portfolio management process
3. Implement a formal NPD process supported by a discipline to adhere to this process
4. Conduct market research proactively
5. Use cross- functional teams
6. Utilize standardized criteria and metrics” (Kahn et al., 2006).
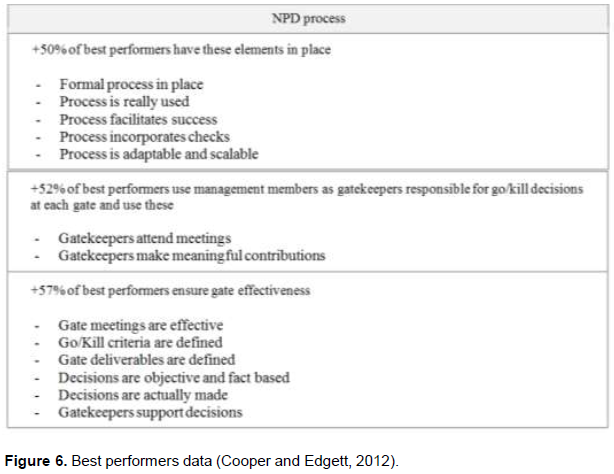
Figure 5 provides a summary of best practices data (level 4) as applies to the six aspects mentioned in the study. Cooper and Edgett (2012) used data from 211 APQC member companies to explore the common practices used by the best performers. They reported that 90% of companies that were categorized as the best performers had a formal NPD process in place. To collect data, a structured questionnaire was given to different positions related to NPD projects ranging from executives to process managers.
In order to categorize a company as “best performer” the study directed an analysis considering these areas:
NPD productivity, sales objectives, and profit objectives. Using the results of the questionnaires, the study identified the best performers and used site visits for deeper explorations into specific best practices. Figure 6 provides a summary of the study on the practices that more than 50% of the top performs utilized while less than 50% of the non-top performers utilized the same practices (Cooper and Edgett, 2012) (Figure 6).

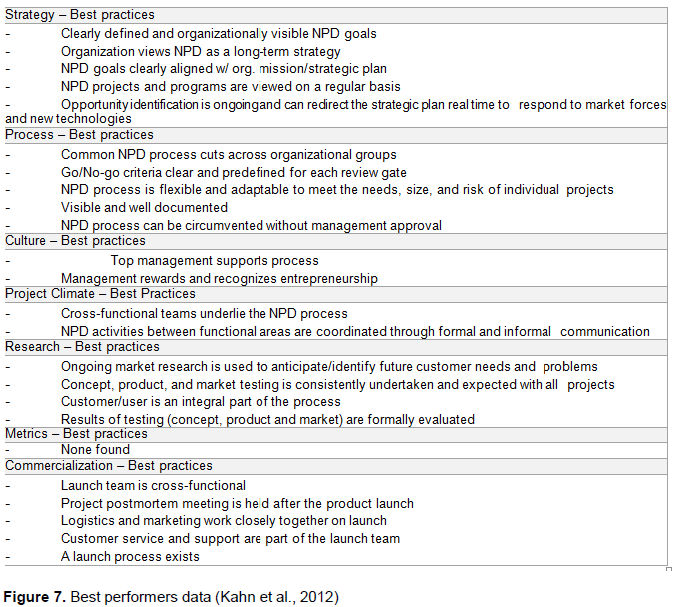
Using surveys from companies in the United States, United Kingdom, and Ireland Kahn et al. (2012) collected data to explore managers’ views as relates to NPD best practices. 163 responses form U.S companies as well as 144 responses from UK/Ireland companies formed the data of the study. A Delphi methodology was used to gather the qualitative data to explore the probable NPD dimensions and also to validate the initial NPD framework proposed by (Kahn et al., 2006). Surveys were used to measure managers’ perceptions regarding the importance of different NPD dimensions, and the level of practice maturity the NPD characteristics would signify. Kahn et al. (2012) concluded that there are some practices categorized as best practices that are recommended to be followed, and some as poor practices that should be avoided. Figure 7 provides a summary of best practices study conducted by Kahn et al. (2012).

Barczak and Kahn (2012) conducted a study to identify best versus poor NPD practices as relates to seven specified aspects. They developed a framework and an audit tool using data collected from a previous benchmarking study, a Delphi methodology and a survey from 300 practitioners. The audit tool was meant to allow practitioners answer questions related to the seven aspects. It was suggested that the audit be conducted by a cross-functional team from the same company. As for each question, three possible answers were assigned as “No”, “Possibly”, and “Yes”. To determine this, the NPD effort scores were calculated based on the total sum of attributed value to each answer. Positive scores indicate positive NPD effort whereas negative score indicate negative NPD effort. Scores equal to zero or near zero indicate marginal NPD effort. Interestingly, according to Carter (2015), practitioners had better idea on what they would consider as poor practice, and what was believed to be a best practice. Figure 8 provides a Barczak and Kahn (2012) conducted a study to identify best versus poor NPD practices as relates to seven specified aspects. They developed a framework and an audit tool using data collected from a previous benchmarking study, a Delphi methodology and a survey from 300 practitioners. The audit tool was meant to allow practitioners answer questions related to the seven aspects. It was suggested that the audit be conducted by a cross-functional team from the same company. As for each question, three possible answers were assigned as “No”, “Possibly”, and “Yes”.
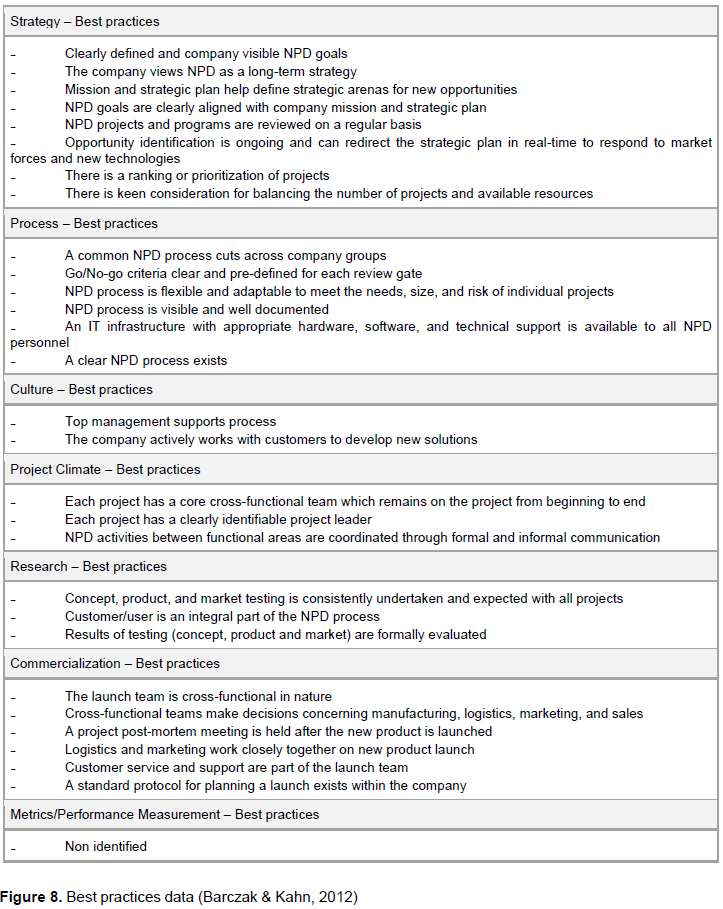
To determine this, the NPD effort scores were calculated based on the total sum of attributed value to each answer. Positive scores indicate positive NPD effort whereas negative scores indicate negative NPD effort. Scores equal to zero or near zero indicate marginal NPD effort. Interestingly, according to Carter (2015), practitioners had better idea on what they would consider as poor practice, and what was believed to be a best practice. Figure 8 provides a summary of NPD best practices (Barczak and Kahn, 2012).
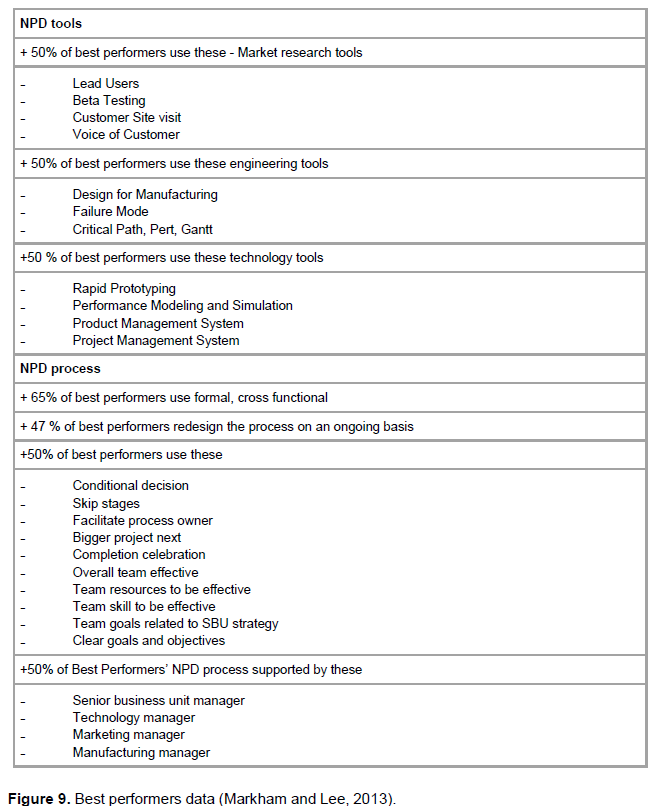
Building on previous assessments on the PDMA members data, Markham and Lee (2013) put together an NPD best practices report. It was the first study related to PDMA using global sample.
According to Markham and Lee (2013) “all the data for this study were collected electronically”. Surveys from 453 PDMA member firms were used to form the data. The analysis provides best practices for NPD tools and process by listing those practices that were used by more than half of the best performers while less than half of the rest (average and poor performers) applied those practices. Figure 9 provides a summary of NPD tools and process best practices data studied by Markham and Lee (2013).
Kuen and Zailani (2012) conducted a study on critical successful NPD factors. They distributed surveys to 72 respondents from Malaysian companies. Using regression analysis they concluded that “project personnel competency and project mission are critical factors influencing the direct NPD project success and as top management support, and project mission are two main critical factors for indirect NPD project success” (Kuen and Zailani, 2012).
According to Carter (2015), results of Kuen and Zailani (2012) study shows that those three factors (top management support, clear project mission and team competency) that had been identified years before their study continued to be grave in achieving successful project implementation in the manufacturing sector.
In order to maintain and improve their competitive positioning, manufacturing companies vastly count on the performance of their NPD process. They also rely on the financial benefits of their NPD projects given the new streams of sales, and profits they can provide.
However, companies need to improve the way they perform when it comes to realizing new products and introducing them to the market. Failure in such efforts has considerable negative effects on companies’ financial records. Although NPD best practices, effective tools and techniques have been identified in the literature, the average percentage of NPD failure rate is still high.
According to Markham and Lee (2013) and Yeh et al. (2010) there is evidence that NPD project success rate can be improved by utilizing effective tools, techniques, and best practices in the NPD process. Different theories have tried to explain why companies keep yielding low success rates when implementing NPD projects. Some theories highlight the fact that there should be a contingency approach when it comes to choosing and implementing best practices according to companies’ specific orientation (Panizzolo et al., 2010).
Some other theories note that currently recognized as NPD best practices are not being fully utilized by management. The notion is that a better job should be done in making best practice knowledge and research widely, and effectively utilized (Kahn et al., 2012).
It is noteworthy that there is agreement between different views that NPD process assessment is a key to identify and potentially improve the process. Using literature, this study provided different categories an NPD assessment tool should take into account to evaluate an NPD process performance.
Further studies are needed to apply a well-developed tool based on the suggested categories from this study in a real world, and quantify the results. The goal would be to identify whether or not they perceive the tool to be valuable.