This study aims to evaluate the contribution of the African capital markets in the diversification of investment global portfolios. The study used the methodology based on the application of optimization models like mean variance (MV), resample michaud (RM), semi variance (SV), mean absolute deviation (MAD), and filtered historical simulation (FHS). In-sample and out-of-sample approaches were used to analyze the data. The study results suggested the existence of a strong correlation between some African capital markets and global capital markets, that is, they tend to move in the same direction. The most important being the diversification of global portfolio with assets of African capital markets generate benefits for both types of investors, risk averse and taker investors; that is, it provides benefits in the return and reduce investment risk. Still, the study results suggested that the foreign investors should look for African capital markets with a chance to maximize their wealth and diversify the investment risk in their portfolios. In the same order, the study result went further to elaborate on the advantages of the international diversification and furthermore contributes to the literature through application of the FHS method in the optimization portfolio. This methodology in addition to producing good results, is more restrained in the composition of investment portfolios than the other methods.
Globalization phenomenon has provided funds transfers between financial markets, with special attention given to the capital markets through the investor, and fund managers that are seeking to invest in order to maximize wealth. However, there are financiers that are willing to invest their assets in both domestic and international markets. This is done in order to minimize possible loss in the case of adverse events occurring in the domestic region that can negatively influence the expected result of their investments. The investors use diversification strategies to minimize risk and maximize return of portfolios in order to protect their investments. Thus, this study attempts to tackle the issues of diversification in the international context, considering the fact that global investors hold domestic portfolios where
through diversification strategy, they include the African assets in their portfolios in order to reduce the exposure of risk and maximize the return. This study aims to identify how the African capital markets will contribute in the diversification risk of the investment global portfolios. Moreover, it compares capital markets to the level of dependency and exposure with respect to events that occur in these large markets.
Based on the weekly data collected from the main Europe and Africa markets and the methodology used, and in particular the application of the optimization models (mean variance, resample Michaud, semivariance, mean absolute deviation, and filtered historical simulation), with both in-sample and out-of-sample approaches, the study results suggest that African markets have a significant relationship with some of the world markets included in the study. The diversification of global portfolios with African assets generates benefits for the investor, that is, provides benefits in return and reduces investment risk for both types of investors. The study contribution to the literature is to test empirically the application of the filtered historical simulation (FHS) methodology in the portfolio optimization and contributes to the discussion on advantage of international diversification context. FHS methodology in addition of producing good results, reveals being more cautious in the constitution of investment portfolios than the other methods. However, this model presents lesser returns and higher risk than other models, however their results follow the trend of the other models.
Several studies have shown that diversification in the international context is an advantage for investors holding composite portfolios with domestic and foreign securities. According to Mansourfar et al. (2010) and Dimitriou and Kenourgios (2012), the arguement that diversification of the international portfolio has been a feature of the global capital market and potential benefits encourage the investors to diversify their investments. According to them, these benefits came from the fact that prices of international assets are less correlated and are derived from different fundamental economic factors. In addition, they point out the benefits of international diversification the investor’s bets in the emerging markets and consequently have huge gains in the short term. According to Baele and Inghelbrecht (2009) and Chiou (2009) based on strong empirical support, potential gains from international diversification are still sufficient to justify a global asset allocation strategy rather than industry/regional or local diversification.
Flavin and Panopoulou (2009) argue that diversification in the international context has long been advocated as an effective way to achieve a higher adjusted return on the investment risk in the domestic market, that is, facilitates risk sharing. Rezayat and Yavas (2006) examined short-term co-movements between the five major stock markets (USA, UK, France, Germany and Japan) to assess the benefits of International Portfolio Diversification (IPD) and concluded that despite the fact that there is still room for diversification, the benefits are minimal for American and European investors who would like to invest exclusively in these two major economic blocs (Europe and America).
Laopodis (2005) argued that analysts is of the opininon that financial integration among global capital markets has reduced IPD's benefits by increasing the correlation between equity markets. Coeurdacier and Guibaud (2011) argue that both theories and empirical evidence suggest that financial integration between countries has a positive impact on the correlation between equity markets, which tends to reduce IPD's benefits. The economic gains from international equity diversification are still substantial despite the growing markets correlation (Bouslama and Ouda, 2014). The major focus of studies on IPD is focused on the portfolios of American, European and Asian investors which fixated on their diversification directed primarily at the assets of European and Asian capital markets, such as the studies of Odier and Solnik (1993) on a global investment where they found that it was profitable for Japanese, British, German and American investors.
Liljeblom et al. (1997) investigated the benefits of IPD from the point of view of Nordic investors; Ho et al. (1999) reported that reducing the risk of loss through IPD would be of substantial benefit to Canadian investors; Rowland and Tesar (2004) and Gerke et al. (2005) also examined the potential benefits of IPD from the perspective of the German investor; Dunis and Shannon (2005) who examined stock markets in Southeast Asia (Malaysia, Philippines and Indonesia) and Central Asia (China, Belize, Taiwan and India), found that IDP would be beneficial to investors in the USA; Kearney and Poti (2006) used two conditional and unconditional estimation methods and analyzed the dynamics of correlation in five leading European capital markets, and Égert and Kocenda (2007) analyzed the issue between Eastern European stock markets and Central Bank ,where they stated that there is no long-term bond between stock markets between these two blocs.
Therefore, on the question of the International Portfolio Diversification in the African context, there are practically no studies done, except for the few references that however, did not have a great impact on the African capital markets.
The studies of Hassan et al. (2003), Bailey et al. (2005), Lagoarde-Segot and Lucey (2007), Yu and Hassan (2008) and Mansourfar et al. (2010) on the stock markets in the Middle East and North Africa countries (MENA), concluded that there are many benefits to the portfolio diversification with titles of these regions which are both in dollars and local currency. However, it was argued that these undervalued and under-investigated emerging markets could attract more value for portfolios in the future. According to Mansourfar et al. (2010), in the past years emerging equity markets have been subject of a large body of studies on international finance. Therefore, it makes sense to look at this issue as being relevant in the context of the financial markets and the major economic blocks, particularly for Africa given the dynamism of their capital markets combined with economic growth in recent years and due to the financial crisis, and confidence in other great world capital markets.
Data
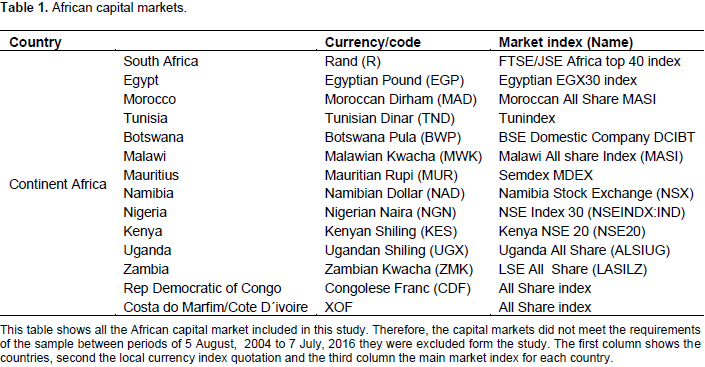
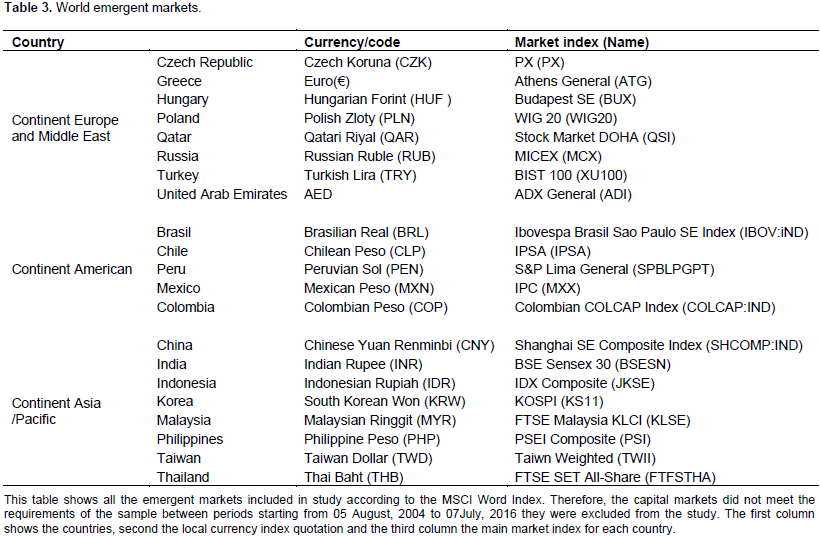
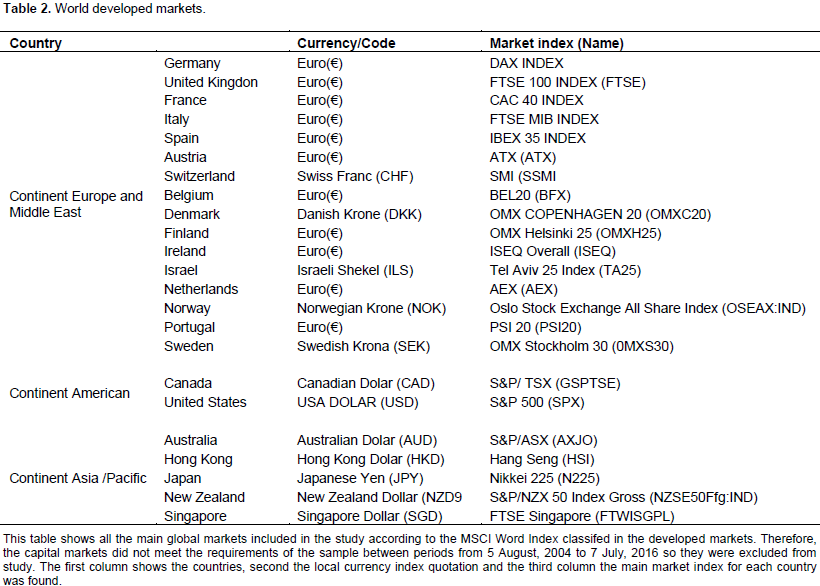
The sample consists of weekly data corresponding to the prices of the market index, collected in the Thomson Reuters Eikon. The database sample started 5th August, 2004 and ended on 7th July, 2016; making a total of 624 weekly observations collected of the forty two (42) major capital markets in the World, according to the classification given by MSCI World Index and thirteen (13) of the main African capital markets, as shown in Tables 1 to 3. Weekly returns measured in USA Dollar were considered. To measure the return, risk level, and composition of investment portfolios, we proposed the following optimization models: MV, RM, SV, MAD and FHS. To evaluate the relationship between capital markets, the correlation coefficient was used. Matlab was resorted to for the application of the optimization models and Excel to make the graphics of efficient portfolios and to estimate the performance indicators.

In-sample and out-of-sample approaches
In the first stage, the in-sample approach is used for the entire period T of returns observations, where the different investment strategies distribution is plotted and represented by curves of efficient frontiers. Then, to evaluate and measure portfolio performances and the contribution to diversification, we proposed Sharpe Ratio and Sortino Ratio according to the study of Lagoarde-Segot and Lucey (2007); and to measure the contribution of portfolio diversification, we proposed the measures suggested by Liang and McIntosh (1999). In the second phase, in line with the works of DeMiguel et al. (2009), Daskalaki and Skiadopoulos (2011) and Bessler et al. (2014), we applied the rolling sample approach, in order to understand the contribution of African assets in the diversification of Europe´s portfolios. This rolling sample methodology consists of considering a window with M observations for a given sub-period. The next step is to add one (1) more observation to window M (we considered M=5 years, corresponding to the 260 observations), forgetting the first observation, and calculating tangential portfolios that maximizes performance.
The process is repeated by always adding one more observation in the window and dropping the oldest observation and so on, inorder to determine the optimum portfolios for each window bearing until it gets the total observation (the total of 363 portfolios weights for out-of-sample analyses). The following out-of-sample evaluation is based on the performance of the following statistics:
Excess return (ER), risk (R), sharpe ratio (SR) and Sortino ratio (S) in order to realize the contribution of African markets to the diversification of global portfolios.
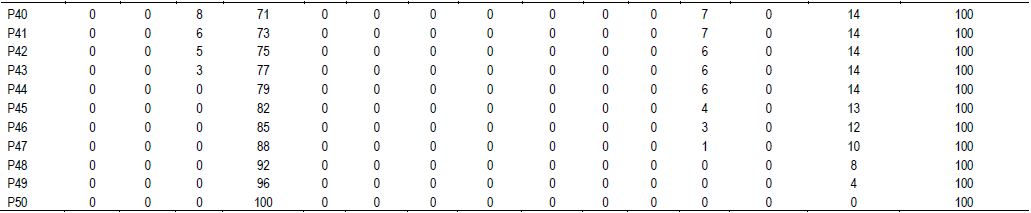
However, before following this methodology, we need to divide the sample into two sub-periods of 5 years (first sub-period starting from 5th August, 2004 to 3rd July, 2009 and second sub-period from 3rd July, 2009 to 7th July, 2016). Therefore, for the out-of-sample analysis, we have 2 sub-periods to evaluate the performance of the investment distribution strategies. To evaluate the contribution of African assets in the Global portfolio diversification, we defined some possible strategies that investors can follow. However, it is important to note that nothing assures us that foreign investors can adopt these strategies because as you know, each investor has his own profile when it comes to investment. We assume that a rational investor can choose these two strategies here presented:
Strategy 1: The investor makes an optimal distribution of 100 of his investment in global capital markets. We consider this portfolio composition such as domestic portfolios.
Strategy 2: The investor chooses to make an optimal distribution of 100 of his investment between global and African capital markets.
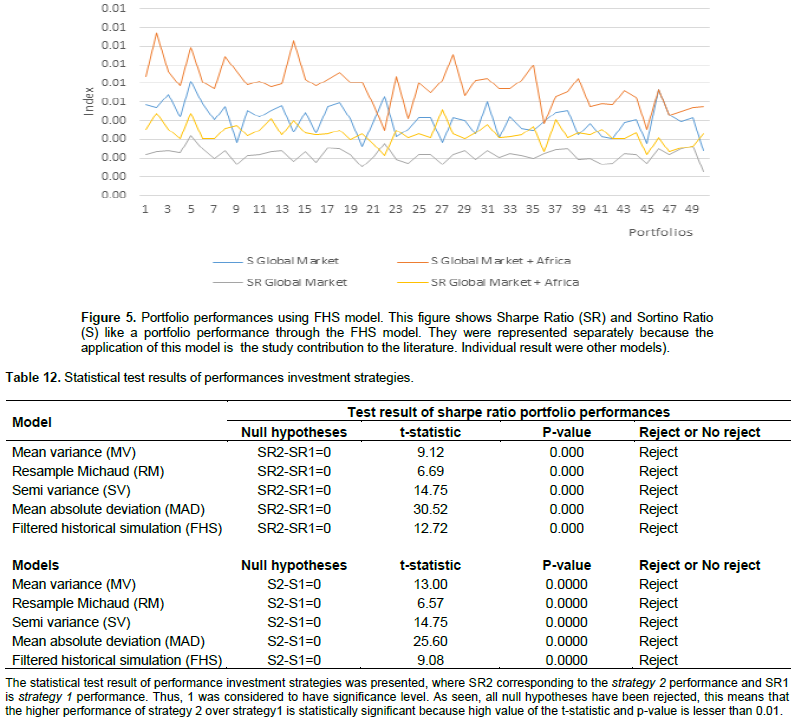
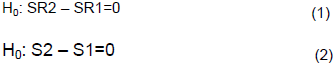
The in-sample analysis for each strategy are made of 50 optimal portfolios that include the efficient frontiers based on risk and return. To evaluate the performance of the strategies and test the statistical significance, we considered two (2) null hypotheses:

SR2 and S2 are the values of the Sharpe Ratio and Sortino Ratio index performances for strategy 2; SR1 and S1 are the values of the Sharpe Ratio and Sortino Ratio index performances for Strategy 1. The objective is to evaluate whether the differences between the performances of the strategies are statistically significant, considering a 1 significance level for both analyses. Therefore, we compare the diversification strategy with an undiversified strategy, that is Strategy 1.
Portfolio optimization models
Mean variance (MV)
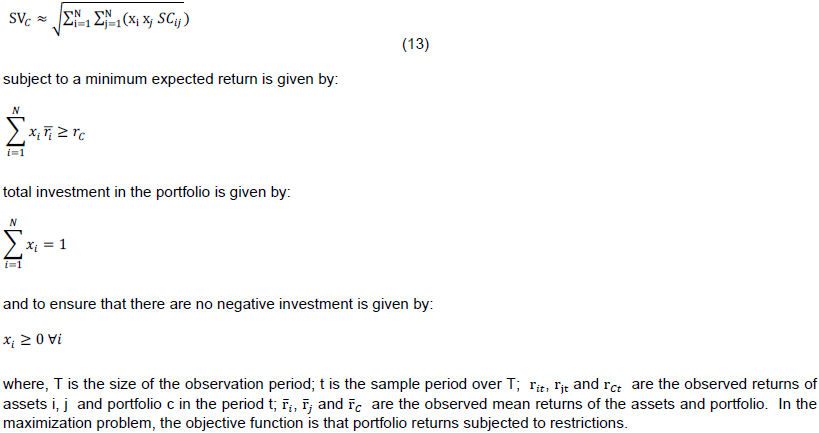
The first work on portfolio optimization was developed by Markowitz (1952) known as Mean Variance model (MV). This model suggests that making decisions on portfolio composition risk and return must be a criteria. The risk measure is standard deviation and the return measure is given by the average value of assets returns. Although it is highly criticized, it is a model widely used in financial studies. The Markowitz paradigm expects return and volatility to be relevant aspects that investors take into consideration when making decisions about portfolio composition. Thus, for the risk adverse investors the expectation to minimize risk to a given return limit, according to Markowitz (1952), can be expressed as:

Resample michaud (RM)
This method was developed by Michaud (1998) and according to Becker et al. (2015), the basic concept of Michaud (1998) comprises of three aspects:
(1) A generation of sequence of returns, which are statistically equivalent to the actual time series of returns, through a Monte Carlo Simulation.
(2) The subsequent determination of portfolio weights for every resample.
(3) The averaging over the obtained portfolio weights to obtain the optimal portfolio weights.
This method can be considered as a “sophistication” of the MV model but based on the simulation method.
The algorithm that explains how to implement this method is described as follows:
(1) From the original database, two parameters are estimated, the vector of expected excess returns (µ) and the variance-covariance matrix (∑).
(2) Resample applying multivariate normal distribution with mean µ and covariance ∑ considering T draws. For each resample that is generated, there is a new mean µ and covariance ∑ to estimate optimal portfolio weights over T draws; and
(3) Choosing the optimal portfolio weights depends on the required portfolio number. The portfolio risks and returns that make up the Efficient Frontiers by Michaud are then estimated.
Semivariance (SV)
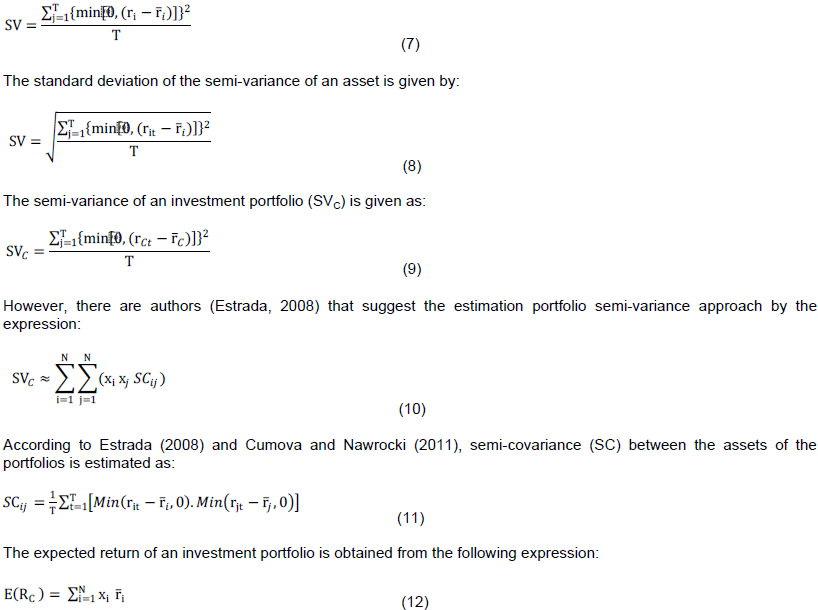
This model has emerged as an alternative to the mean-variance model (MV) which aims to remedy its shortcomings raised by scholars and researchers in the field of finance. Thus, Markowitz (1959) recognized the shortcomings of the MV model and proposed the SV model as the most appropriate measure of risk for investment portfolios. In general, according to Markowitz (1959), cited by Bond and Satchell (2002), the SV model for an individual asset is defined as follows:

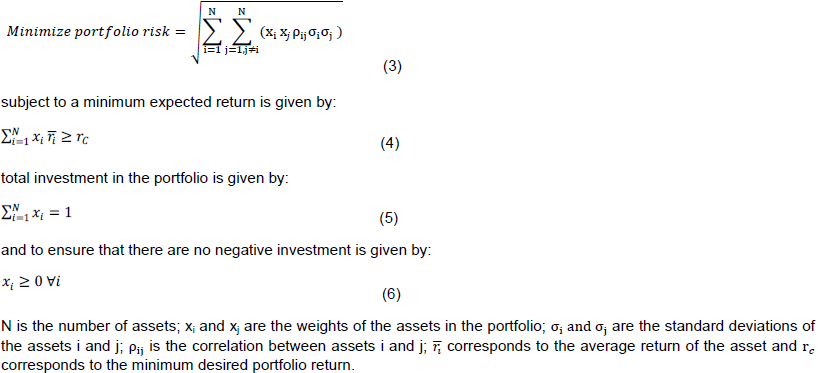
The mathematical formulation of the portfolio optimization problem using this model has as objective function to minimize the SV subject to certain restrictions as:
Minimize
Mean absolute deviation (MAD)
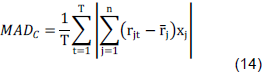
To overcome the shortcomings of the model mean variance, Konno and Yamasaki (1991) suggested the model MAD as linear programming or linear optimization of portfolios, where the risk measure is the designed Average Deviation Absolute. According to these authors, the MAD is based on dividing the distribution of a variable randomized into two groups, those afroementioned and below the average, and giving estimates for the absolute deviations of observations in each group from the average. MAD is preferred over standard deviation because of its propertises, especially when the distribution is not normal. It can still be designated as a model used to measure risk in the portfolio optimization (Miller and Ruszczynski, 2008), taking into consideration that the relevance for investors is to minimize the risks and maximize returns for their portfolios. It is a general measure of risk and can be used in other risk management practices (Xue and Titterington, 2011). The linear formulation takes advantage of a less computational effort (unlike quadratic formulation) and more applicability in practical terms (Moon and Yao, 2011). The authors formulated it as follows:

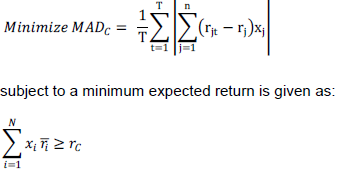
The mathematical formulation of the portfolio optimization problem posed by this model suggested by Konno and Yamazaki (1991) can be summarized by the following expressions:
total investment in the portfolio is given as:
and to ensure there are no negative investments is given as:

Filtered historical simulation (FHS)
This method is quite credible and acceptable among scholars and researchers. Some articles have addressed this method and it is use in the estimation of portfolio risk, but yet, unknown articles have used the FHS in portfolio optimization, and this is one of the important contributions of this study. Thus, through a simple clear language all steps for implementing the FHS method can be shown (Giannopoulos and Tunaru, 2005). The FHS is one of the methods of Value-at-Risk (VaR) that combines the traditional method Historical Simulation (HS) with volatility models (Garch or EGARCH). The algorithm to implementation in determining the level of risk and portfolio optimization requires some steps:
(1) Application of the historical simulation method.
(2) Estimation of volatilities of returns series of the portfolios through the GARCH (1.1) model.
(3) Estimation of residual returns standardized, obtained by dividing the residual value of returns by the respective variance.
(4) Application bootstrapping method where each standardized return period t randomly multiplies the variance of the period t + 1; and finally
(5) Estimates the VaR through the percentile of returns, considering a certain confidence interval, significance level, and period of portfolio tenure.
Historical simulation (HS)
The application of VaR method is quite simple and requires some steps:
(1) The estimation of periodic returns of the assets that makes up the initial portfolio
(2) Periodic portfolios, adding the products of periodicals returns of each asset at its initial weight is estimated to be 1 / N, where N is the total number of assets.
(3) Considering a certain significance level and period detention portfolios, estimated VaR, which is given by the expression:

Where,  is the periodic return of the asset i and m refers to the observation period (m only illustrates the period that corresponds to summation, which does not have any mathematical effect on the formula) and α corresponds to the specified significance level.
The GARCH volatility model
It is assumed that the GARCH (1.1) model is to estimate periodic variances of portfolios. However, nothing ensures the possibility of the historical returns of the assets assuming a normal distribution or t-student. Considering the simple GARCH model, standardized residual returns are estimated by the expression:
and, ω, φ and β are model parameters whose estimation can be by maximizing the sum of the function Maximum Likelihood Estimation (MLE) which is given by the expression similar to that of Aldrich (1997):
Bootstrapping method
This method, given a certain period of detention portfolios from observations of standardized residual returns, randomly generates return for period t to be multiplied by the variance in period t + 1. Random returns of portfolios will be estimated with the FHS VaR, which can be given by the expression:
The use of this method in portfolio optimization requires some care because the process is a little different from other methods, although apparently it has an almost similar mathematical formulation. There are two (2) objectives function to consider:
Performance measures and contribution of portfolio diversification strategies
Sharpe ratio (SR)
The SR index of a particular investment strategy is measured by the ratio between the risk premiums or excess return, and risk of strategy i as the expression (Sharpe, 1994):
In that, corresponds to the risk premium (risk-free rate asse) and is the risk of strategy i. This indicator shows how much the investor receives the strategy i defined for each unit of risk associated with the strategy i. The higher value for this measure indicate higher quality of the investment in the strategy i. Assuming a normal distribution, to determine whether SR and S between the strategies are statistically significant, we propose two-sample t-test according with the Matlab code in the appendices to test the null hypotheses.
Sortino ratio (S)
Just as Sharpe ratio, the Sortino ratio is also an important statistical indicator used to measure the investment portfolio performance. Dr. Frank Sortino proposed it in the 80s. However, it is different from Sharpe Ratio because it uses the standard deviation of negative returns; while Sharpe Ratio uses the standard deviation of positive and negative returns. This is one of the reasons appointed as insufficient of MV model. The Sortino ratio is a modification of the Sharpe ratio, and can be expressed by:
Contribution measures of portfolio diversification
To measure the contribution of African capital markets assets in global portfolio, we propose three measures according to the study of Liang and McIntosh (1999):
Overall benefit (OBi)
This indicator measures the general benefit of the investment diversification effect, that is, it measures benefits in reducing risk and return. It is given by the following expression:

Diversification benefit (DBi)
This indicator measures only the benefits of investment diversification in the risk reduction. It is given as follows:
Return benefit (RBi)
This indicator measures only the benefits of investment diversification in the return. It is represented by the expression:

In- sample analysis
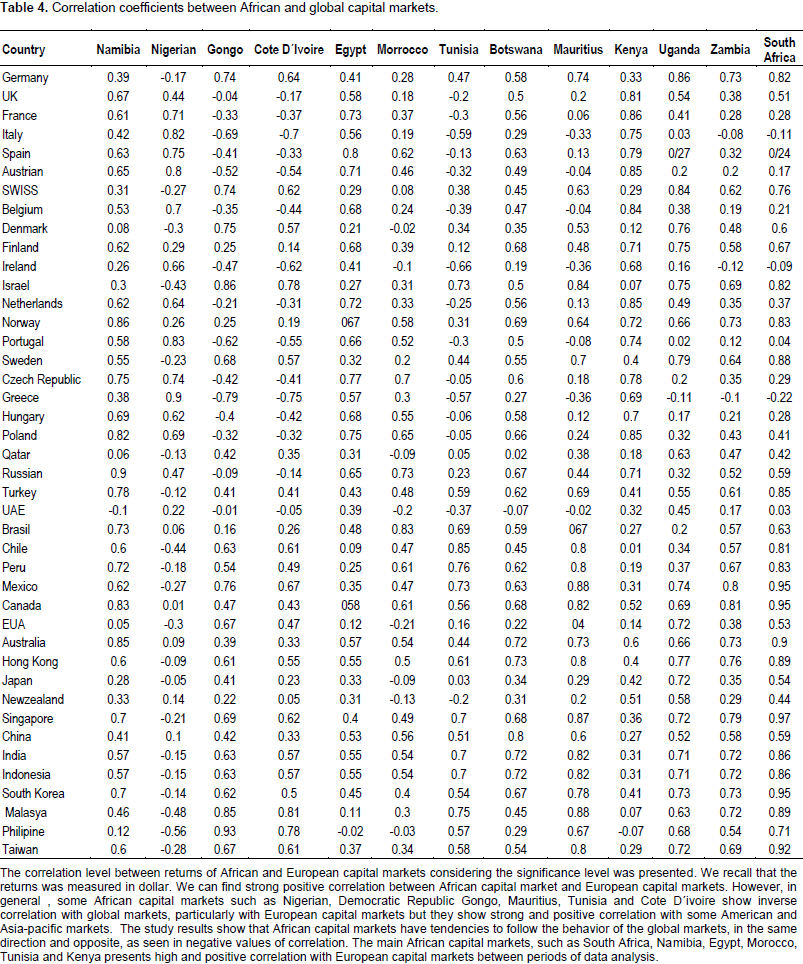
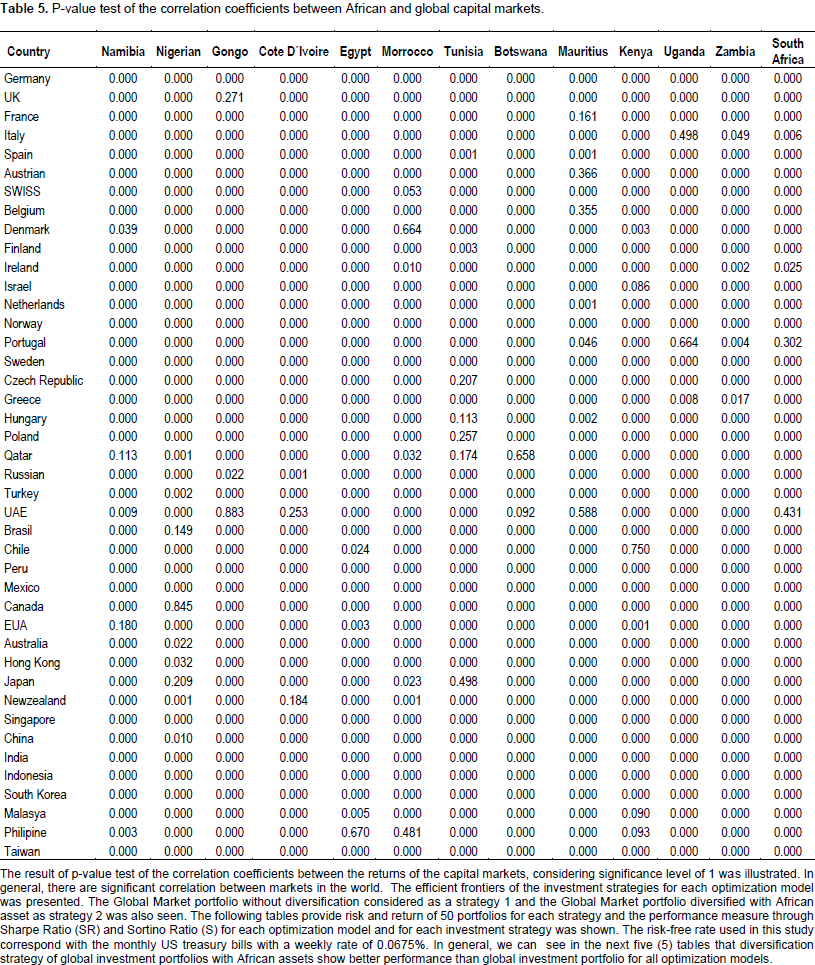
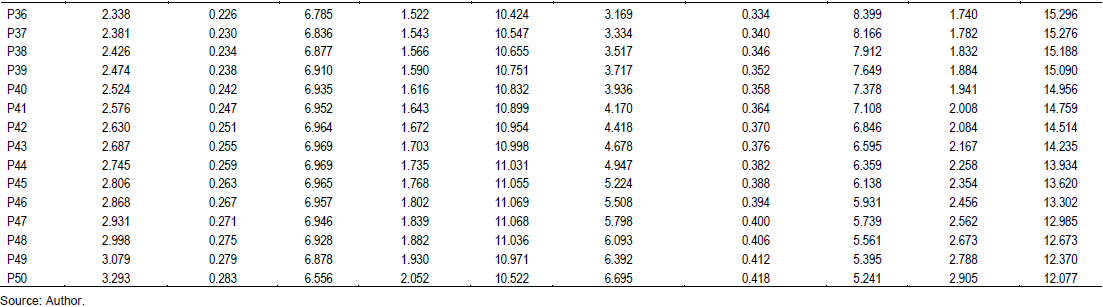
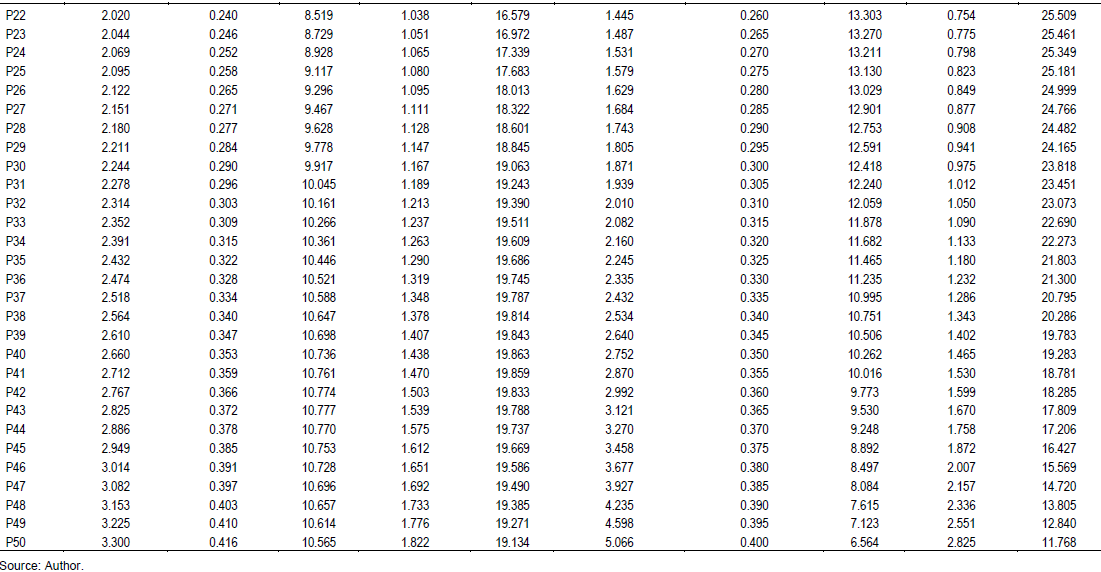
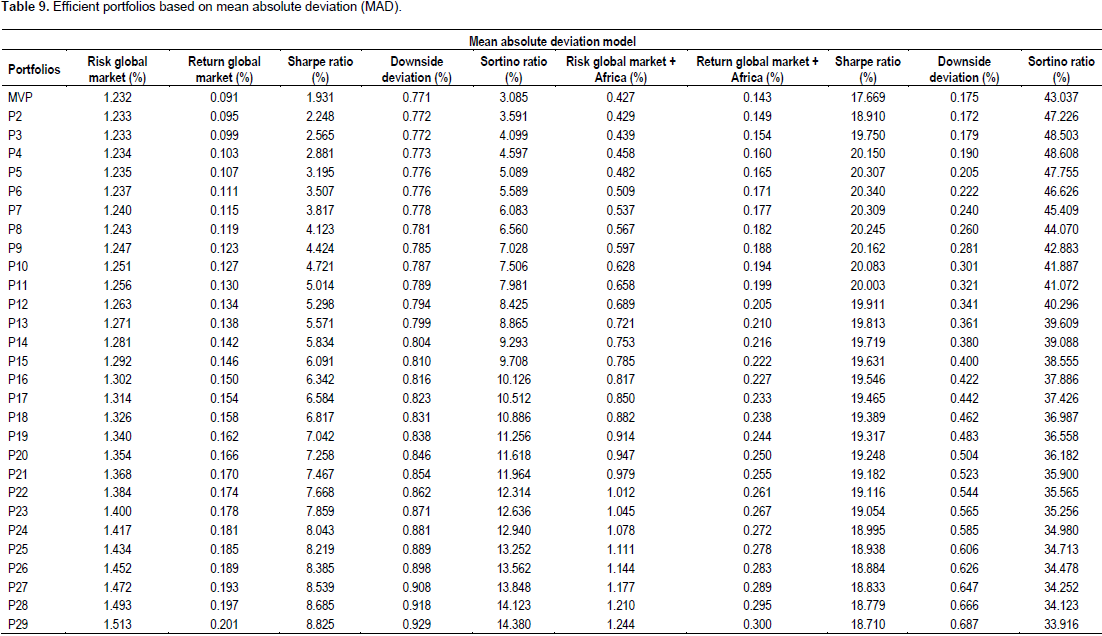
In analyzing Table 4, strong positive and negative correlation between African and World capital markets can be found. However, African capital markets in general shows significant positive correlation with world capital markets. The study results show that there are African capital markets with the tendencies to follow the behavior of World capital markets but also we can find African capital market with behaviors that are contrary to the global markets, such as Rep. Democratic Gongo, Cote D´ivoire, Nigerian, Morocco, Tunisia and Mauritius. The most important African capital markets like South African, Namibia, Egypt, Kenya, Botswana, Uganda and Zambia presents significant and positive correlation with World capital markets between periods of data analysis from 5th August, 2004 to 7July, 2016 as seen in the test p- value results correlation shown in Table 5 considering the significance level of 1. For in-sample analysis, Tables 5 to 10 shows the results for each strategy based on trade-off risk and return, where we can find global portfolio optimization before and after diversification with their respective performances based on optimization models. The results shows that the global portfolio diversification with African assets contributes in reducing the risk and maximizing the return.


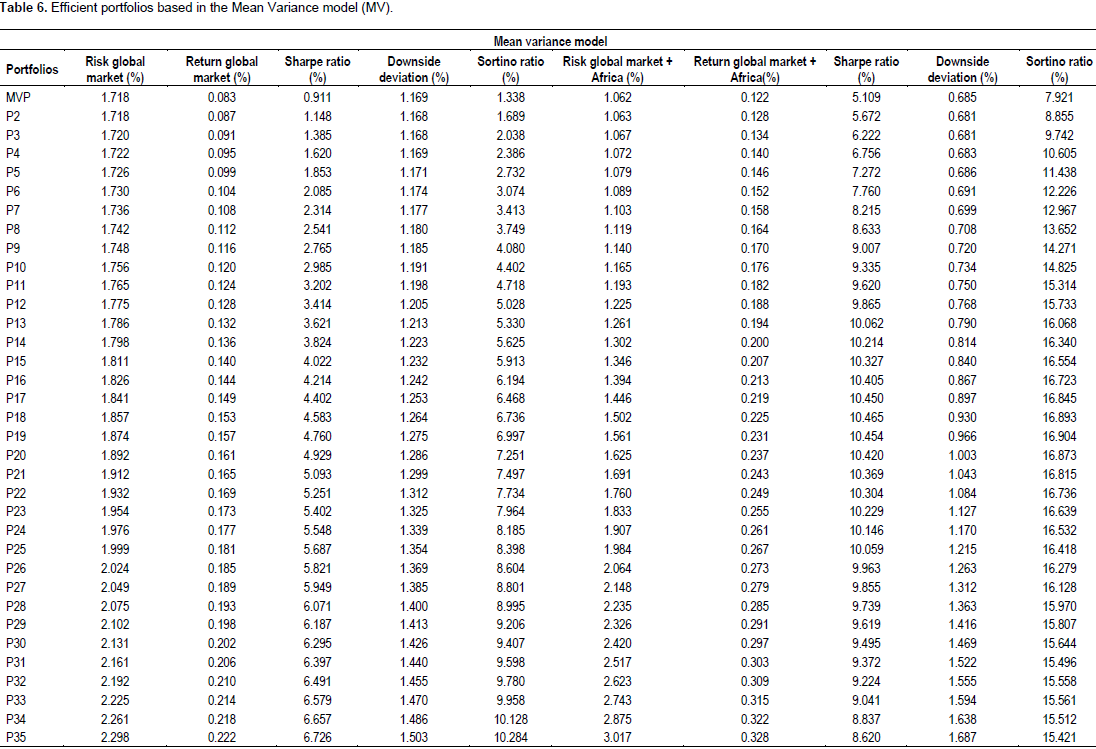

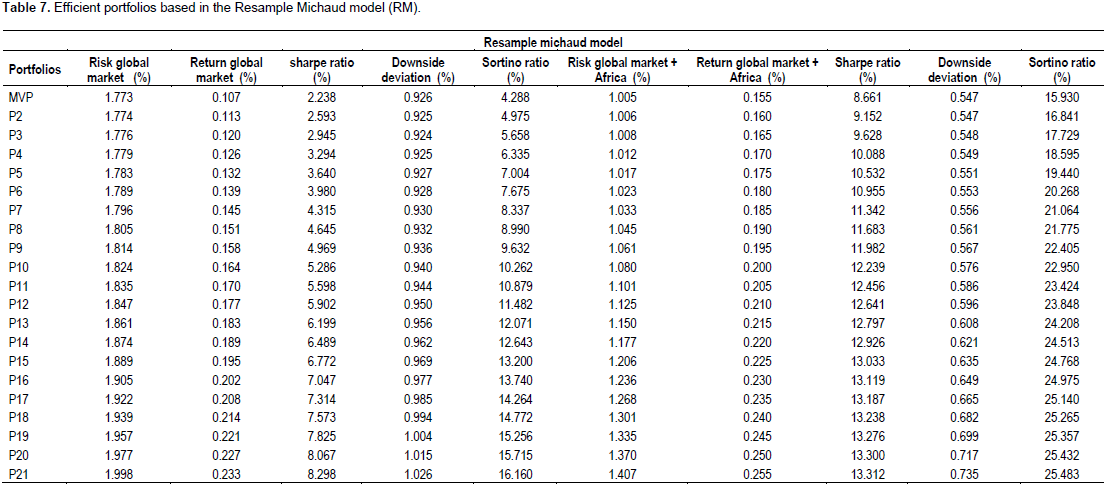


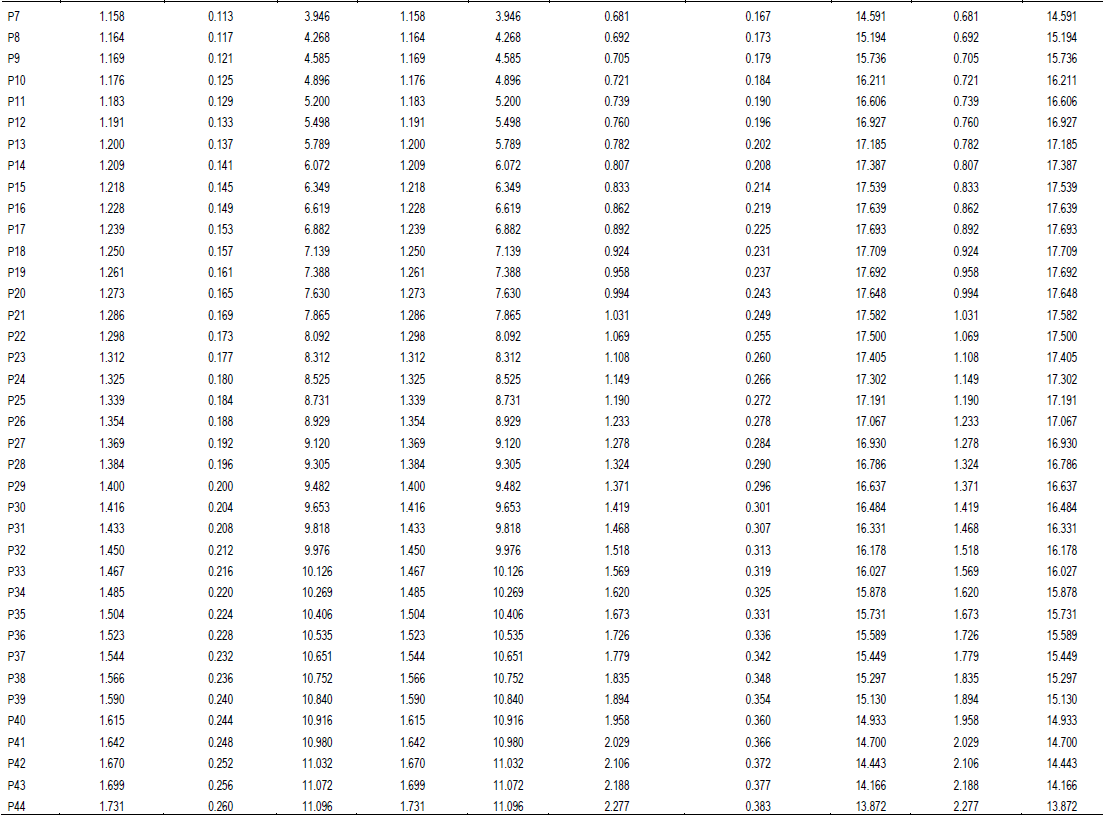


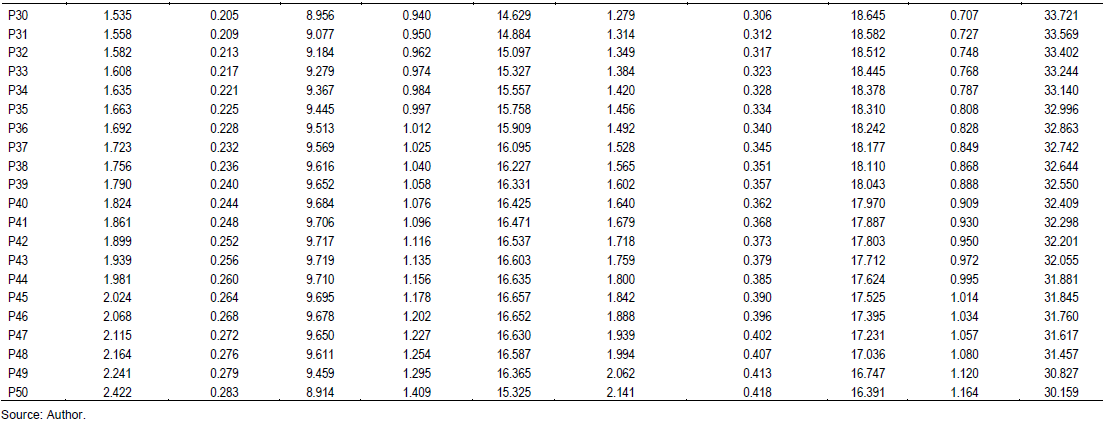

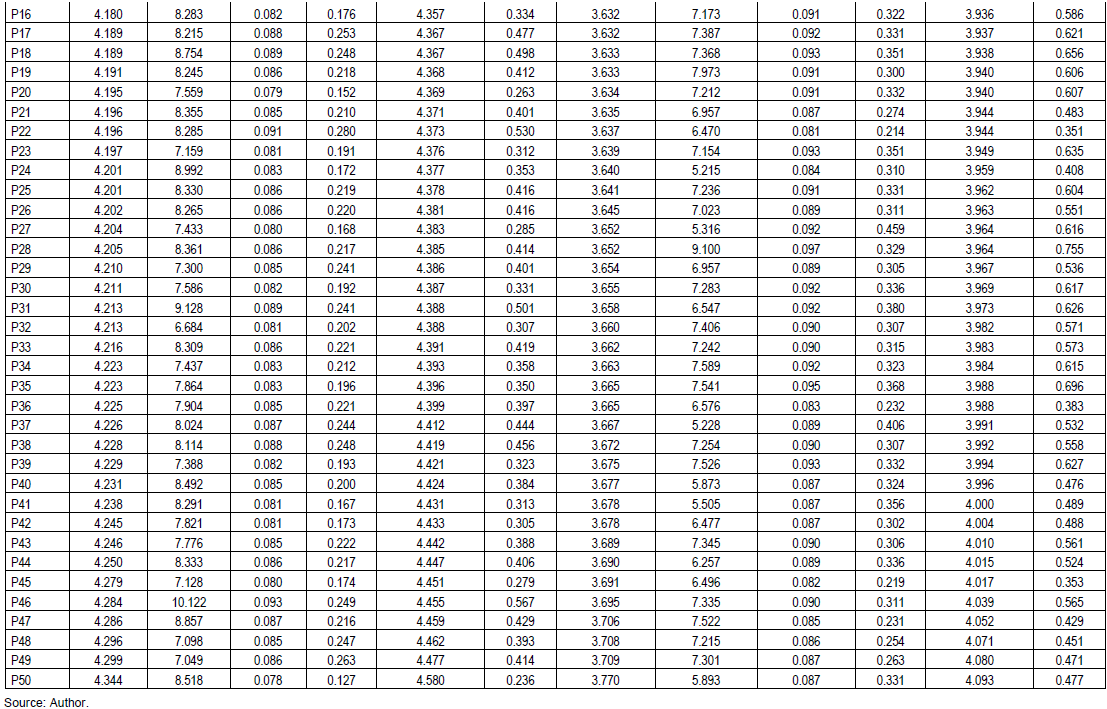
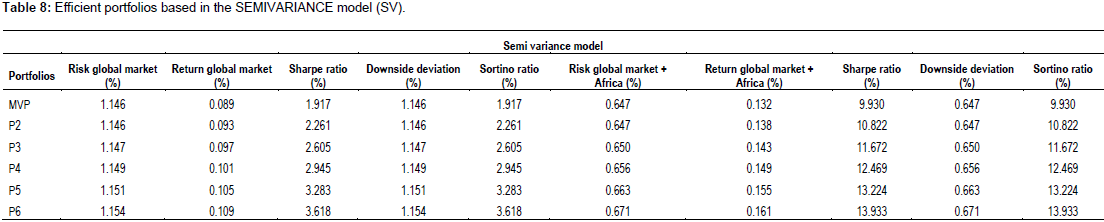
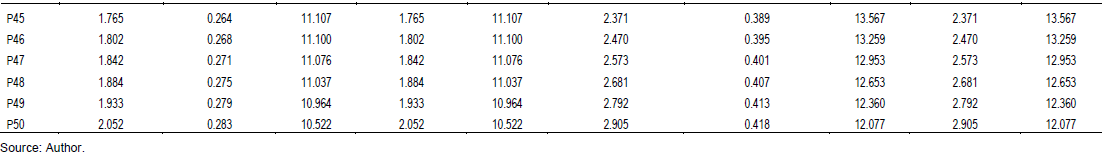
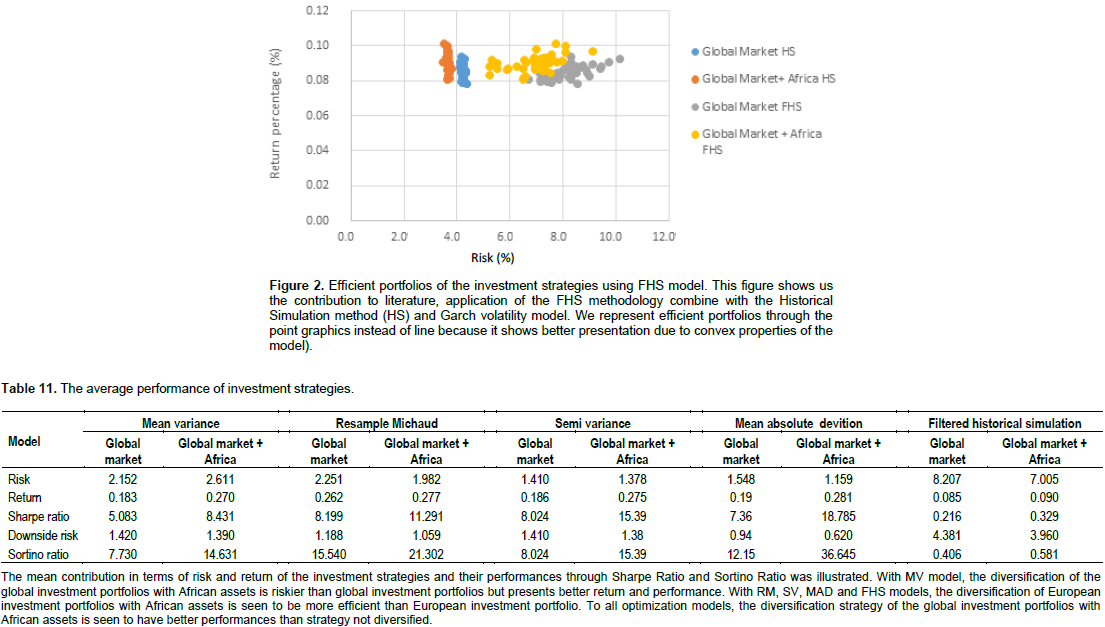
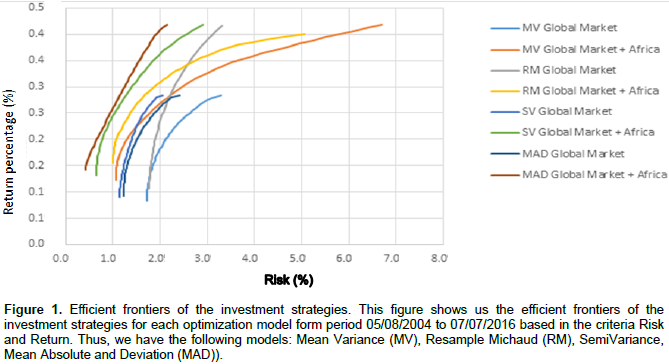
As Figures 1 and 2 shows, we can see different efficient frontiers for each of the optimization models used in this study that represents the two (2) investment strategies. To all optimization models, the strategy of the global portfolio diversification with assets of the African capital market show higher return than global portfolio without diversification as illustrated in Table 11. On the other hand, on the same table for MV model, the global portfolio diversification with assets of African capital market increase the risk level but for SV, RM, MAD and FHS models, it does not increase. In other words, for these models, global portfolio diversification with assets of African capital markets reduces the risk level. However, the diversification strategy of global portfolio with assets of African capital markets presents better performance than global portfolio without diversification, according to the results of the Sharpe Ratio and Sortino Ratio performance in Figures 3 to 5 where the African capital markets in the diversification global portfolio was observed. These results are statistically significant for all models included in the study, since it rejects all null hypotheses according to the results on Table 12.


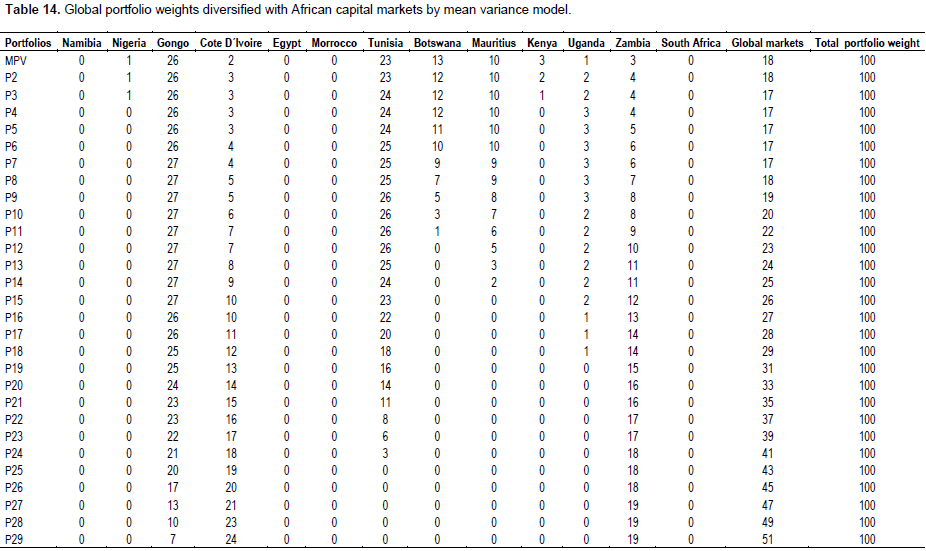
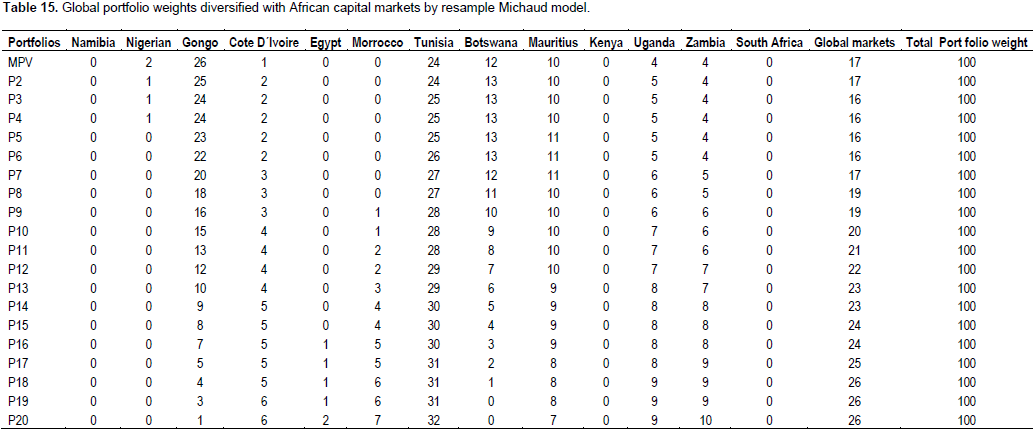
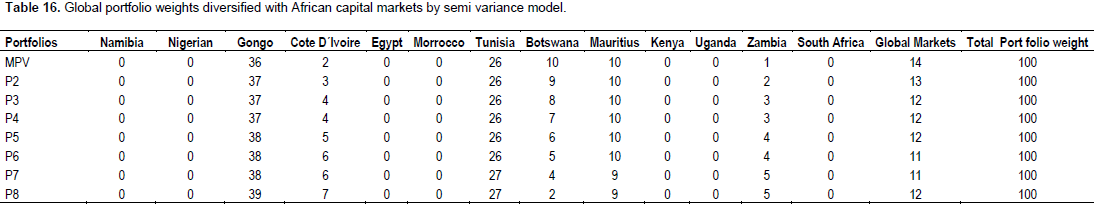
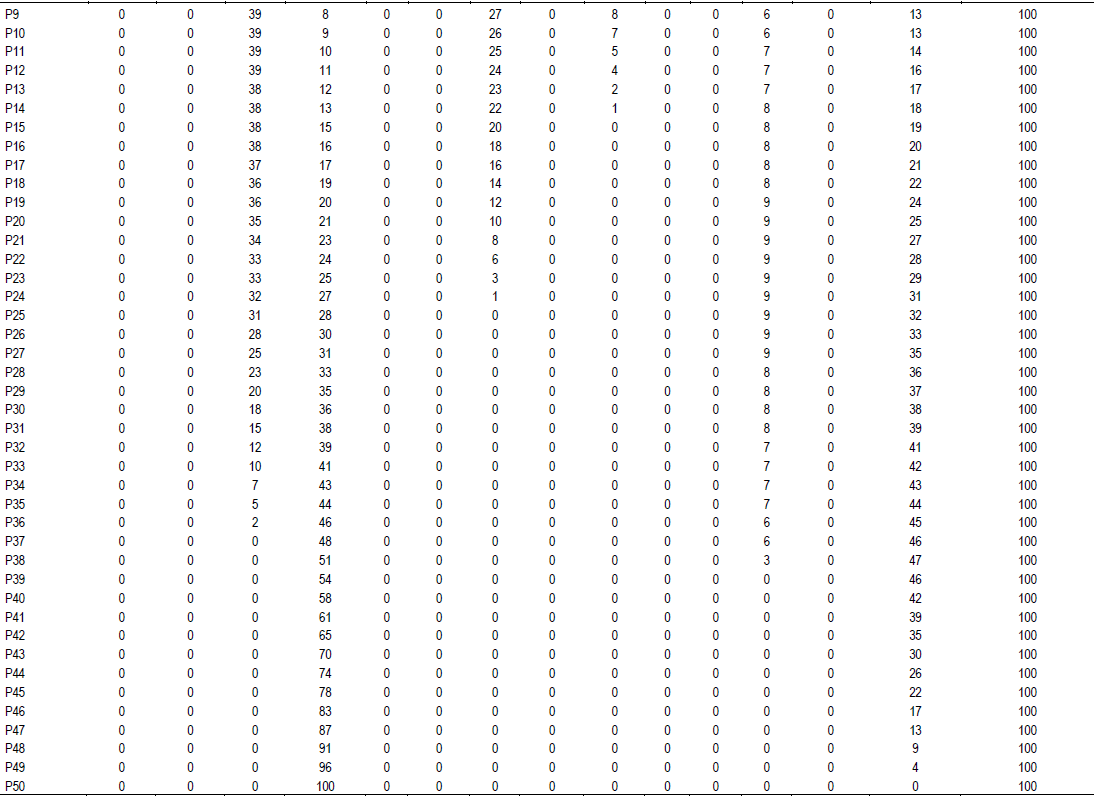
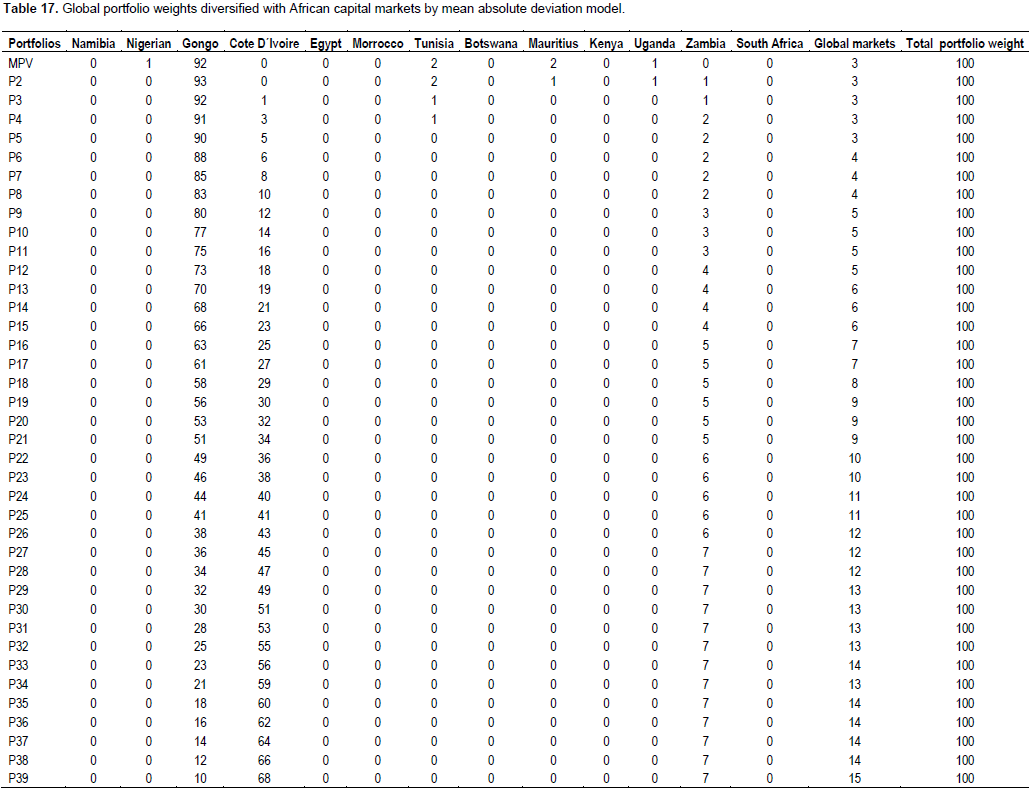
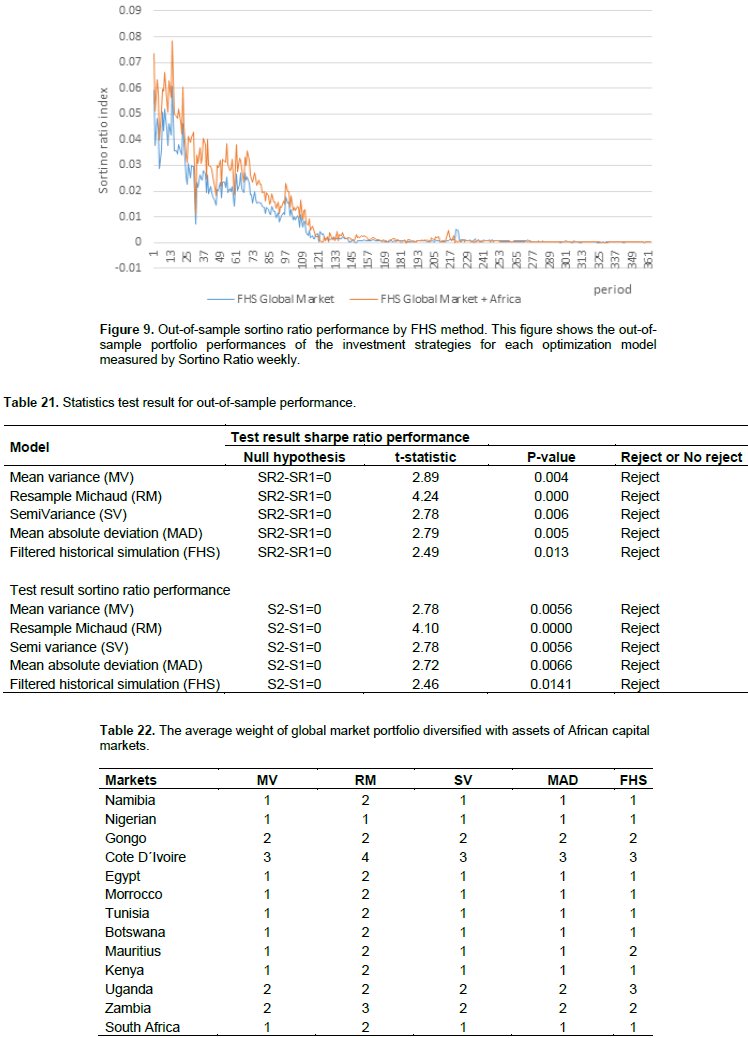
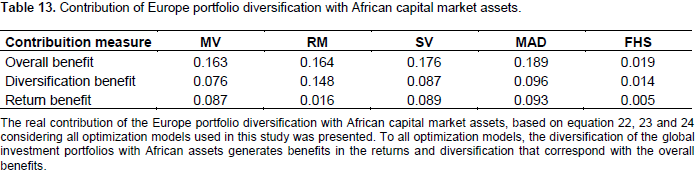
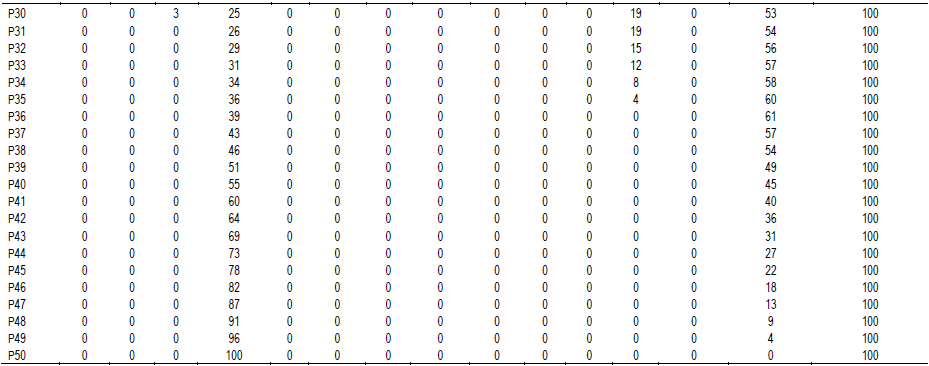
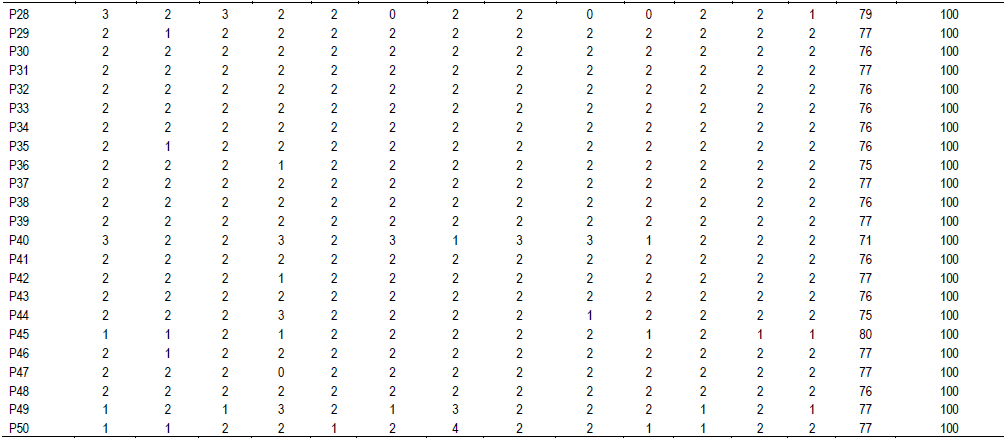
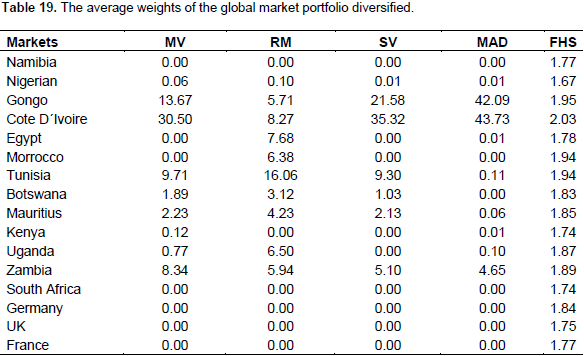
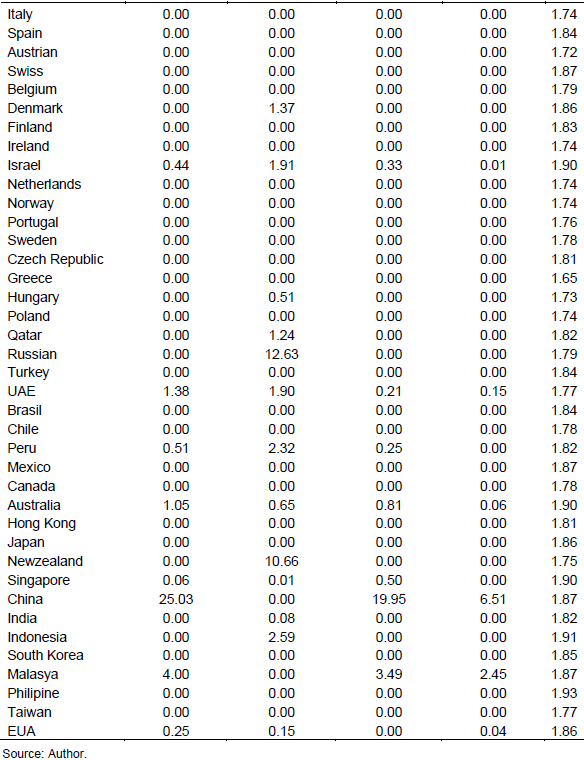
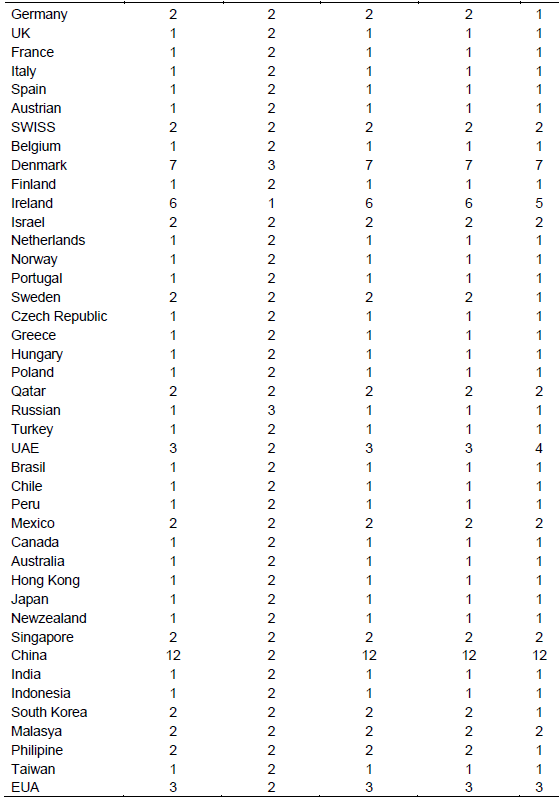
Therefore, the investment strategy 2 shows better performance than strategy 1. The real contribution of the diversification of global portfolio with assets of African capital markets is illustrated in Table 13. For all models, this strategy generates benefit in diversification and return benefit as shown in Table 13. We can see weak contribution of the World capital markets in the diversification of global portfolio, being outweighed by large contributions of the African capital markets. According Tables 14 to 19, the African capital markets with great performance in the composition of the global portfolio diversifying with higher weights are; Cote D´ivoire, Republic Democratic Gongo, Zambia and Tunisia. Already with less weight, we found the following markets; Botswana, Mauritius, Egypt, Uganda, Nigerian, Egypt, Namibia and South Africa. According to MV, RM, SV and MAD models, the study data analyses shows that in general, the African capital markets are efficient in the global portfolio composition as we can see their weights in the first portfolios.


In summary, the study in-sample analysis of the database in the period considered allows the realization that the diversification of global portfolio with assets of African markets contributes in reducing risk and maximize the return of the portfolio, where investor prefer high level of risk at the expense of a high return.
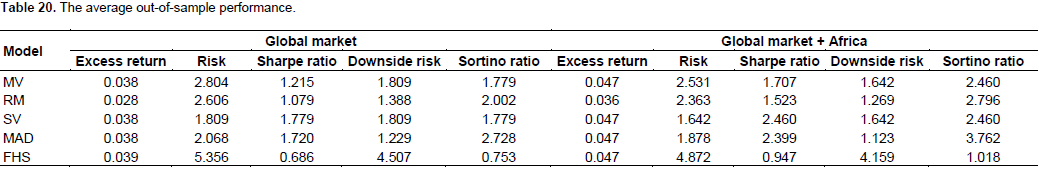
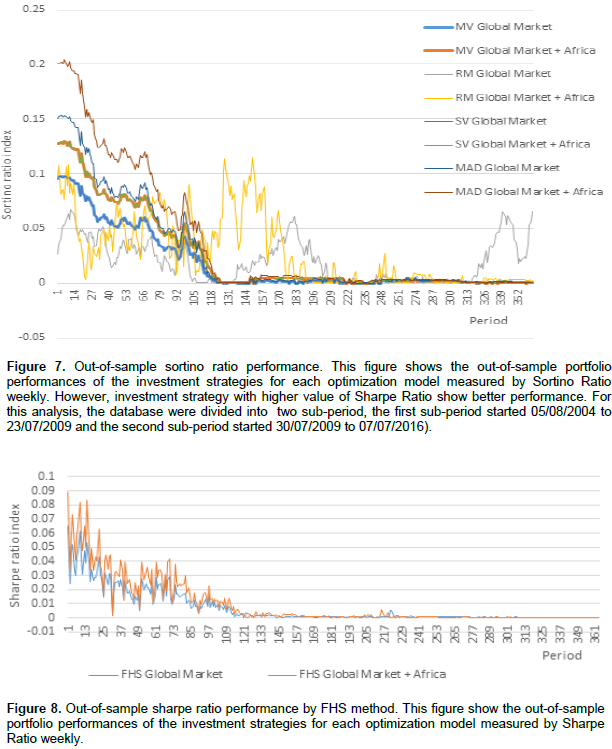
Out-of-sample analysis
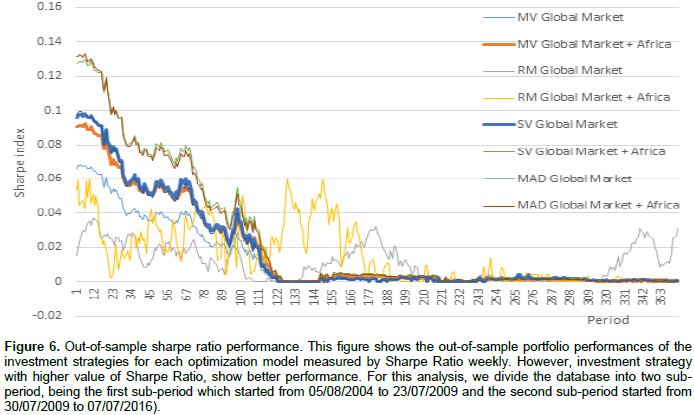
In this analysis, we also analyzed the contribution of the African capital market in the global portfolio diversification using out-of-sample analysis. Furthermore, the objective of this methodology is to analyze the portfolio performance measured by ER, risk (R), SR and S over the period where it is applied by the rolling sample approach. The study out-of-sample results show that the strategy of diversification of global portfolio with assets of African market present better performance measured by ER, Risk, SR and Sortino Ratio than global portfolio according to the models as shown in Table 20 and Figures 6 to 9. To test statistically, the study investment performances was measured by SR and Sortino ratio, Table 21 provided the test results. For all optimization models, MV, RM, SV, MAD and FHS shows the rejection of the null hypotheses. The result shows high positive analysis which is also a great contribution to the African capital market in the global portfolio composition as seen in Table 22.


The study data analysis from the period of 5th August, 2004 to 7th July, 2016 using the optimization models MV, RM, SV, MAD and FHS allowed the study to conclude that the diversification of global portfolio with assets of African capital market contributes in minimizing the risk and maximizing the return of the portfolio for the risk averse investors. On the other hand, for risk loving investors, the diversification of global portfolio with assets of African capital markets increase the level of risk; but the benefit returns compensate for the risk increase. The study results are also in line with other studies (Lagoarde-Segot and Lucey, 2007; Yu and Hassan, 2008; Mansourfar et al., 2010) in the context of the international diversification. The study results suggested that the foreign investors should look for an African capital market for an opportunity to maximize their wealth and diversify the investment risk.
In the same order, the study result contributes to the discussion on the advantage of international diversification, even if it took place in the African context; and it further contributes to the literature through application of the FHS in the optimization portfolio. This methodology in addition of producing good results, reveals being more cautious in the constitution of investment portfolios than the other methods. However, this model presents lesser returns than others models. The result of this study is important for Africa because it encourage the European, American, and Asia-Pacific investors to transfer part of their financial wealth to Africa by buying assets of African companies. These companies can help with the financial resources to develop new project which will pave way in improving the quality of lives of Africans.
On the other hand, these African companies can also use these financial resources to create new jobs that will encourage people to stay in their country, which will also reduce illegal immigration.
For example, like the tragedy of deaths in the seas of the Mediterranean as it has been happening where thousands of people lose their lives trying to cross seas in small boat in the hope to find better quality of life in Europe and help their family that are in Africa. Many of these people could not get to Europe due to the bad traveling conditions, ruining their lives and dreams in the seas.The result of this study encourages global investors to look at this problem and help Africa to solve it by buying African assets that can increase the value of their investment portfolios. The result of this study can contribute in the same way to provide transfer of knowledge or idea to Africa through canalization of these investments; this is because sometimes where there are money transfer new ideas are also shared. We can say that the result of this study can indirectly contribute to eliminate the inequality between other continents and Africa, through their investors that are looking for means to diversify their portfolios with African assets. On the other hand, this attitude on the part of global investors with the idea of buying African assets can contribute to poverty eradication in Africa.


 is the periodic return of the asset i and m refers to the observation period (m only illustrates the period that corresponds to summation, which does not have any mathematical effect on the formula) and α corresponds to the specified significance level.